
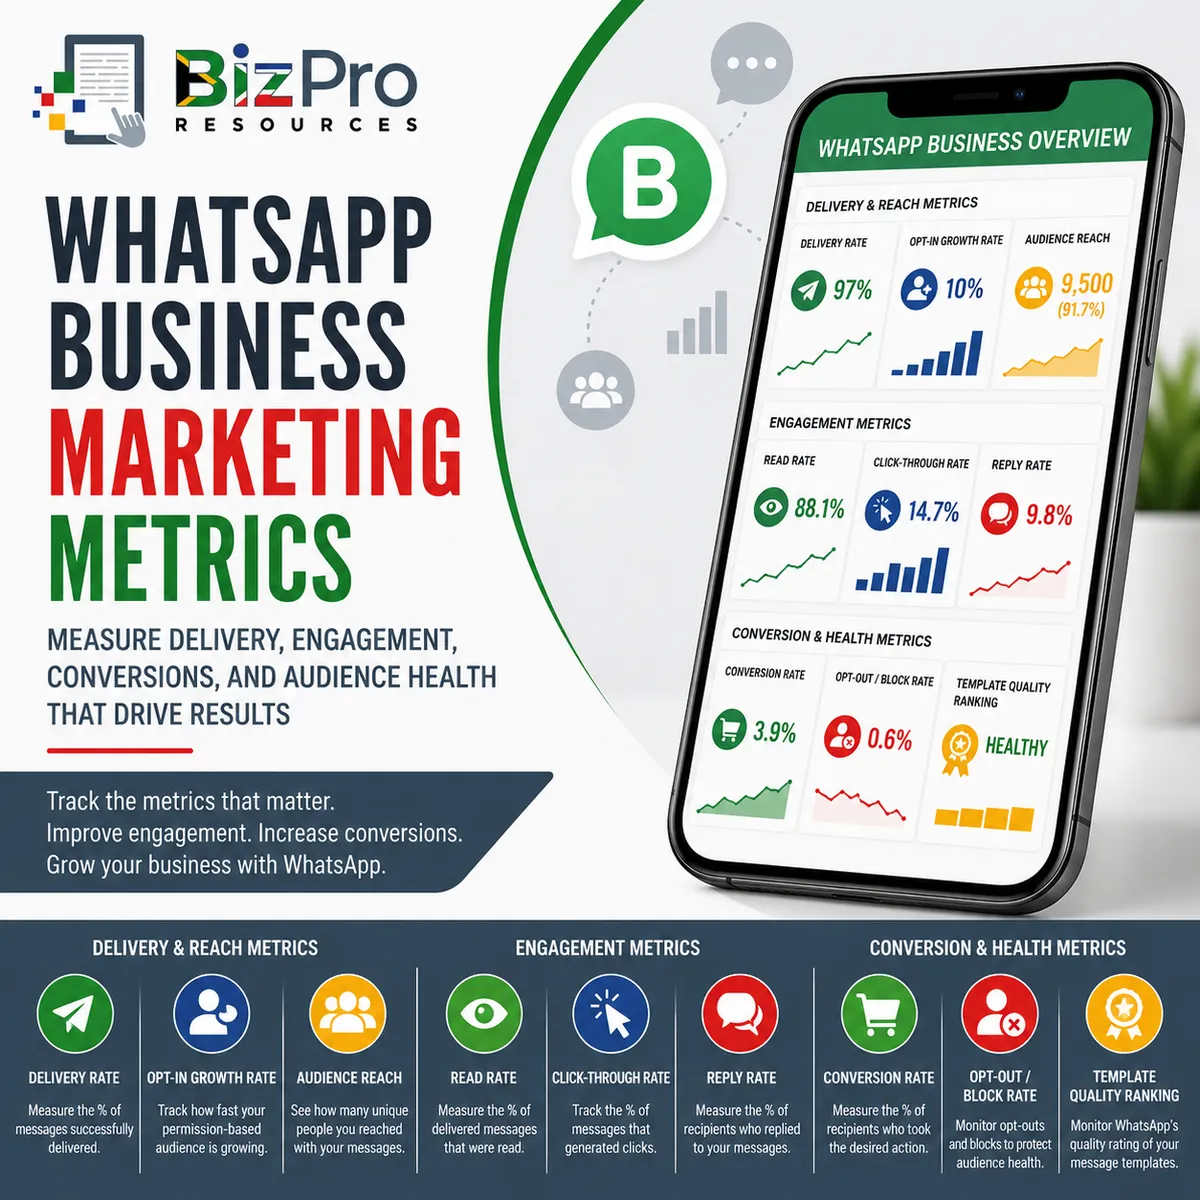
WhatsApp Business Marketing Metrics: Delivery, Engagement, Conversions, and Audience Health Explained
Article #7 of #7 in the Marketing Performance Metrics Series
Introduction
WhatsApp has become an important communication channel for businesses in South Africa.
For many customers, sending a WhatsApp message feels easier and more natural than completing a website form, sending an email, or making a telephone call.
Businesses can use WhatsApp to:
Answer customer questions.
Send order and appointment updates.
Follow up with leads.
Share promotions with customers who have opted in.
Send useful information.
Provide customer support.
Encourage repeat purchases.
Direct customers to websites or online stores.
Generate quotation requests.
Maintain ongoing customer relationships.
For smaller businesses, WhatsApp can be particularly attractive because customers already use the platform as part of their daily communication.
But there is an important difference between using WhatsApp and measuring WhatsApp marketing effectively.
A business might send thousands of messages and assume that the campaign is successful because the messages were sent.
That does not tell management:
Were the messages actually delivered?
How many customers were reached?
Did people read them?
Did they click?
Did they reply?
Did they take the desired action?
Are people opting out or blocking the business?
Is the quality of the company's messaging deteriorating?
WhatsApp Business marketing metrics help management answer these questions.
For practical purposes, we can organise these metrics into three groups:
Delivery and Reach Metrics
Delivery Rate
Opt-In Growth Rate
Audience Reach
Engagement Metrics
Open / Read Rate
Click-Through Rate (CTR)
Reply Rate
Conversion and Health Metrics
Conversion Rate
Opt-Out / Block Rate
Template Quality Ranking
Together, these metrics help a business understand the complete journey:
Permission → Delivery → Reach → Read → Engage → Respond → Convert → Retain
That is far more useful than simply asking: “How many WhatsApp messages did we send?”
Delivery and Reach Metrics
Before a customer can respond to a WhatsApp marketing message, the business first needs an audience and the message needs to reach that audience successfully.
This makes delivery and reach the starting point for WhatsApp marketing measurement.
1. Delivery Rate
What Is Delivery Rate?
Delivery Rate measures the percentage of sent WhatsApp messages that are successfully delivered to recipients.
Sending a message does not necessarily mean that the message reaches the customer's device or account.
A message may fail to deliver for various reasons, depending on the messaging setup and circumstances.
Delivery Rate therefore helps answer: “Of all the WhatsApp messages we attempted to send, how many were successfully delivered?”
This is an important foundation metric.
If messages are not being delivered, customers cannot:
Read them.
Click links.
Reply.
Purchase.
Book.
Enquire.
Poor delivery therefore limits every later stage of the campaign.
How Is Delivery Rate Calculated?
A simple formula is: Delivery Rate = Delivered Messages ÷ Sent Messages × 100
Suppose a business sends: 5,000 messages
Of those: 4,750 are delivered
The calculation is: Delivery Rate = 4,750 ÷ 5,000 × 100 = 95%
This means 95% of the sent messages were successfully delivered.
The remaining: 5,000 − 4,750 = 250 messages were not recorded as delivered.
Example of Poor Delivery Rate
Imagine a vehicle service business sends appointment and promotional messages to 10,000 contacts.
The results are:
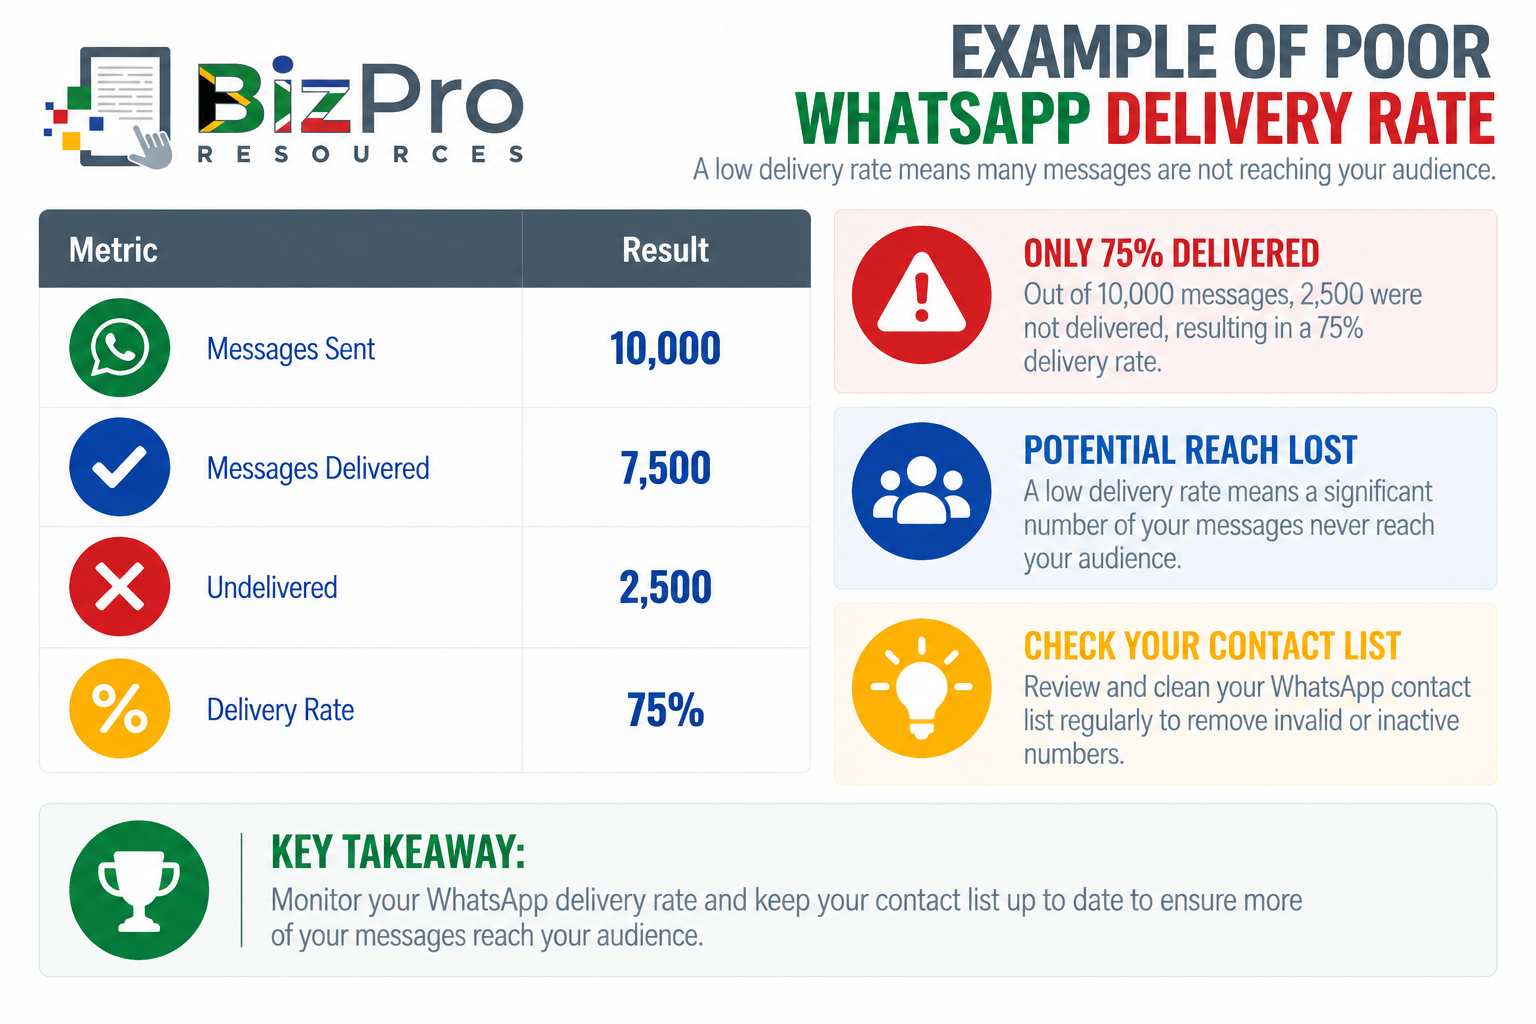
The calculation is: 7,500 ÷ 10,000 × 100 = 75%
Assume the company's normal delivery rate is around 95%.
A drop to 75% therefore represents poor performance and deserves investigation.
What Does Poor Delivery Rate Mean for the Company?
Poor delivery performance means a significant portion of the intended audience is not receiving the messages.
Possible reasons could include:
Outdated customer contact information.
Invalid telephone numbers.
Customers no longer using particular numbers.
Technical delivery problems.
Messaging restrictions.
Poor contact database maintenance.
Problems with the company's messaging setup.
The financial impact can be significant.
Suppose the campaign was expected to generate bookings from 10,000 customers.
If 2,500 messages are never delivered, 25% of the intended audience never even has an opportunity to respond.
Management should therefore investigate delivery problems before blaming the marketing offer itself.
Example of Good Delivery Rate
The vehicle service business cleans its customer database and improves its contact collection process.
The next campaign produces:
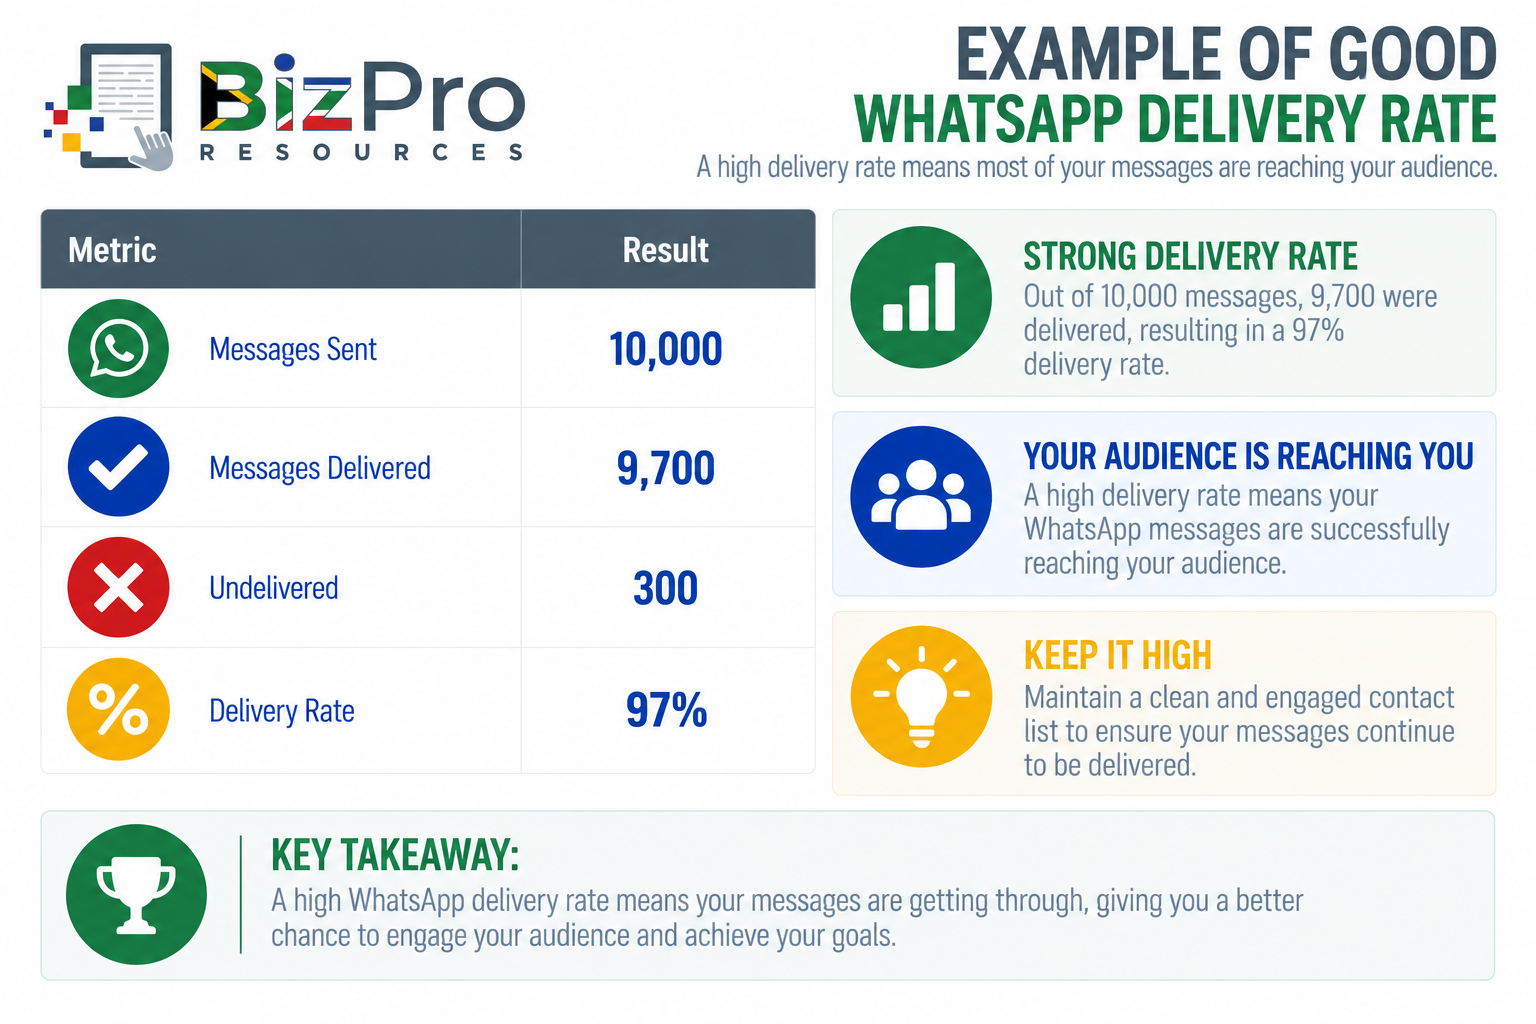
The calculation is: 9,700 ÷ 10,000 × 100 = 97%
What Does Good Delivery Rate Mean for the Company?
A 97% delivery rate means the vast majority of intended recipients are successfully receiving the messages.
The business now has a much stronger foundation for:
Reads.
Clicks.
Replies.
Conversions.
But delivery alone does not mean the campaign succeeded.
A message can be successfully delivered and completely ignored.
That is why delivery must be connected to engagement metrics later in the process.
2. Opt-In Growth Rate
What Is Opt-In Growth Rate?
Opt-In Growth Rate measures how quickly the number of people who have agreed to receive WhatsApp communications from the business is growing.
Permission is extremely important in business messaging.
A company should not view every telephone number it possesses as automatic permission to send unlimited marketing messages.
An opt-in audience consists of people who have given the relevant consent or permission to receive communications through the channel.
Businesses may encourage appropriate opt-ins through:
Websites.
QR codes.
Store signage.
Online forms.
Customer registration.
Advertising campaigns.
Social media.
Checkout processes.
Customer service interactions.
Opt-In Growth Rate answers: “Is our permission-based WhatsApp audience growing?”
How Is Opt-In Growth Rate Calculated?
A useful formula is: Opt-In Growth Rate = Net New Opt-Ins ÷ Starting Opt-In Audience × 100
Net New Opt-Ins can be calculated as: New Opt-Ins − Opt-Outs
Suppose a business starts the month with: 4,000 opted-in contacts
During the month:
500 new people opt in
100 people opt out
Net growth is: 500 − 100 = 400
Therefore: Opt-In Growth Rate = 400 ÷ 4,000 × 100 = 10%
The permission-based audience grew by 10%.
Example of Poor Opt-In Growth
Imagine a Cape Town retailer begins the month with 8,000 opted-in contacts.
During the month:
New Opt-Ins = 100
Opt-Outs = 300
Therefore: Net New Opt-Ins = 100 − 300 = −200
The growth rate is: −200 ÷ 8,000 × 100 = −2.5%
The WhatsApp audience is shrinking.
What Does Poor Opt-In Growth Mean for the Company?
Negative or weak growth could indicate:
Too few new customers are opting in.
Existing subscribers are leaving.
Messages are being sent too frequently.
Content is not useful.
Promotions are repetitive.
Customers do not see enough value in staying subscribed.
The opt-in process is difficult to find.
Staff are not explaining the benefit of joining.
The business is failing to promote its WhatsApp channel.
Management should distinguish between two problems:
Not enough people are joining
Too many existing people are leaving.
The solutions may be very different.
Example of Good Opt-In Growth
The retailer introduces:
QR codes at checkout.
A website WhatsApp sign-up option.
Clear explanations of what subscribers will receive.
Exclusive useful updates and offers.
Better frequency management.
During the next month:
Starting Opt-In Audience = 8,000
New Opt-Ins = 1,000
Opt-Outs = 200
Net growth is: 1,000 − 200 = 800
Therefore: 800 ÷ 8,000 × 100 = 10%
What Does Good Opt-In Growth Mean for the Company?
The permission-based audience is expanding.
This gives the business a larger pool of people with whom it can communicate appropriately through WhatsApp.
If those contacts are relevant and engaged, the growing audience can create more opportunities for:
Promotions.
Customer education.
Repeat purchases.
Lead nurturing.
Customer retention.
But management should not chase opt-in volume without considering audience quality.
A smaller list of genuinely interested customers can be more valuable than a huge list of people who do not want the messages.
3. Audience Reach
What Is Audience Reach?
Audience Reach measures how many people or unique recipients the business reaches with its WhatsApp communications during a defined period or campaign.
It answers: “How much of our available audience are we actually reaching?”
Suppose a company has 20,000 opted-in contacts.
But a campaign is sent to only 5,000 of them.
The business has a large potential audience, but the particular campaign has reached only a portion of it.
Reach therefore needs context.
A company might track:
Unique recipients reached.
Percentage of opted-in audience reached.
Reach by customer segment.
Reach by campaign.
How Is Audience Reach Calculated?
The simplest measure is a count: Audience Reach = Number of Unique Recipients Reached
A percentage can also be useful: Audience Reach Rate = Unique Recipients Reached ÷ Total Eligible Audience × 100
Suppose:
Eligible Opt-In Audience = 10,000
Unique Recipients Reached = 7,500
Then: Audience Reach Rate = 7,500 ÷ 10,000 × 100 = 75%
Example of Poor Audience Reach
Imagine a security company has: 12,000 eligible opted-in contacts
Its monthly WhatsApp communications reach only: 3,000 unique recipients
Therefore: Audience Reach Rate = 3,000 ÷ 12,000 × 100 = 25%
Assume the business intended to communicate with most of the eligible audience.
In this context, 25% represents poor reach.
What Does Poor Audience Reach Mean for the Company?
Poor reach may mean:
Campaigns are being sent to too small a segment.
Contact data is poorly organised.
Delivery problems exist.
Eligible customers are being excluded unintentionally.
Messaging systems are not being used effectively.
Audience segmentation rules are incorrect.
However, low reach is not automatically bad.
A campaign promoting a commercial security service should perhaps reach only relevant business customers rather than every residential customer in the database.
The objective should be: Reach the right audience rather than Reach everybody.
Example of Good Audience Reach
The security company plans a campaign relevant to almost its entire opted-in customer audience.
Results:
Eligible Audience = 12,000
Unique Recipients Reached = 11,000
Therefore: Audience Reach Rate = 11,000 ÷ 12,000 × 100 = 91.7%
What Does Good Audience Reach Mean for the Company?
The campaign has successfully reached most of the intended audience.
This increases the opportunity for:
Reads.
Clicks.
Replies.
Enquiries.
Conversions.
Management can now move to the next question: What did people do after receiving the message?
That brings us to engagement.
Engagement Metrics
Delivery tells you whether the message arrived.
Reach tells you how much of the audience you reached.
Engagement tells you whether people actually responded to the communication.
4. Open / Read Rate
What Is Open / Read Rate?
Open / Read Rate measures the percentage of delivered messages that are recorded as having been opened or read, where the relevant reporting and privacy settings make this information available.
It helps answer: “Of the messages that were delivered, how many were actually read?”
For WhatsApp, Read Rate is generally a more useful term than the traditional email concept of Open Rate, but businesses may encounter both terms in marketing reporting.
How Is Open / Read Rate Calculated?
A practical formula is: Read Rate = Read Messages ÷ Delivered Messages × 100
Suppose:
Delivered Messages = 5,000
Read Messages = 4,000
Then: Read Rate = 4,000 ÷ 5,000 × 100 = 80%
This means 80% of the delivered messages were recorded as read.
Businesses should remember that privacy choices and technical reporting conditions may affect read-status data.
Example of Poor Open / Read Rate
Imagine an accounting practice sends: Delivered Messages = 4,000
Only: 1,600 are recorded as read
Therefore: 1,600 ÷ 4,000 × 100 = 40%
Assume comparable messages normally record substantially higher read rates.
The result deserves investigation.
What Does Poor Open / Read Rate Mean for the Company?
Possible reasons include:
Customers are no longer interested.
Messages are being sent too frequently.
The opening message is unclear.
Timing is poor.
The audience is badly targeted.
Customers recognise the messages as repetitive promotions.
Subscriber quality has deteriorated.
A poor read rate means the business has successfully delivered messages that are still failing to capture attention.
Example of Good Open / Read Rate
The accounting practice segments its audience and sends a short, relevant message about an upcoming tax deadline to small-business clients.
Results:
Delivered = 4,000
Recorded as Read = 3,600
Therefore: 3,600 ÷ 4,000 × 100 = 90%
What Does Good Open / Read Rate Mean for the Company?
The message appears to have attracted strong attention from the intended audience.
But reading is still not the final objective.
Management should next ask: Did customers take action?
5. Click-Through Rate (CTR)
What Is WhatsApp Click-Through Rate?
WhatsApp Click-Through Rate measures the percentage of messages or recipients that generate clicks on tracked links.
A WhatsApp marketing message might contain a link to:
A product.
A booking page.
A quotation form.
A website article.
An online store.
A special offer.
A registration page.
CTR helps determine whether recipients are interested enough to leave WhatsApp and take the next step.
How Is CTR Calculated?
A useful formula is: CTR = Unique Link Clickers ÷ Delivered Messages × 100
Suppose:
Delivered Messages = 5,000
Unique Link Clickers = 500
Then: CTR = 500 ÷ 5,000 × 100 = 10%
The business should document the exact denominator and click definition it uses because reporting systems can differ.
Example of Poor CTR
Imagine a solar company sends: Delivered Messages = 8,000
The message contains a link to request a solar assessment.
Only: 160 recipients click
Therefore: CTR = 160 ÷ 8,000 × 100 = 2%
Assume similar campaigns historically achieve around 8%.
What Does Poor CTR Mean for the Company?
The message may be delivered and read but still fail to generate action.
Possible causes include:
Weak offer.
Unclear call-to-action.
Irrelevant audience.
Poor message copy.
Lack of urgency.
Lack of trust.
Link is difficult to identify.
Customers do not understand what happens after clicking.
Management should compare CTR with Read Rate.
For example: High Read Rate + Low CTR
suggests the message attracts attention but fails to persuade people to take the next step.
Example of Good CTR
The solar company improves the message.
Instead of a vague: “Visit our website for more information.”
it uses a clearer action: “See what a solar system for your property could cost. Request a free assessment.”
The campaign records:
Delivered = 8,000
Unique Clickers = 960
Therefore: CTR = 960 ÷ 8,000 × 100 = 12%
What Does Good CTR Mean for the Company?
The campaign is now generating six times as many clickers: 160 → 960
This suggests the message, audience, and offer are better aligned.
Management should now measure what happens after the click.
6. Reply Rate
What Is Reply Rate?
Reply Rate measures the percentage of recipients who respond directly to a WhatsApp message.
This is particularly useful because WhatsApp is a conversational channel.
A reply may indicate:
Interest.
A question.
A quotation request.
A booking request.
A complaint.
A request for more information.
A customer service need.
A purchase intention.
Reply Rate helps answer: “Is our communication generating conversation?”
How Is Reply Rate Calculated?
A useful formula is: Reply Rate = Unique Recipients Who Reply ÷ Delivered Messages × 100
Suppose:
Delivered Messages = 2,000
Unique Recipients Who Reply = 200
Then: Reply Rate = 200 ÷ 2,000 × 100 = 10%
Example of Poor Reply Rate
Imagine a commercial cleaning company sends 3,000 delivered messages offering office cleaning assessments.
Only 30 recipients reply: Reply Rate = 30 ÷ 3,000 × 100 = 1%
Assume similar campaigns historically generate around 7%.
What Does Poor Reply Rate Mean for the Company?
Possible causes include:
Message does not invite a reply.
Offer is irrelevant.
Audience is poorly targeted.
Communication feels automated or impersonal.
Customers are unsure what to do.
The message is too complicated.
The business is contacting people too frequently.
Management should also inspect the content of replies.
Thirty genuine quotation requests may be commercially valuable even if the percentage appears low.
Example of Good Reply Rate
The cleaning company sends a more targeted message: “Would you like us to prepare a no-obligation cleaning assessment for your office? Reply YES and we will contact you.”
Results:
Delivered Messages = 3,000
Replies = 360
Therefore: Reply Rate = 360 ÷ 3,000 × 100 = 12%
What Does Good Reply Rate Mean for the Company?
The campaign is creating substantially more direct conversation.
The business now needs an effective process for:
Responding quickly.
Qualifying leads.
Preparing quotations.
Following up.
Recording outcomes.
Generating replies without managing them effectively can waste valuable opportunities.
Conversion and Health Metrics
The final group examines two different questions.
First: Are WhatsApp interactions creating business results?
Second: Is the company maintaining a healthy relationship with its audience and the messaging platform?
7. Conversion Rate
What Is Conversion Rate?
Conversion Rate measures the percentage of WhatsApp recipients, interactions, or visitors who complete the desired business action.
A conversion might be:
Purchase.
Booking.
Quotation request.
Consultation.
Registration.
Appointment.
Lead submission.
Subscription.
The business must define the conversion clearly.
How Is Conversion Rate Calculated?
One useful campaign formula is: Conversion Rate = Conversions ÷ Delivered Messages × 100
Suppose:
Delivered Messages = 5,000
Purchases = 250
Then: Conversion Rate = 250 ÷ 5,000 × 100 = 5%
Alternatively, a business may measure conversion from clicks: Post-Click Conversion Rate = Conversions ÷ WhatsApp Clickers × 100
If 500 people clicked and 250 purchased: 250 ÷ 500 × 100 = 50%
Both metrics are useful, but they answer different questions.
Example of Poor Conversion Rate
Imagine a vehicle workshop sends a service promotion.
Results:
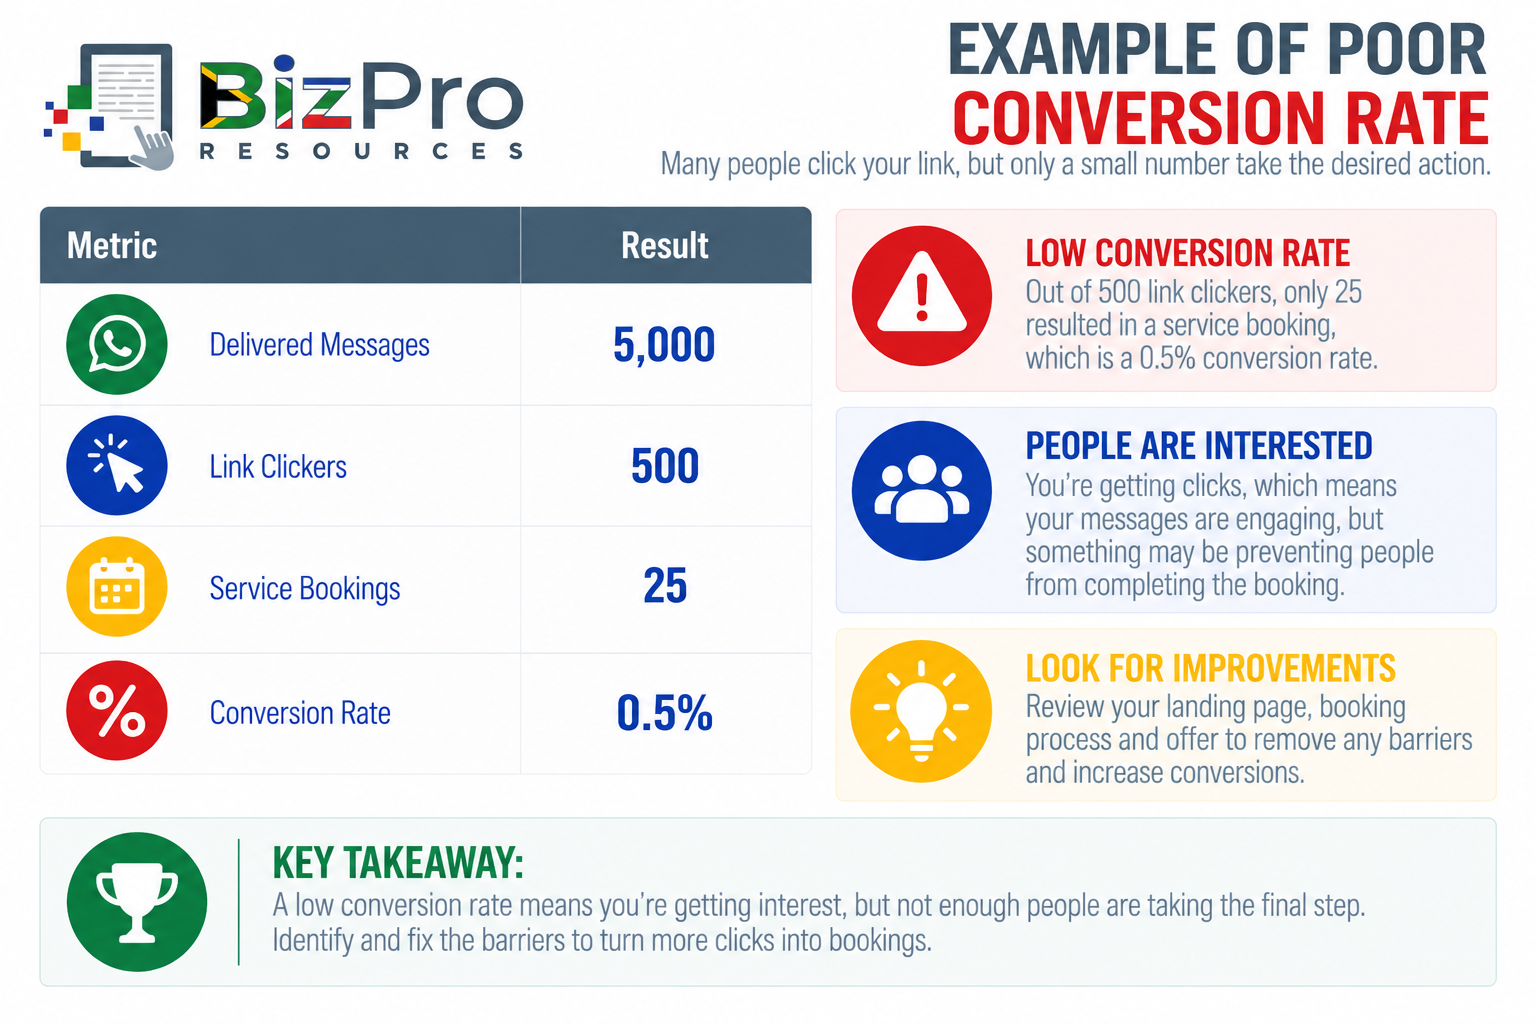
Campaign conversion rate: 25 ÷ 5,000 × 100 = 0.5%
Post-click conversion rate: 25 ÷ 500 × 100 = 5%
What Does Poor Conversion Rate Mean for the Company?
The campaign generates interest but very few final bookings.
Possible problems include:
Offer is not strong enough.
Booking process is difficult.
Landing page performs poorly.
Price discourages customers.
Available booking times are unsuitable.
Customers do not trust the offer.
Campaign attracts curiosity rather than genuine buying intent.
The funnel helps management locate the problem:
5,000 Delivered → 500 Clicks → 25 Bookings
Clicks are being generated.
The major loss occurs after the click.
That tells management where to investigate.
Example of Good Conversion Rate
The workshop simplifies its booking process and improves the offer.
The next campaign produces:
Delivered Messages = 5,000
Link Clickers = 750
Bookings = 300
Campaign conversion rate: 300 ÷ 5,000 × 100 = 6%
Post-click conversion rate: 300 ÷ 750 × 100 = 40%
What Does Good Conversion Rate Mean for the Company?
WhatsApp activity is now producing meaningful business outcomes.
The business has moved beyond measuring: Messages and Clicks to measuring Bookings.
That is a much stronger indication of marketing effectiveness.
8. Opt-Out / Block Rate
What Is Opt-Out / Block Rate?
Opt-Out / Block Rate measures the proportion of recipients who indicate that they no longer want communications or who block the business.
These are important audience health metrics.
Opt-outs and blocks can indicate that customers perceive messages as:
Too frequent.
Irrelevant.
Unwanted.
Repetitive.
Poorly targeted.
Misleading.
Intrusive.
A small number of opt-outs is normal. Not every customer will remain interested forever.
The warning sign is a sudden or sustained increase.
How Is Opt-Out / Block Rate Calculated?
These metrics can be tracked separately.
Opt-Out Rate
Opt-Out Rate = Opt-Outs ÷ Delivered Messages × 100
Block Rate
Where reliable block information is available: Block Rate = Blocks ÷ Delivered Messages × 100
A business may also use a combined internal audience-health measure where appropriate: Combined Opt-Out / Block Rate = Opt-Outs and Recorded Blocks ÷ Delivered Messages × 100
Suppose:
Delivered Messages = 10,000
Opt-Outs = 150
Recorded Blocks = 50
Combined: 200 ÷ 10,000 × 100 = 2%
For management purposes, it is generally better to keep opt-outs and blocks visible separately as well.
Example of Poor Opt-Out / Block Performance
Imagine a retailer sends 10,000 delivered promotional messages.
After the campaign:
Opt-Outs = 600
Recorded Blocks = 200
Combined negative actions: 800
Therefore: 800 ÷ 10,000 × 100 = 8%
Assume the business normally experiences substantially lower negative feedback.
This represents a serious warning sign.
What Does Poor Opt-Out / Block Performance Mean for the Company?
The campaign may be damaging the relationship with its audience.
Possible causes include:
Excessive messaging.
Poor targeting.
Irrelevant offers.
Customers did not knowingly expect marketing messages.
Repetitive promotions.
Misleading content.
Poor frequency management.
This demonstrates why high reach is not always positive.
A company could increase:
Messages Sent ↑
Reach ↑
while simultaneously causing:
Opt-Outs ↑
Blocks ↑
Audience Quality ↓
More communication is not automatically better communication.
Example of Good Opt-Out / Block Performance
The retailer improves:
Audience segmentation.
Message relevance.
Frequency.
Opt-in communication.
Content quality.
Its next campaign records:
Delivered Messages = 10,000
Opt-Outs = 50
Recorded Blocks = 10
Combined negative actions: 60
Therefore: 60 ÷ 10,000 × 100 = 0.6%
What Does Good Opt-Out / Block Performance Mean for the Company?
The campaign is generating relatively little negative audience reaction compared with the earlier campaign.
This suggests that the business is communicating more appropriately with the audience.
But management should continue monitoring trends.
A gradual increase in opt-outs or blocks can provide an early warning that customers are becoming tired of the messaging strategy.
9. Template Quality Ranking
What Is Template Quality Ranking?
Businesses using the WhatsApp Business Platform may use approved message templates for certain business-initiated communications.
Meta provides quality information relating to message templates based on customer feedback and other signals.
A Template Quality Ranking or quality status helps businesses understand whether recipients appear to be responding positively or negatively to a particular template.
Unlike a simple percentage such as CTR, Template Quality Ranking is generally a platform-provided quality indicator, rather than a metric that the business calculates manually.
Depending on the current platform implementation, businesses may encounter quality indicators or statuses that help distinguish stronger templates from templates receiving problematic feedback.
Because WhatsApp Business Platform features and terminology can change, businesses should use the current information shown in their WhatsApp management environment as the authoritative status for their templates.
How Is Template Quality Ranking Calculated?
The business does not normally calculate the ranking itself.
Instead: Template Quality Ranking = Quality Indicator Assigned by the WhatsApp Business Platform
The platform considers customer feedback and relevant quality signals.
Management should record and monitor the status of important marketing templates over time.
For example:
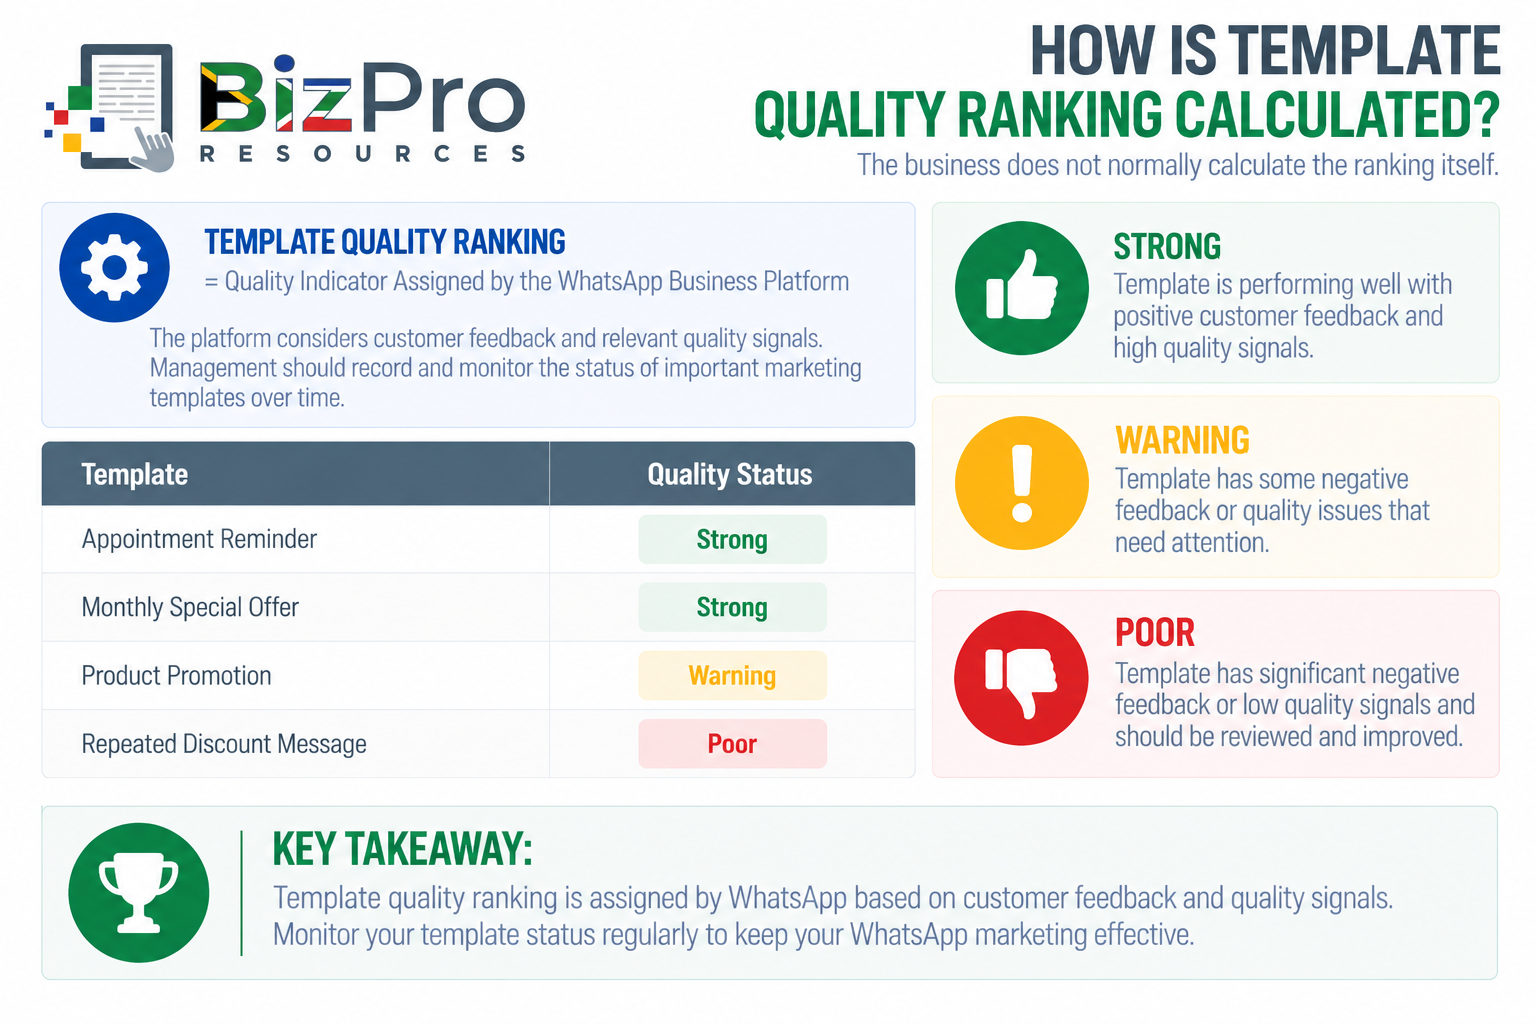
The exact labels displayed by the platform should be used rather than replacing them with internally invented terminology.
Example of Poor Template Quality Ranking
Imagine a retailer repeatedly sends a promotional template.
The message is sent frequently and contains aggressive sales language.
Over time, the platform indicates deteriorating quality for the template.
At the same time, management notices:
Blocks increasing.
Opt-outs increasing.
Reply Rate falling.
CTR falling.
What Does Poor Template Quality Ranking Mean for the Company?
A deteriorating quality indicator can signal that recipients are responding negatively to the template.
Management should investigate:
Message relevance.
Frequency.
Audience targeting.
Customer feedback.
Opt-in quality.
Message wording.
Whether the template delivers genuine value.
Poor quality should not simply be treated as a technical WhatsApp problem.
It may be evidence of a marketing strategy problem.
The business could be communicating too often, to the wrong people, with the wrong message.
Example of Good Template Quality Ranking
The retailer changes its approach.
Instead of sending the same promotion repeatedly, it:
Improves segmentation.
Reduces unnecessary messaging.
Makes offers more relevant.
Uses clearer language.
Sends messages only to appropriate opted-in audiences.
Monitors negative feedback.
The important templates maintain healthy quality indicators while:
CTR improves.
Reply Rate improves.
Conversions improve.
Opt-outs decline.
What Does Good Template Quality Ranking Mean for the Company?
Healthy template quality suggests the business is maintaining stronger messaging quality from the platform's perspective and is avoiding excessive negative recipient feedback.
This supports a healthier WhatsApp marketing programme.
But quality ranking should never be viewed alone.
Management should connect it with:
Delivery.
Engagement.
Conversions.
Opt-outs.
Blocks.
How All Nine WhatsApp Business Marketing Metrics Work Together
The metrics become most useful when viewed as one marketing journey.
Consider this example:
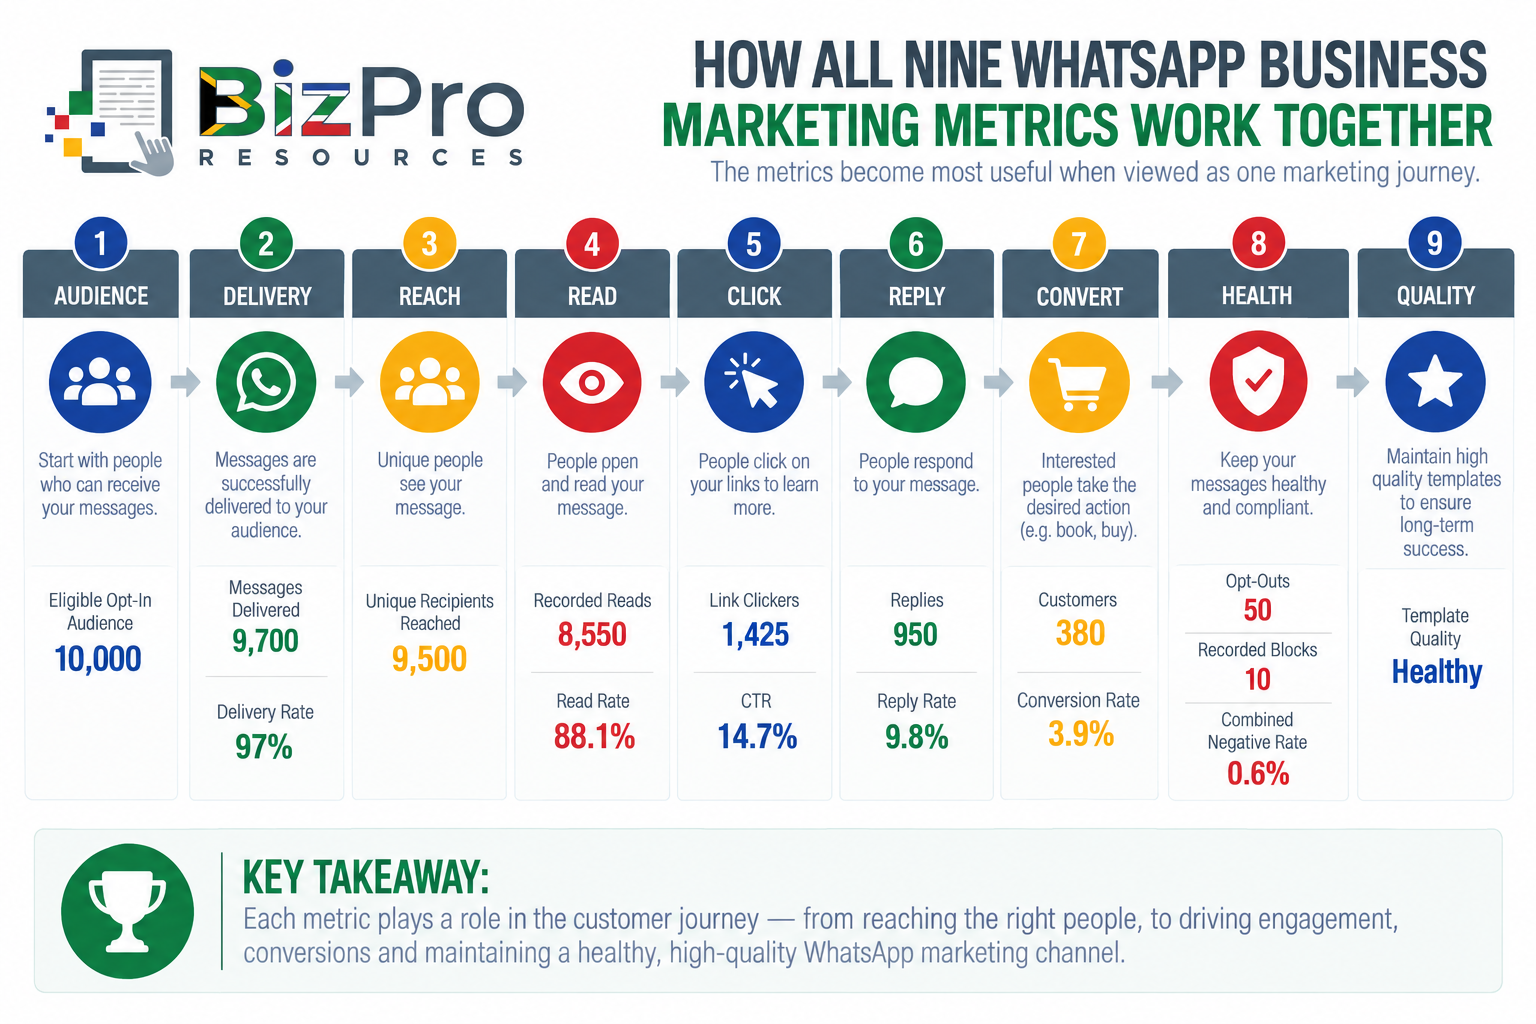
Now management can see the complete story.
The company has:
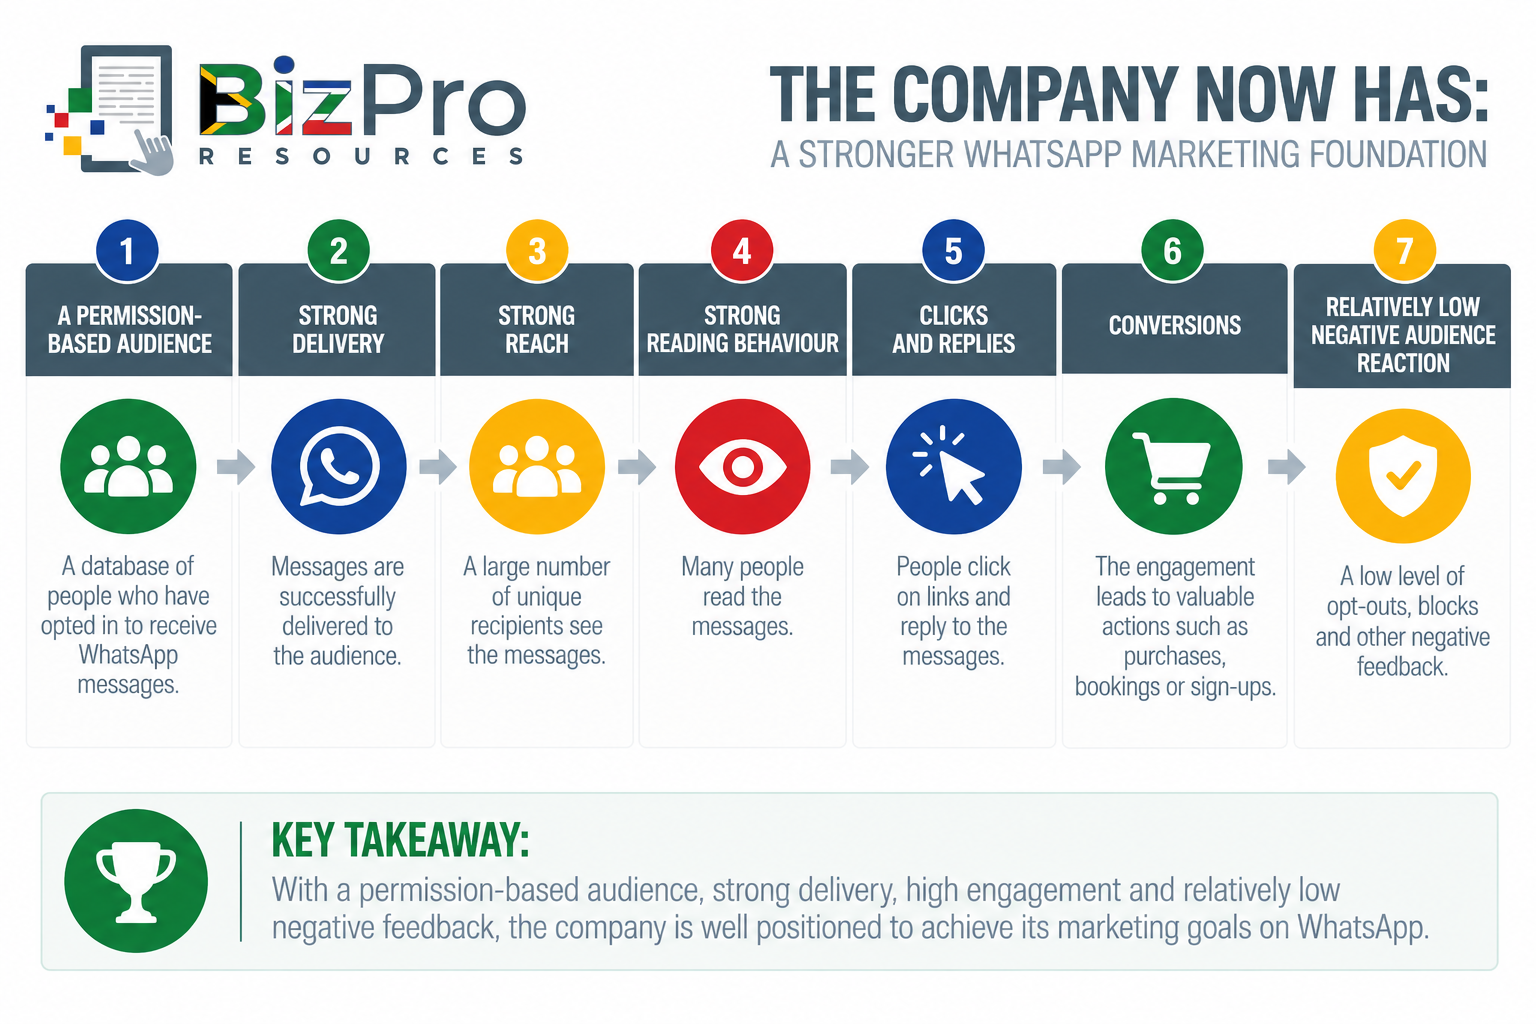
This is far more useful than saying: “We sent 10,000 WhatsApps.”
Build a Simple WhatsApp Business Marketing Dashboard
A small business can create a monthly dashboard such as:
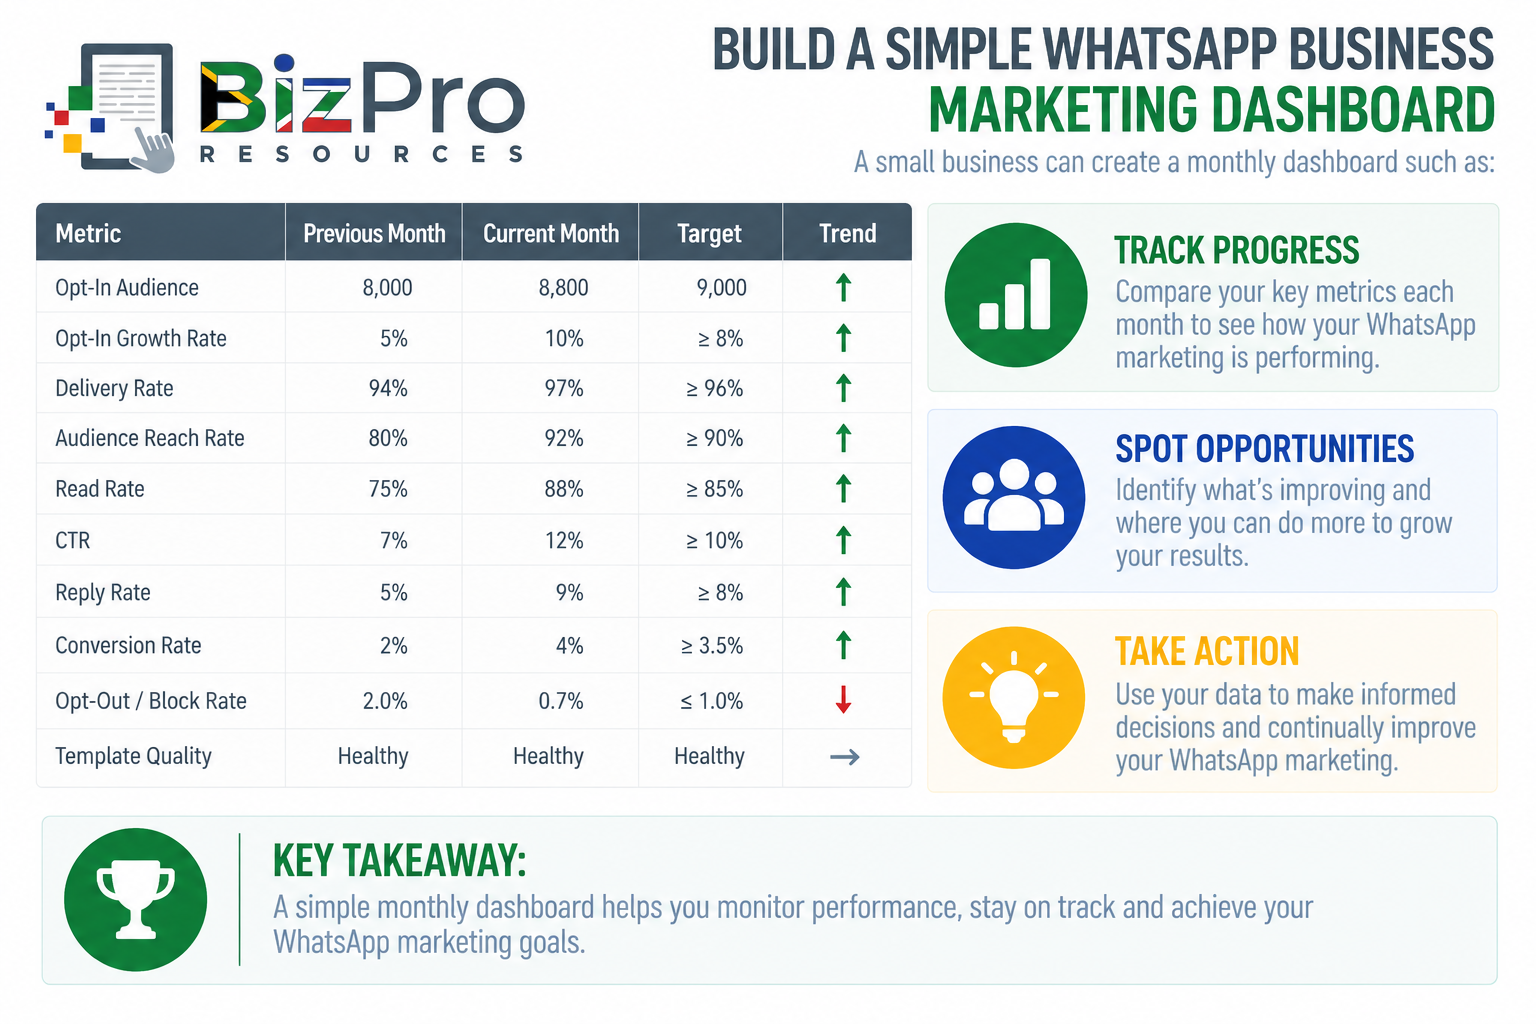
This gives management a concise picture of the entire WhatsApp marketing channel.
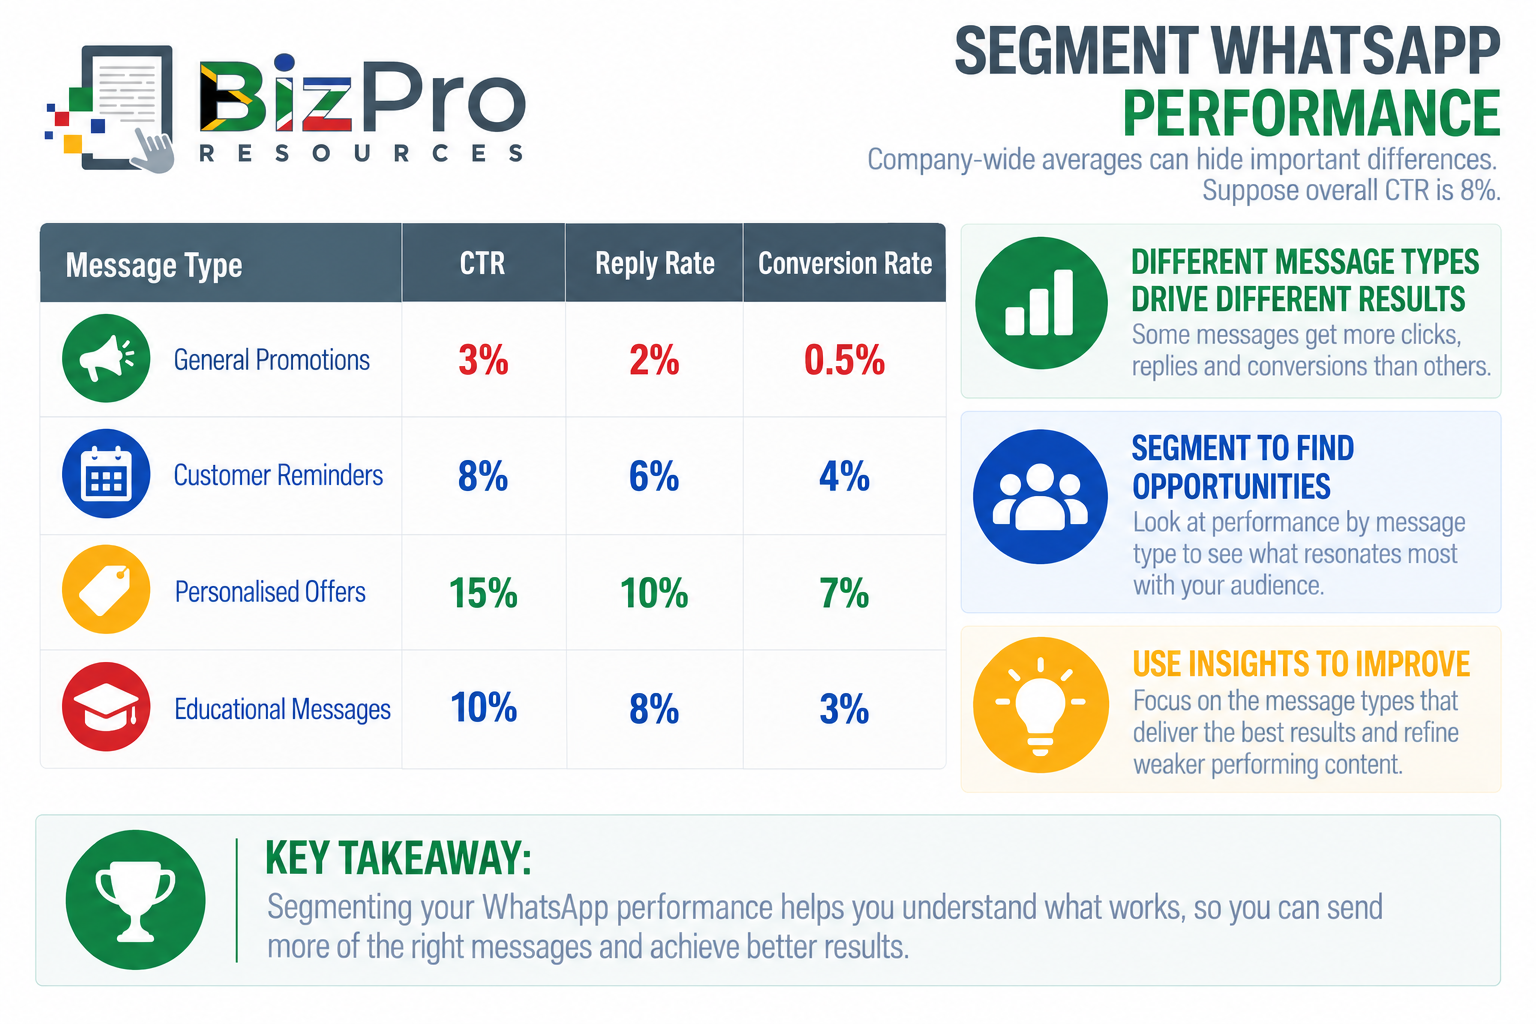
Segment WhatsApp Performance
Company-wide averages can hide important differences.
Suppose overall CTR is 8%.
When segmented by message type:
This provides useful insight.
The company's general promotional messages appear to perform poorly.
Personalised offers perform much better.
Management can now adjust the strategy based on evidence rather than assumptions.
Useful segmentation might include:
Customer type.
Existing customer versus lead.
Product.
Service.
Location.
Campaign.
Message template.
Customer value.
Previous purchase.
Engagement level.
Do Not Turn WhatsApp into a Spam Channel
WhatsApp feels personal.
That is part of its marketing strength.
It is also why businesses need to use the channel carefully.
Customers may tolerate a large number of promotional emails sitting unread in an inbox.
Repeated unwanted WhatsApp messages can feel much more intrusive.
A business should therefore resist the temptation to think: “If one message works, five messages will work five times better.”
The opposite may happen.
Message volume can increase while:
Read Rate ↓
CTR ↓
Reply Rate ↓
Opt-Outs ↑
Blocks ↑
Template Quality ↓
The objective is not maximum messaging frequency.
The objective is relevant communication that customers are willing to receive.
Connect WhatsApp Metrics to Financial Results
Ultimately, marketing needs to support business performance.
Suppose a campaign produces:
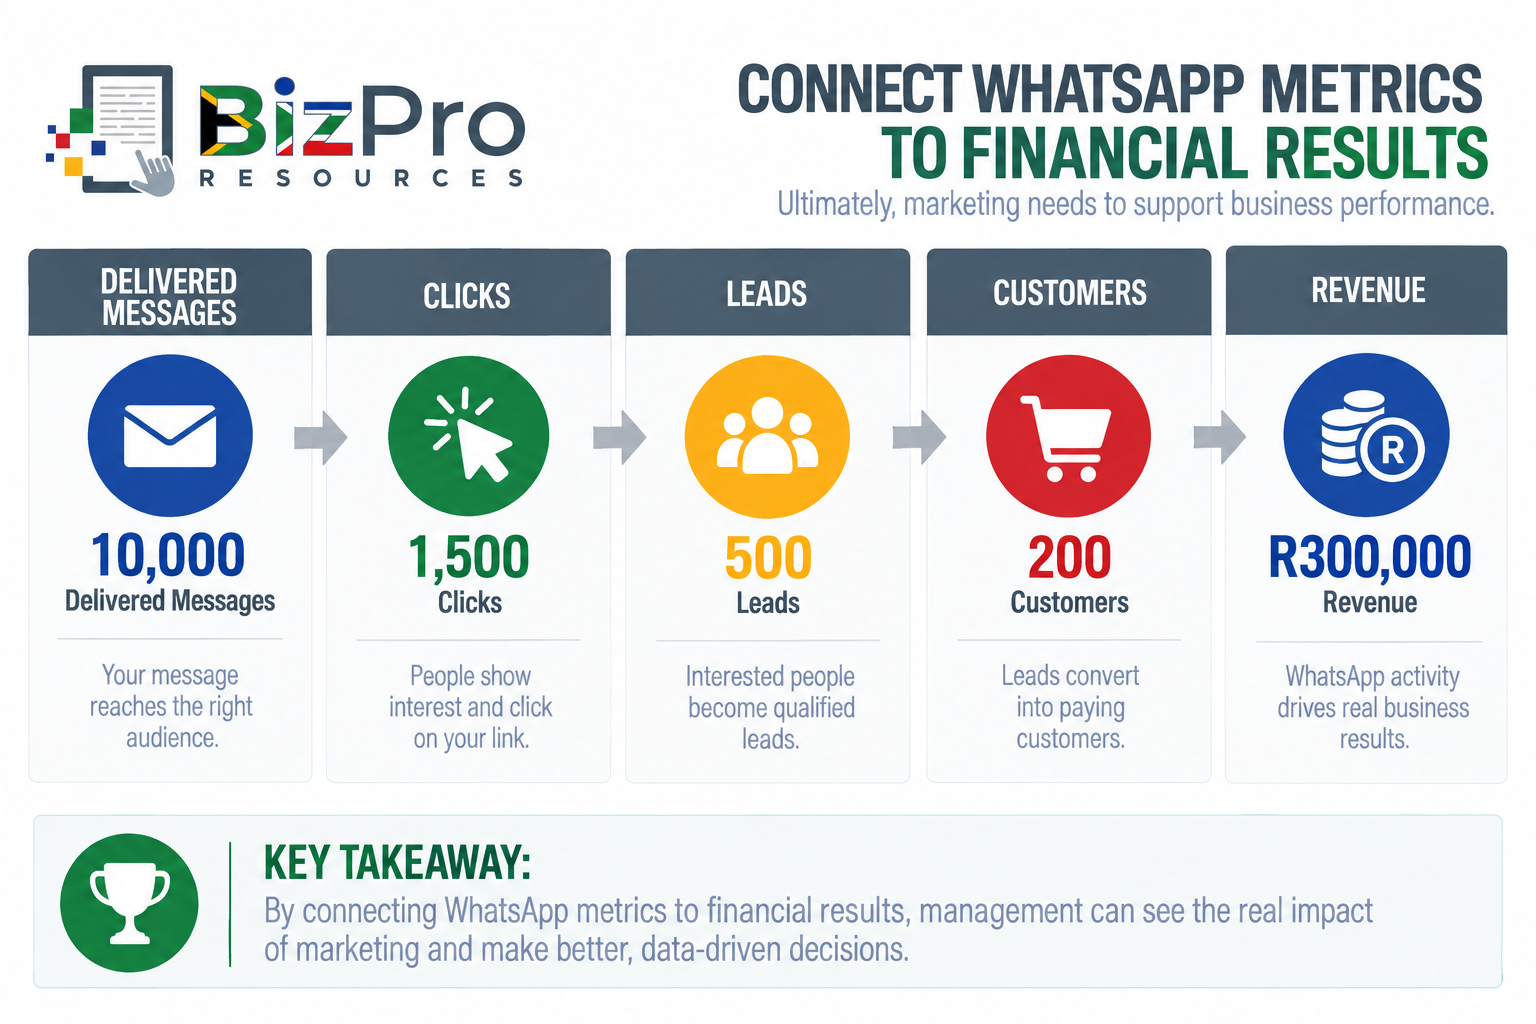
Now management can connect WhatsApp activity with the financial metrics discussed earlier in this Marketing Metrics series.
For example:
Revenue generated.
Customer Acquisition Cost.
Return on Investment.
Customer Lifetime Value.
Marketing profitability.
This allows management to move from: “Our Read Rate is 90%.”
to: “Our WhatsApp campaign generated 200 customers and R300,000 in revenue.”
The second statement is far more commercially meaningful.
What Does Good WhatsApp Business Marketing Performance Look Like?
There is no universal percentage that every business should target for every WhatsApp metric.
Performance depends on:
Industry.
Customer relationship.
Message type.
Audience.
Offer.
Frequency.
Campaign objective.
Customer intent.
Messaging setup.
Businesses should therefore build their own historical baselines.
Healthy performance generally means:
Delivery Rate is strong: Messages successfully reach the intended audience.
Opt-In Growth Rate is positive: The permission-based audience is growing sustainably.
Audience Reach is appropriate: The right people are being reached.
Read Rate is healthy: Recipients continue paying attention to messages.
CTR is healthy: Messages encourage useful further action.
Reply Rate is healthy: Customers engage in meaningful conversation.
Conversion Rate is improving: WhatsApp activity creates real business outcomes.
Opt-Out / Block Rate remains controlled: Customers are not showing excessive negative reaction.
Template Quality remains healthy: Important templates do not show signs of deteriorating customer feedback.
Most importantly: WhatsApp contributes to customer relationships, leads, sales, and business value without damaging audience trust.
Turning WhatsApp Business Metrics into Action
If Delivery Rate is poor, investigate:
Contact data.
Invalid numbers.
Messaging setup.
Delivery failures.
If Opt-In Growth Rate is poor, investigate:
Sign-up opportunities.
Value offered to subscribers.
Opt-out behaviour.
Customer awareness.
If Audience Reach is poor, investigate:
Segmentation.
Eligible audience size.
Delivery.
Campaign setup.
If Read Rate is poor, investigate:
Relevance.
Frequency.
Timing.
Audience quality.
If CTR is poor, investigate:
Offer.
Message copy.
Calls-to-action.
Audience targeting.
If Reply Rate is poor, investigate:
Whether the message encourages conversation.
Relevance.
Personalisation.
Clarity.
If Conversion Rate is poor, investigate:
Offer.
Sales process.
Landing page.
Booking process.
Follow-up.
If Opt-Out / Block Rate is high, investigate:
Frequency.
Consent quality.
Targeting.
Message relevance.
Customer expectations.
If Template Quality Ranking deteriorates, investigate:
Customer feedback.
Template content.
Audience selection.
Frequency.
Messaging practices.
Then:
Measure → Investigate → Act → Measure Again
WhatsApp marketing should become a continuous process of improvement rather than simply a broadcast tool.
Final Thoughts
WhatsApp Business can give small businesses a powerful communication channel.
But its strength comes with responsibility.
The objective should not be to collect as many telephone numbers as possible and send as many messages as possible.
The objective is to build a permission-based audience and communicate with that audience in ways that are relevant, useful, measurable, and commercially valuable:
Delivery Rate tells you whether messages successfully reach recipients.
Opt-In Growth Rate tells you whether your permission-based audience is growing.
Audience Reach tells you how much of the intended audience you are reaching.
Open / Read Rate tells you whether delivered messages are attracting attention.
Click-Through Rate tells you whether recipients take the next step by clicking.
Reply Rate tells you whether messages generate direct conversation.
Conversion Rate tells you whether WhatsApp activity creates the desired business outcome.
Opt-Out / Block Rate warns when customers may be rejecting the communication.
Template Quality Ranking helps monitor the health of business-initiated message templates.
Together, these nine metrics turn WhatsApp from a simple messaging channel into a measurable marketing system.
The most important question is therefore not: “How many WhatsApps did we send?”
It is: “Did we reach the right people, earn their attention, encourage meaningful action, generate business value, and maintain their trust?”
When a business can answer that question with reliable data, WhatsApp marketing becomes much easier to manage and improve.
Related Articles in the Marketing Performance Metrics Series
Marketing Financial Metrics: ROI, CAC, CLV, and ROAS Explained
Marketing Conversion and Lead Metrics: CVR, CPL, and MQL Explained
Marketing Traffic and Engagement Metrics: CTR, Bounce Rate, and Engagement Rate Explained
Social Media Metrics: Followers, Comments, Engagement Rate, and Video Views Explained
SEO Metrics: Page Views, CTR, Domain AUthority, Organic Traffic, and Keyword Rankings Explained
Email Marketing Metrics: CTOR, Engagement, Website Traffic, Bounce Rate, and CTR Explained
AI Disclaimer
AI Tools were used to assist with research. Remember to always cross-check everything that you read.


