

Email Marketing Metrics: CTOR, Engagement, Website Traffic, Bounce Rate, and CTR Explained
Article #6 of #7 in the Marketing Performance Metrics Series
Introduction
Email marketing remains one of the most useful digital marketing channels available to small businesses.
Unlike social media, where an algorithm can determine whether followers see a post, email gives a business a more direct way to communicate with people who have joined its mailing list.
A business can use email marketing to:
Promote products and services.
Announce special offers.
Share useful information.
Follow up with potential customers.
Educate existing customers.
Encourage repeat purchases.
Promote events.
Drive traffic to its website.
Build longer-term customer relationships.
But sending emails is not the same as achieving results.
A company could send 20,000 emails every month and still generate very little business value.
The important questions are:
Are the emails reaching subscribers?
Are people engaging with them?
Are they clicking the links?
Are email campaigns driving useful website traffic?
Are email addresses valid and deliverable?
Five useful metrics can help answer these questions:
Click-to-Open Rate (CTOR)
Email Marketing Engagement Score
Email Website Traffic Metrics
Email Bounce Rate
Email Click-Through Rate
Together, these metrics provide a much clearer picture of email marketing performance than simply counting how many emails were sent.
1. Click-to-Open Rate (CTOR)
What Is Click-to-Open Rate?
Click-to-Open Rate, commonly abbreviated as CTOR, measures the percentage of people who clicked a link in an email relative to the number of recipients who opened the email.
In simple terms, it asks: “Of the people who opened the email, how many were interested enough to click?”
This distinction is important.
Getting someone to open an email is one challenge. Getting them to take action after opening it is another.
Suppose an email has an excellent subject line. Thousands of subscribers open it. But the email itself is confusing, irrelevant, or uninteresting. Very few people click.
The open performance may look good, while the actual email content performs poorly.
CTOR can help identify this problem.
How Is CTOR Calculated?
A common formula is: CTOR = Unique Email Clickers ÷ Unique Email Openers × 100
Suppose a campaign records:
Unique Openers = 2,000
Unique Clickers = 300
The calculation is: CTOR = 300 ÷ 2,000 × 100 = 15%
This means 15% of the recorded recipients who opened the email also clicked at least one tracked link.
Businesses should use consistent definitions because email platforms may report opens and clicks differently.
A Note About Email Open Tracking
Open data needs to be treated carefully.
Email platforms commonly detect opens using tracking technology, but privacy features, image blocking, automated systems, and other technical factors can affect the accuracy of open reporting.
For this reason, CTOR should not be treated as a perfectly precise measure of human behaviour.
It remains useful as a directional metric, particularly when a business uses the same email platform and compares similar campaigns over time.
Clicks generally provide a stronger indication of deliberate action than opens alone.
Example of Poor CTOR
Imagine a South African accounting practice sends an email titled: “Important Tax Update for Small Business Owners”
The results are:
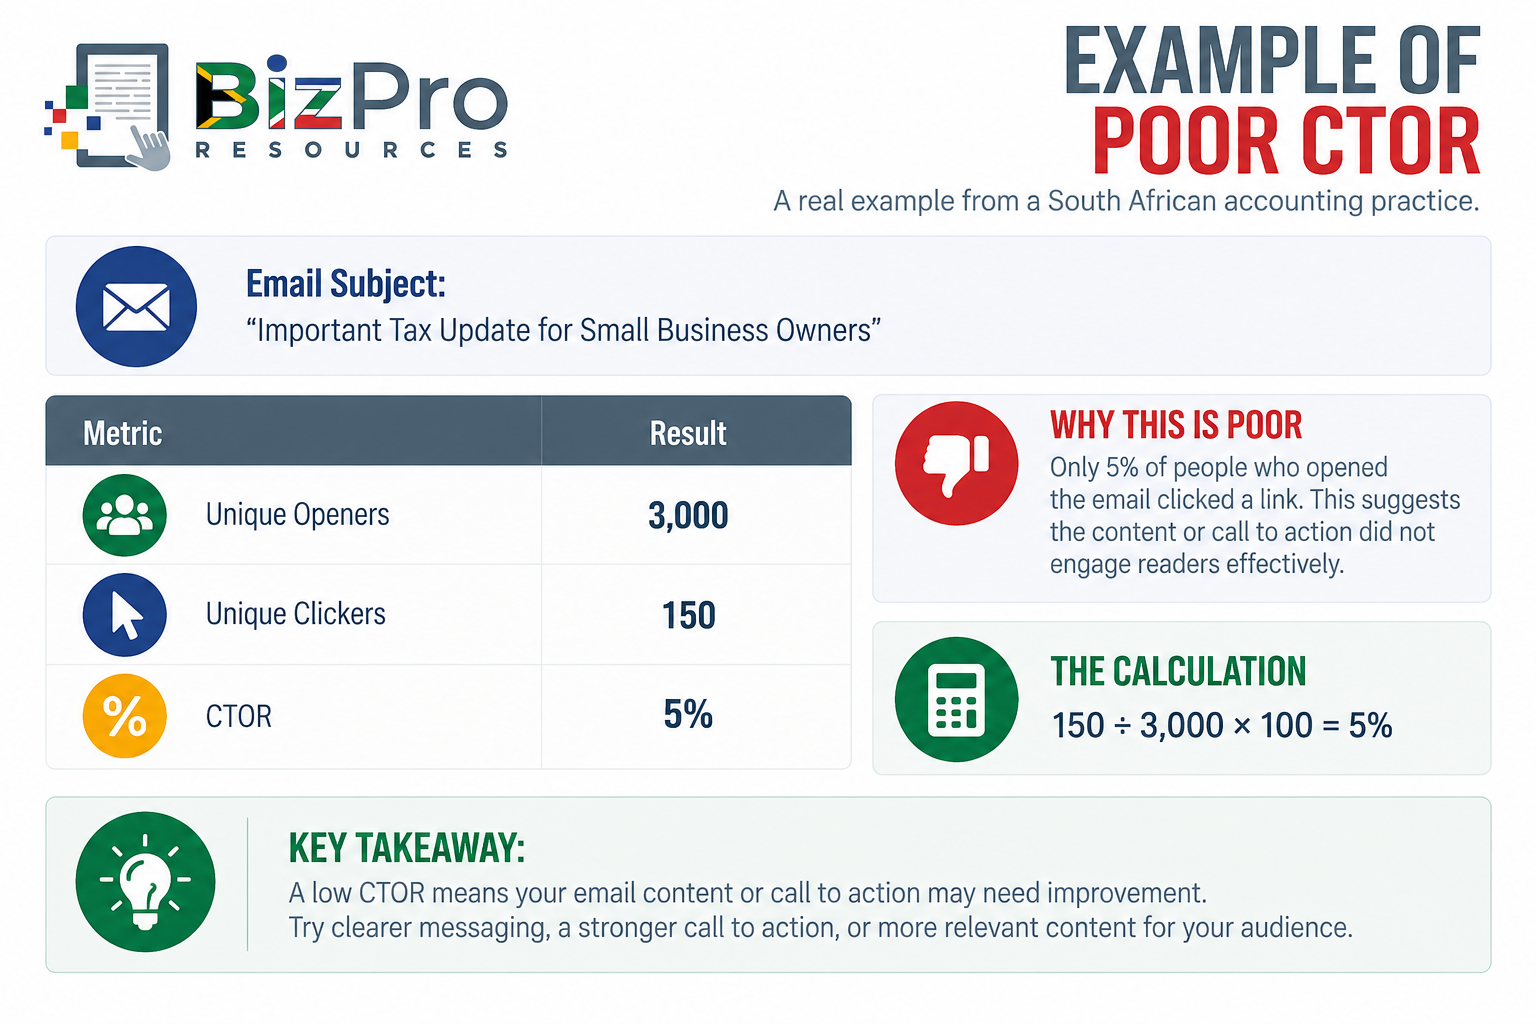
Assume similar educational emails from the practice normally achieve a CTOR of around 15%.
The 5% result is therefore poor relative to its normal performance.
What Does Poor CTOR Mean for the Company?
A poor CTOR suggests that people opened the email but relatively few were persuaded to click.
Possible causes include:
The content did not match the subject line.
The email was too long.
The offer was weak.
The call-to-action was difficult to find.
The email contained too many competing links.
The content was not relevant.
The email design was confusing.
The landing page offer was not clearly explained.
Subscribers had no strong reason to continue to the website.
This distinction can help management identify where the problem occurs.
If very few people open the email, management might investigate the:
Subject line.
Sender name.
Timing.
Audience.
If people open but do not click, management should pay more attention to the content inside the email.
Example of Good CTOR
The accounting practice changes its approach.
It makes the email shorter, explains the tax issue clearly, and includes one prominent call-to-action: “Download the Small Business Tax Checklist”
The next campaign records:
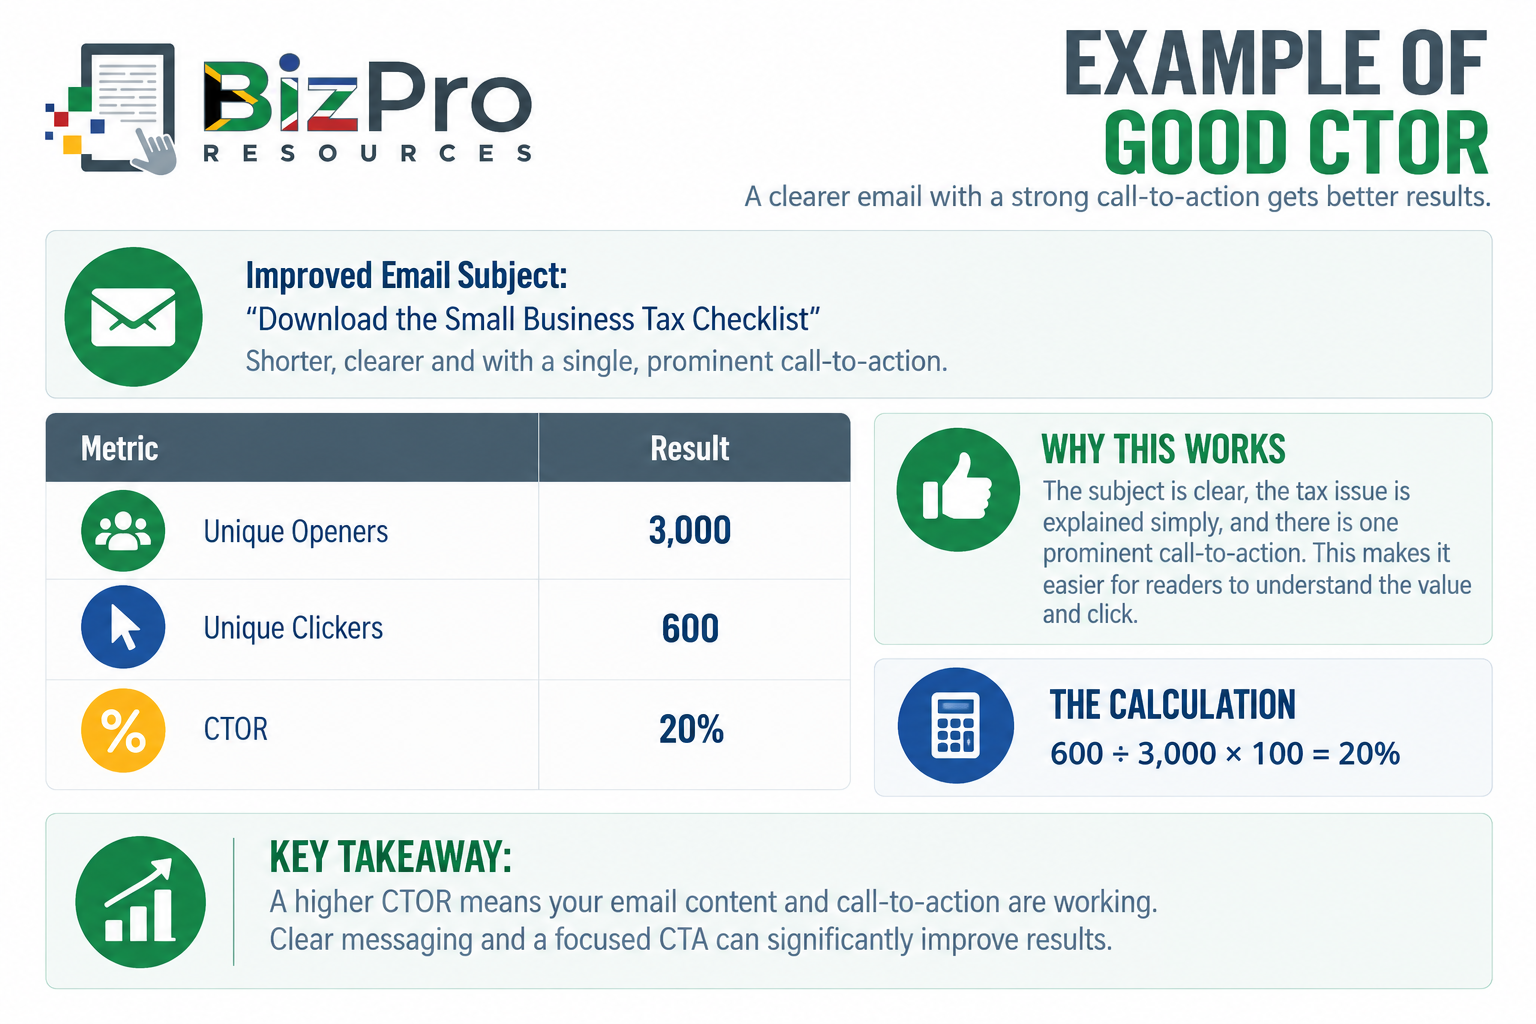
The calculation is: 600 ÷ 3,000 × 100 = 20%
What Does Good CTOR Mean for the Company?
The email is now generating significantly more action from the people who opened it.
Previously: 3,000 openers → 150 clickers
Now: 3,000 openers → 600 clickers
This suggests that the content, offer, and call-to-action are more effective. But those clicks still need to produce useful outcomes.
Management should continue tracking what happens after the click.
2. Email Marketing Engagement Score
What Is an Email Marketing Engagement Score?
An Email Marketing Engagement Score is a combined internal measure used to assess how actively individual subscribers or groups of subscribers engage with email marketing.
Unlike metrics such as CTR, there is no single universal formula that every business uses.
A business or email marketing platform may create an engagement score using activities such as:
Recent email clicks.
Frequency of clicks.
Recorded opens.
Website visits.
Purchases.
Form submissions.
Replies.
Downloads.
Time since the last interaction.
Unsubscribes or inactivity.
The objective is to distinguish between subscribers who are highly engaged and those who rarely interact.
For example, a mailing list of 20,000 people could include:
Highly Engaged Subscribers: Frequently click, visit the website, and buy.
Moderately Engaged Subscribers: Occasionally interact.
Low-Engagement Subscribers: Rarely click or visit.
Inactive Subscribers: Have shown no meaningful activity for an extended period.
This gives management a much more useful picture than simply saying: “We have 20,000 email subscribers.”
How Is Email Marketing Engagement Score Calculated?
Because there is no universal formula, the business needs to define its own scoring model or use the scoring methodology provided by its email platform.
A simple internal example could be:
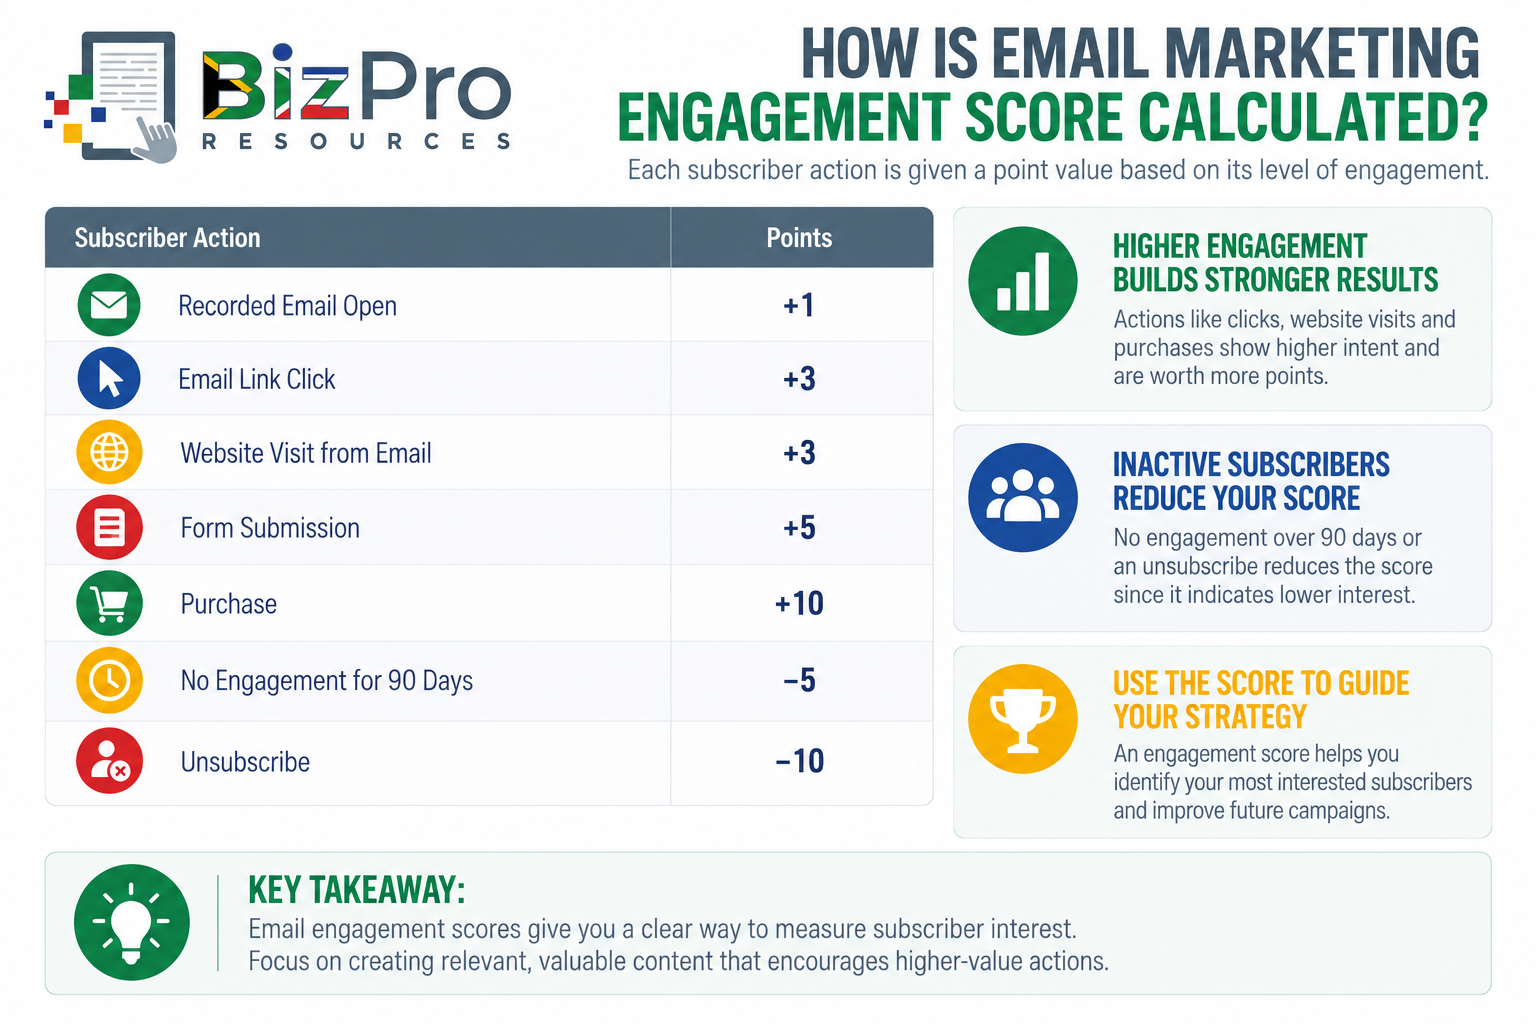
Suppose a subscriber during the measurement period:
Records three opens.
Clicks two links.
Visits the website twice.
Makes one purchase.
The score could be:
3 Opens × 1 = 3
2 Clicks × 3 = 6
2 Website Visits × 3 = 6
1 Purchase × 10 = 10
Total Engagement Score = 25
The business could then create categories such as:
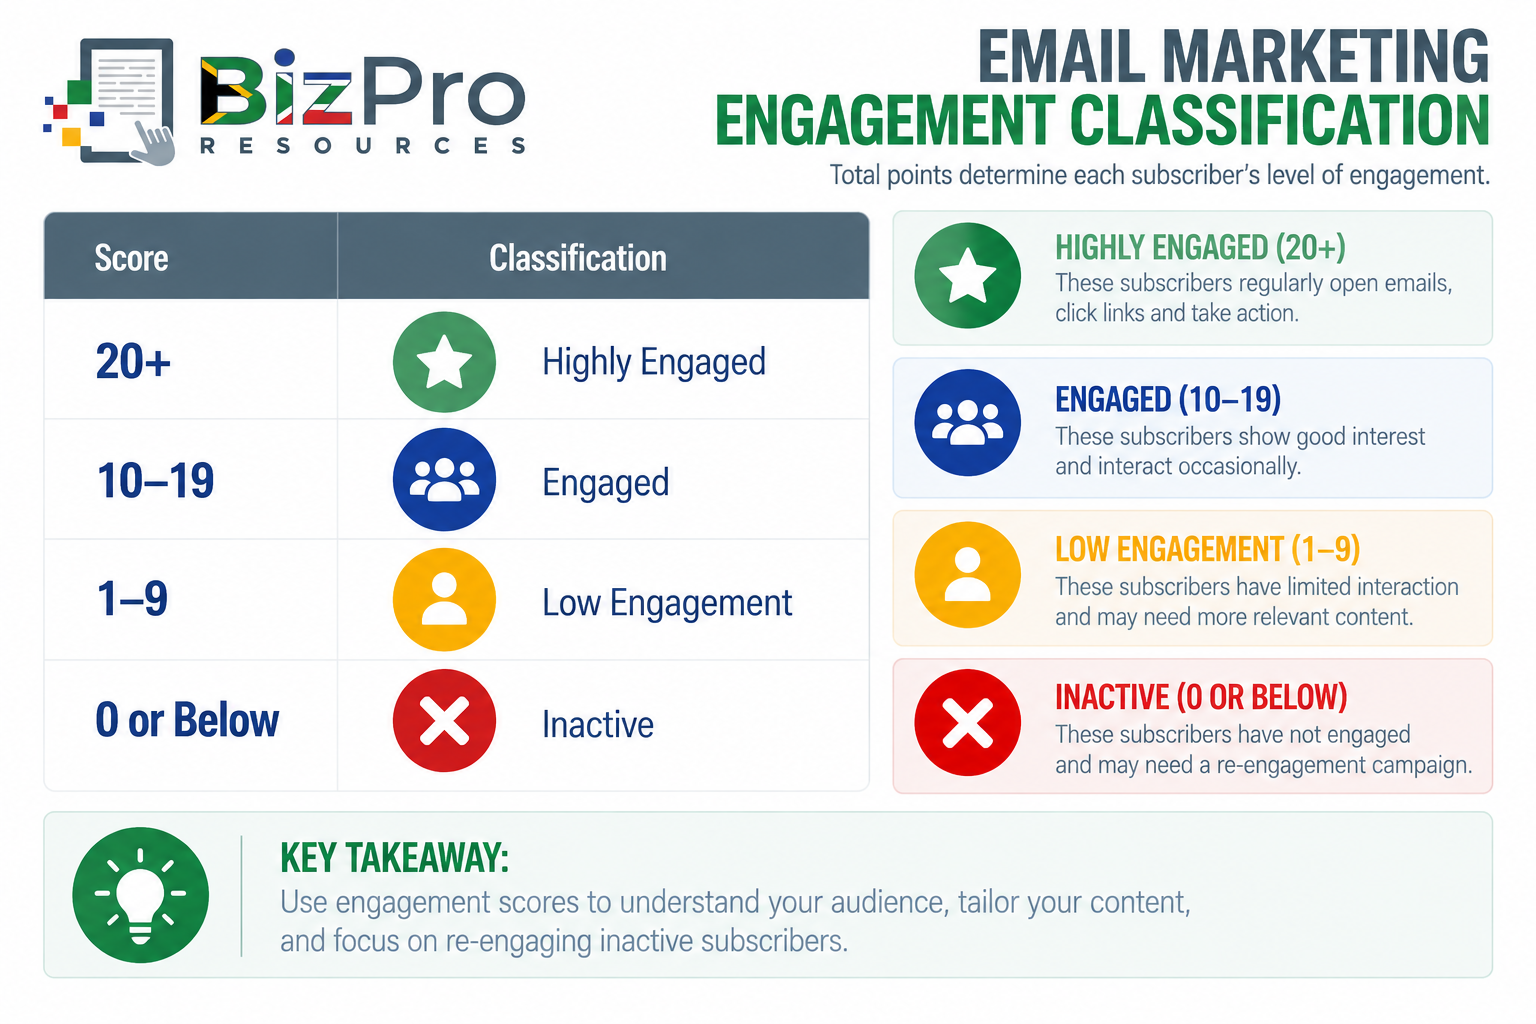
These thresholds are only an example. Each company should develop rules appropriate to its own business.
Example of Poor Email Engagement Performance
Imagine an online business has 10,000 subscribers.
Its engagement analysis shows:
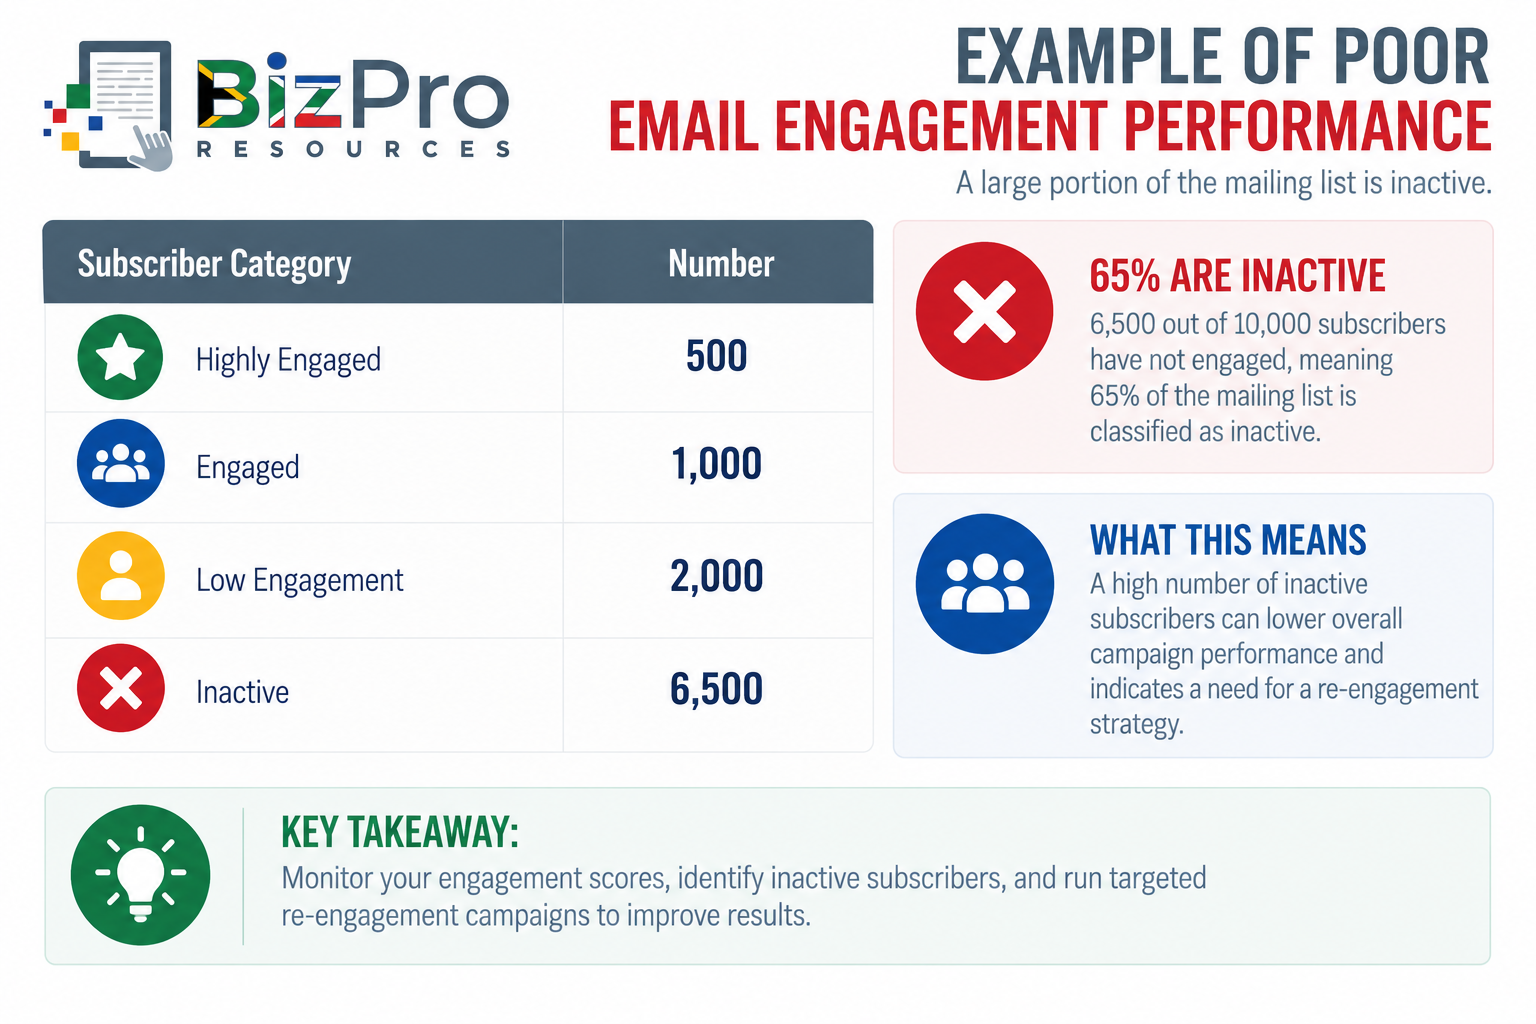
This means: 65% of the mailing list is classified as inactive.
What Does Poor Email Engagement Mean for the Company?
A large inactive segment could indicate:
Content is no longer relevant.
Emails are being sent too frequently.
Emails are being sent too infrequently.
The list contains old addresses.
Subscribers joined for a once-off incentive.
The business has not segmented its audience.
Offers do not match subscriber interests.
The business has focused on list size rather than list quality.
A large inactive list can also distort management reporting.
The company may proudly report: “We have 10,000 subscribers.”
But if only 1,500 regularly engage, the commercially useful audience may be much smaller.
Example of Good Email Engagement Performance
The company begins segmenting subscribers based on:
Products purchased.
Interests.
Previous clicks.
Customer status.
Recent activity.
It also runs a re-engagement campaign for inactive subscribers.
After several months:
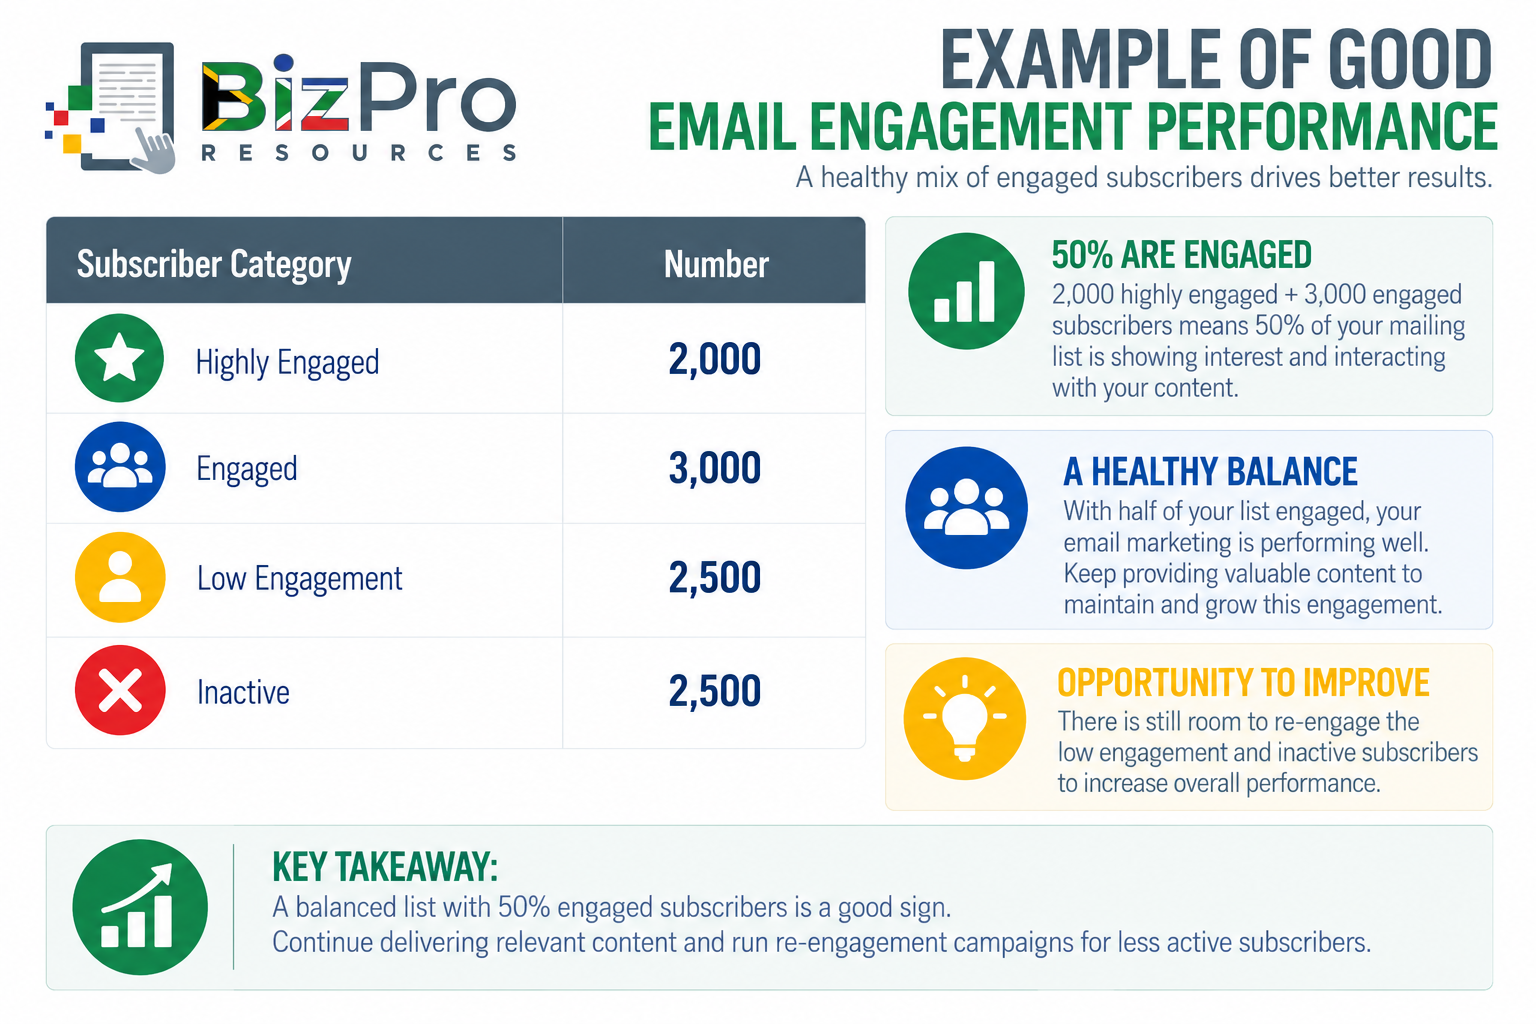
Now 50% of the list falls into the highly engaged or engaged categories.
What Does Good Email Engagement Mean for the Company?
A more engaged list can create:
More website traffic.
More sales opportunities.
More repeat purchases.
Better campaign response.
More useful customer data.
Better audience segmentation.
The business is moving from asking: “How big is our mailing list?” to: “How valuable and responsive is our mailing list?”
That is a much better management question.
3. Email Website Traffic Metrics
What Are Email Website Traffic Metrics?
Email Website Traffic Metrics measure the website activity generated by email marketing campaigns.
Email itself is often only the beginning of the customer journey.
The email may encourage someone to:
View a product.
Read an article.
Request a quotation.
Book an appointment.
Download a resource.
Register for an event.
Complete a purchase.
This means management should track what happens after people leave the email and arrive on the website.
Useful email website traffic measures include:
Sessions from email.
Users from email.
Landing page visits.
Pages viewed.
Engaged sessions.
Conversions from email traffic.
Revenue from email traffic.
The exact metrics available depend on the company's analytics system.
How Are Email Website Traffic Metrics Calculated?
Website analytics software usually identifies email traffic through tracking parameters attached to links.
For example, suppose a campaign generates: Email Clicks = 1,500
Website analytics records:
Sessions Attributed to Email = 1,200
Quotation Requests = 120
The business can calculate an email traffic conversion rate: Email Traffic Conversion Rate = Conversions from Email Traffic ÷ Email Sessions × 100
Therefore: 120 ÷ 1,200 × 100 = 10%
Ten percent of the recorded email-attributed website sessions generated quotation requests.
Example of Poor Email Website Traffic Performance
Imagine a solar installation company sends a campaign to 15,000 subscribers.
Results:
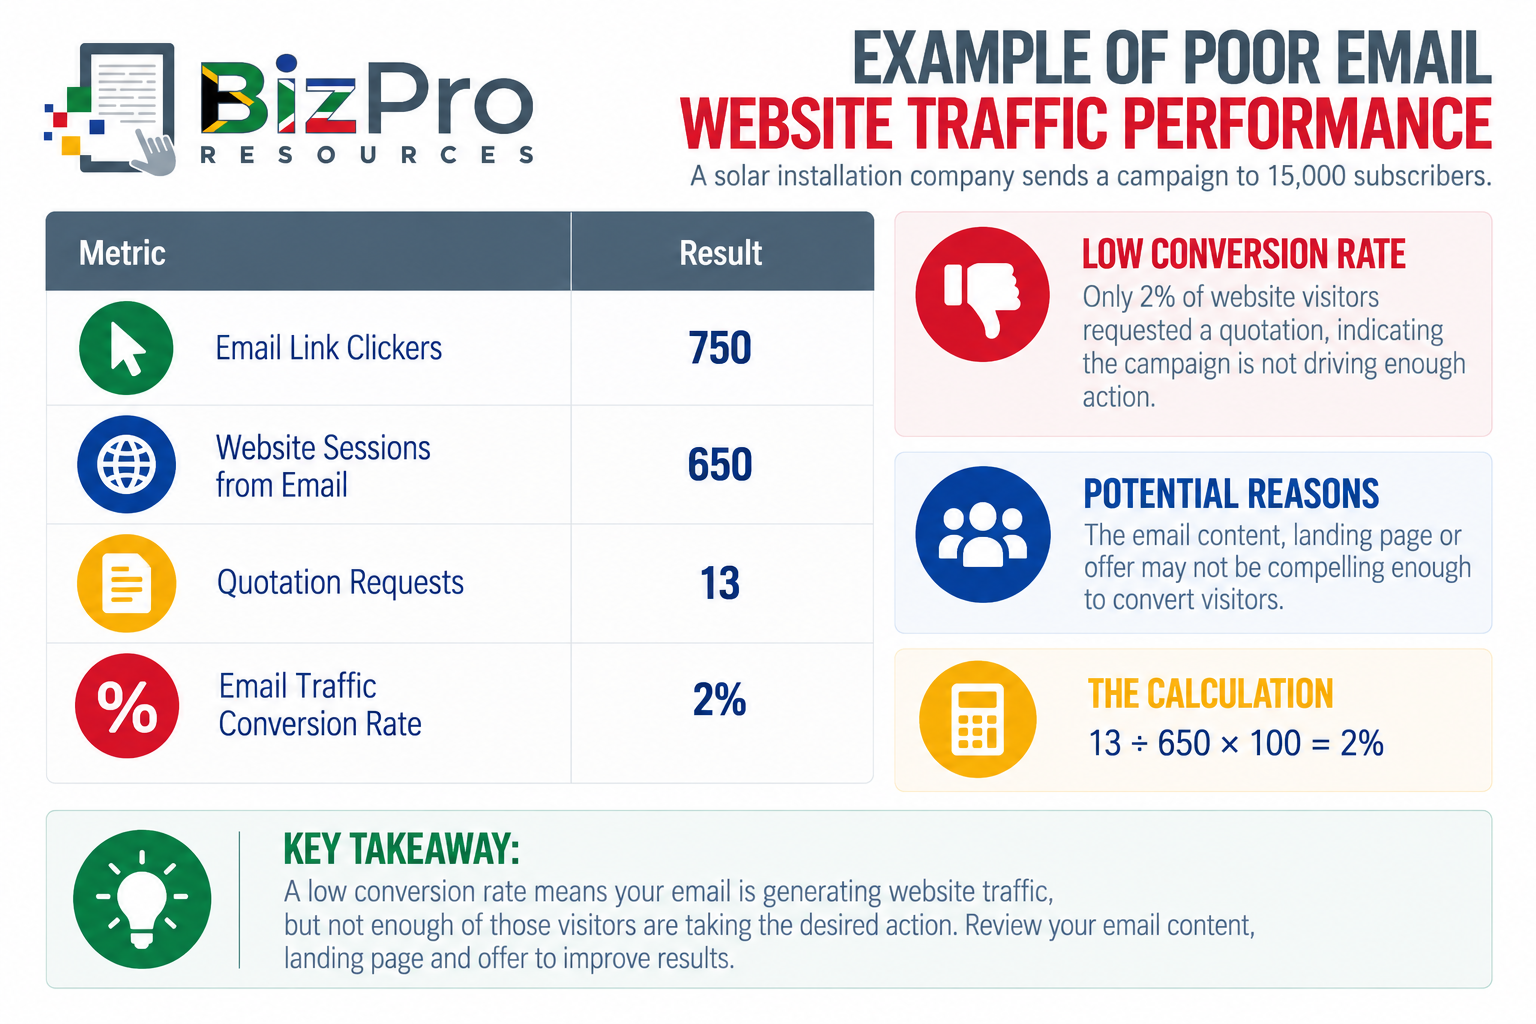
Assume similar campaigns normally convert around 8% of relevant email traffic into quotation requests.
This campaign is performing poorly after visitors reach the website.
What Does Poor Email Website Traffic Performance Mean for the Company?
The email may successfully generate clicks while the destination fails to convert them.
Possible problems include:
Landing page does not match the email.
Website is slow.
Mobile experience is poor.
Offer is unclear.
Form is too complicated.
Pricing discourages visitors.
Website lacks trust signals.
Call-to-action is difficult to find.
This demonstrates why email performance should not end with clicks.
The customer journey continues after the inbox.
Example of Good Email Website Traffic Performance
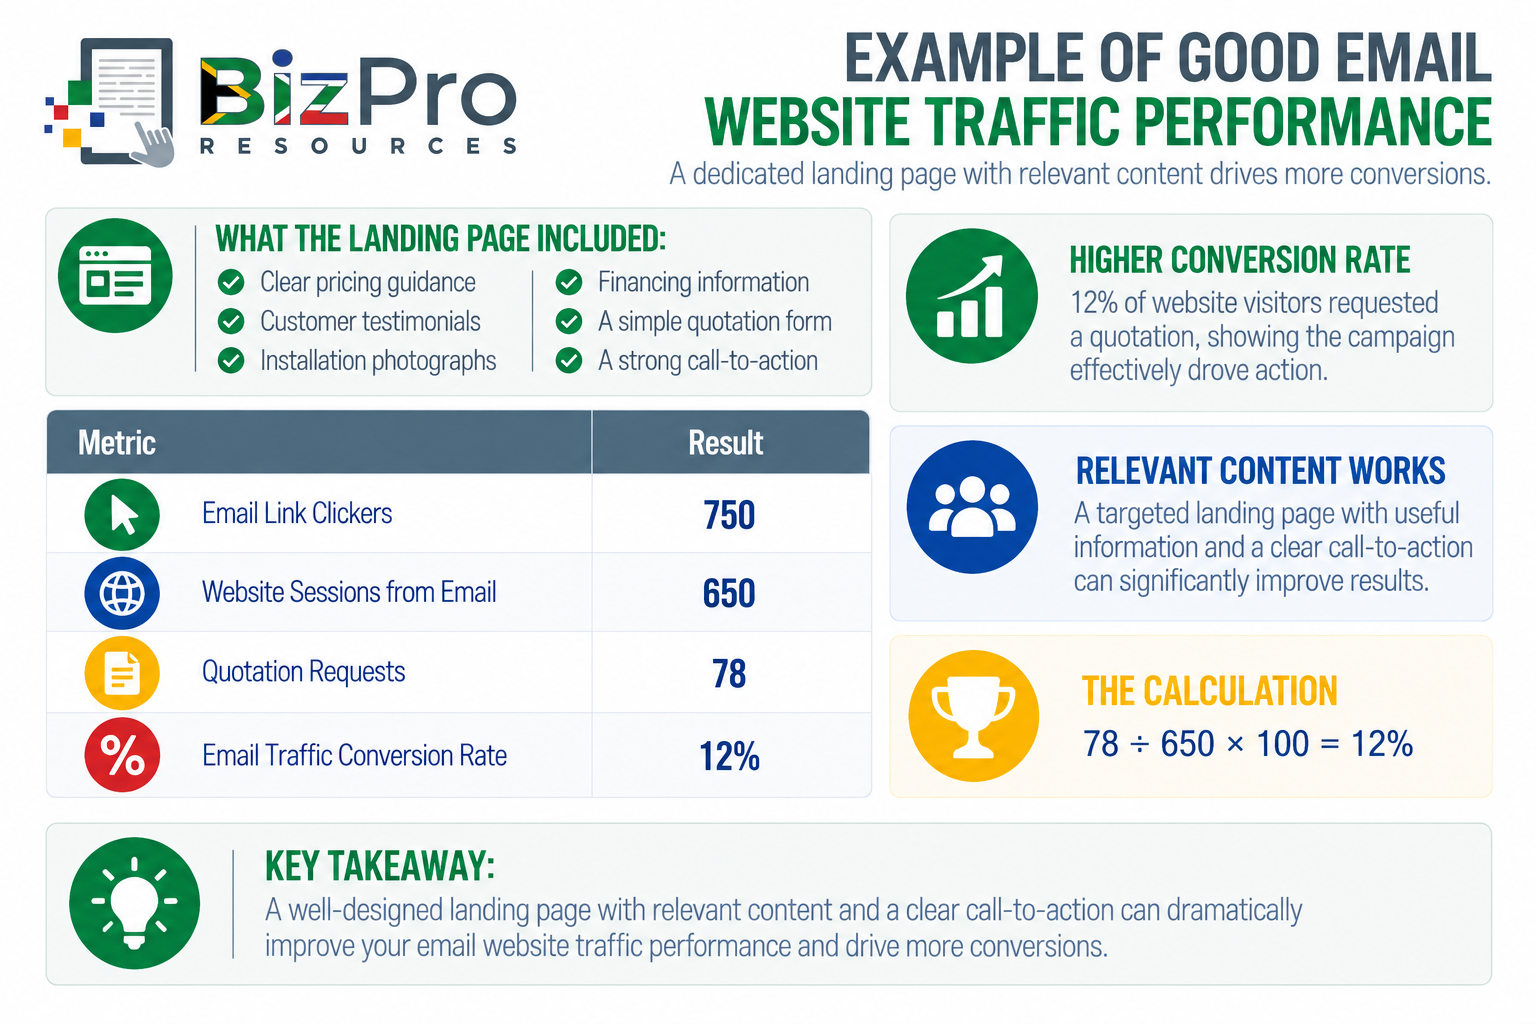
The solar company creates a dedicated landing page that matches the campaign.
It includes:
Clear pricing guidance.
Customer testimonials.
Installation photographs.
Financing information.
A simple quotation form.
A strong call-to-action.
The next campaign produces:
What Does Good Email Website Traffic Performance Mean for the Company?
The same volume of website traffic is now producing six times as many quotation requests: 13 → 78
This suggests the email and website are working together more effectively.
The lesson is important: Do not optimise email marketing separately from the website experience that follows it.
4. Email Bounce Rate
What Is Email Bounce Rate?
Email Bounce Rate measures the percentage of sent emails that could not be successfully delivered to recipients.
A bounced email generally means the receiving mail system rejected or could not deliver the message.
Bounces are commonly divided into two broad categories.
Hard Bounce
A hard bounce usually indicates a more permanent delivery problem.
Examples could include:
Email address does not exist.
Domain does not exist.
Address is invalid.
Soft Bounce
A soft bounce generally indicates a temporary delivery problem.
Examples could include:
Recipient's mailbox is full.
Temporary server problem.
Message is too large.
Temporary delivery restriction.
The exact classifications can vary between email systems.
How Is Email Bounce Rate Calculated?
A common formula is: Email Bounce Rate = Bounced Emails ÷ Emails Sent × 100
Suppose a business sends: 10,000 emails
Of these: 500 bounce
The calculation is: 500 ÷ 10,000 × 100 = 5%
The Email Bounce Rate is 5%.
This means 5% of the sent messages were recorded as undeliverable.
Example of Poor Email Bounce Rate
Imagine a small business sends a campaign:
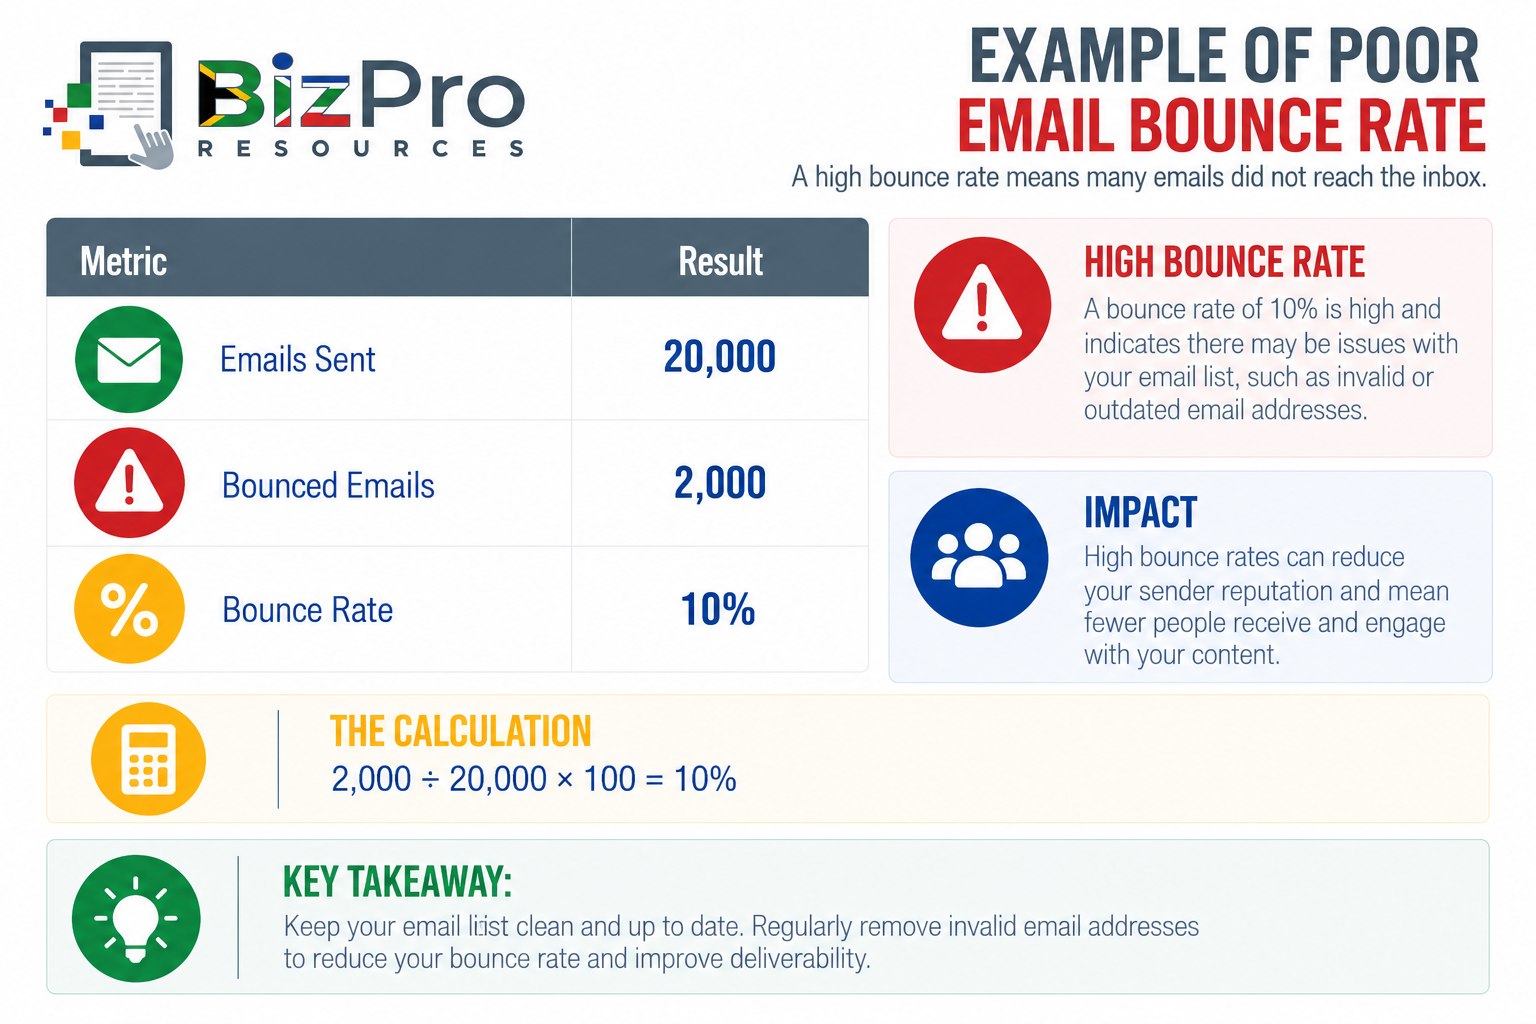
Assume the business historically experiences a much lower bounce rate.
A sudden increase to 10% should be investigated immediately.
What Does Poor Email Bounce Rate Mean for the Company?
A high bounce rate may indicate:
Mailing list is old.
Email addresses were entered incorrectly.
Invalid addresses have not been removed.
Poor-quality contact data was imported.
The business purchased a poor-quality mailing list.
Sign-up forms allow obvious errors.
List maintenance is weak.
High bounce levels can also harm email marketing efficiency.
The company may be paying to store or send to contacts it cannot actually reach.
Persistent poor list quality may also create broader deliverability concerns.
Example of Good Email Bounce Rate
The company cleans its mailing list:
Removes invalid addresses.
Corrects obvious errors.
Uses better sign-up validation.
Stops importing questionable contact lists.
Regularly monitors delivery problems.
The next campaign produces:
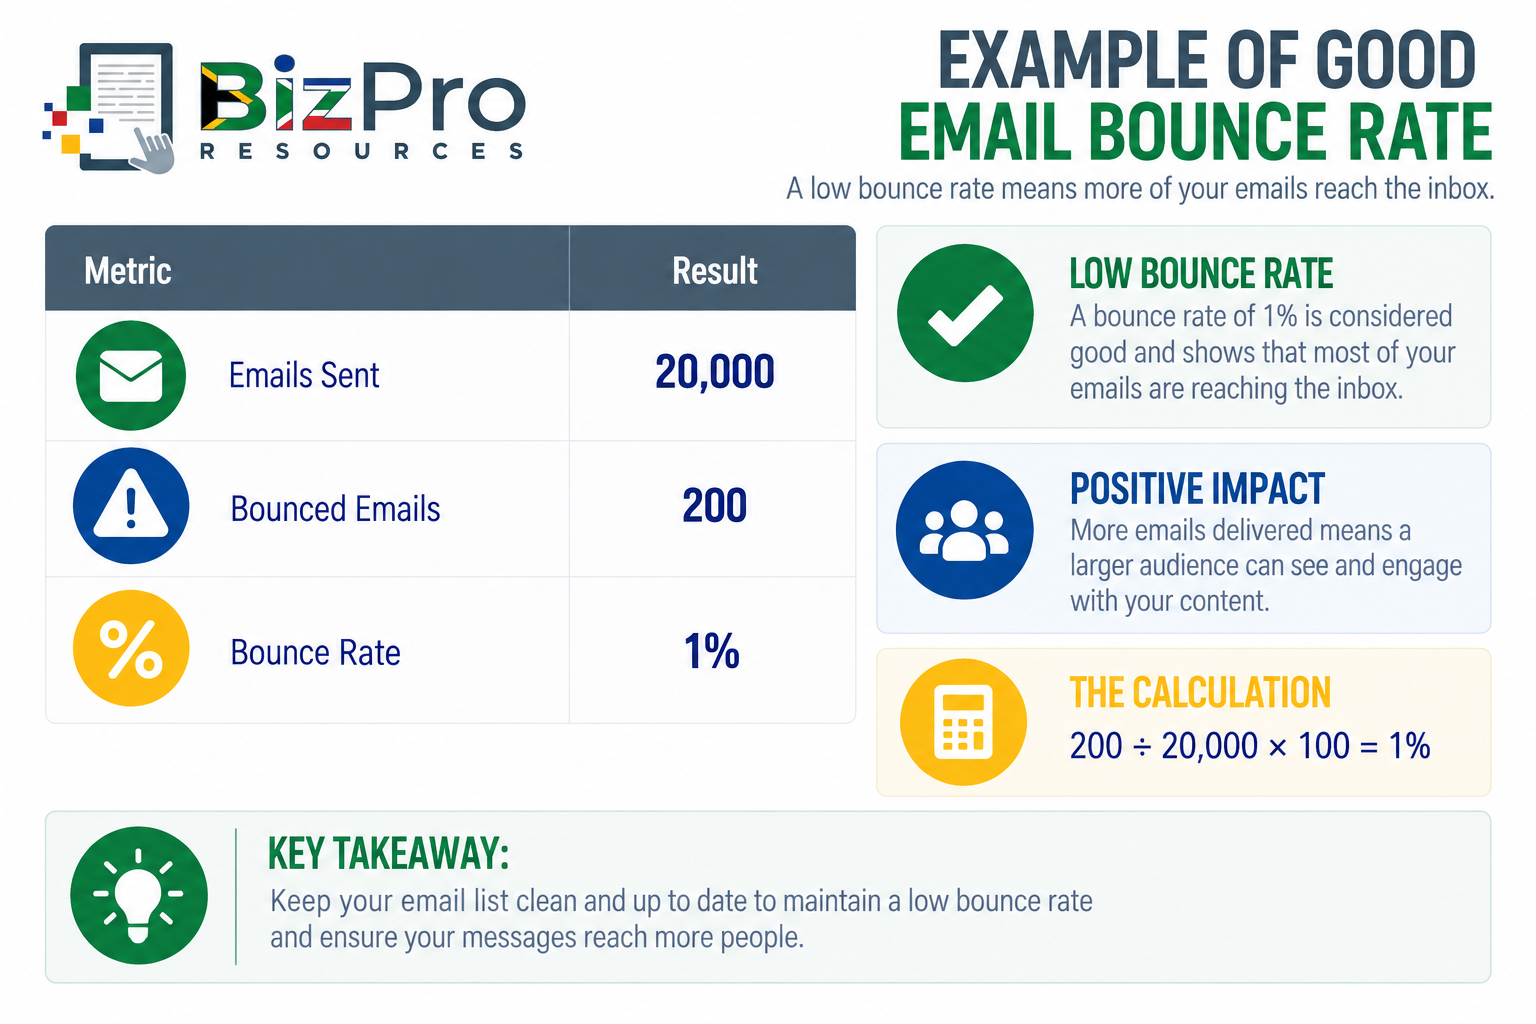
What Does Good Email Bounce Rate Mean for the Company?
A lower bounce rate suggests that a much larger proportion of the mailing list consists of deliverable addresses.
This can improve:
List quality.
Campaign efficiency.
Reporting accuracy.
Deliverability management.
Previously: 2,000 messages bounced
Now: 200 messages bounce
The company has significantly reduced wasted sends to undeliverable addresses.
5. Email Click-Through Rate
What Is Email Click-Through Rate?
Email Click-Through Rate measures the percentage of delivered emails that generate clicks.
It helps answer: “Of the emails that reached recipients, how many resulted in a click?”
This differs from CTOR.
Remember:
CTOR compares clicks with opens.
Email CTR compares clicks with delivered emails.
These metrics therefore answer different questions.
How Is Email Click-Through Rate Calculated?
A common formula is: Email CTR = Unique Clickers ÷ Delivered Emails × 100
Suppose:
Emails Sent = 10,000
Bounces = 200
Therefore: Delivered Emails = 9,800
Suppose: Unique Clickers = 490
Then: Email CTR = 490 ÷ 9,800 × 100 = 5%
Five percent of delivered emails generated a recorded unique click.
Businesses should confirm whether their email platform reports unique clicks or total clicks and remain consistent when comparing campaigns.
Example of Poor Email Click-Through Rate
Imagine a commercial cleaning company sends: Delivered Emails = 8,000
The campaign generates: Unique Clickers = 80
Therefore: Email CTR = 80 ÷ 8,000 × 100 = 1%
Assume similar campaigns historically achieve around 4%.
The campaign is underperforming.
What Does Poor Email CTR Mean for the Company?
A low CTR may indicate:
Subject line failed to attract the right audience.
Content is not relevant.
Call-to-action is weak.
Offer is unattractive.
Email is too long.
Links are difficult to find.
Subscribers are disengaged.
Audience segmentation is poor.
Email design performs badly on mobile devices.
The company sends too many emails.
Management should compare CTR with CTOR and other metrics before deciding what to change.
Example of Good Email Click-Through Rate
The cleaning company segments its database.
Instead of sending the same generic email to everyone, it creates an offer specifically for office managers and business owners.
The campaign generates:
Delivered Emails = 8,000
Unique Clickers = 640
Therefore: Email CTR = 640 ÷ 8,000 × 100 = 8%
What Does Good Email CTR Mean for the Company?
The campaign is now producing substantially more website interest from the same number of delivered emails.
Previously: 8,000 delivered → 80 clickers
Now: 8,000 delivered → 640 clickers
The business generates eight times as many clickers.
This suggests stronger:
Audience targeting.
Content relevance.
Offer quality.
Calls-to-action.
But management still needs to measure whether those clicks become leads and customers.
CTOR and Email CTR Are Not the Same
These two metrics are easy to confuse.
Consider this example:
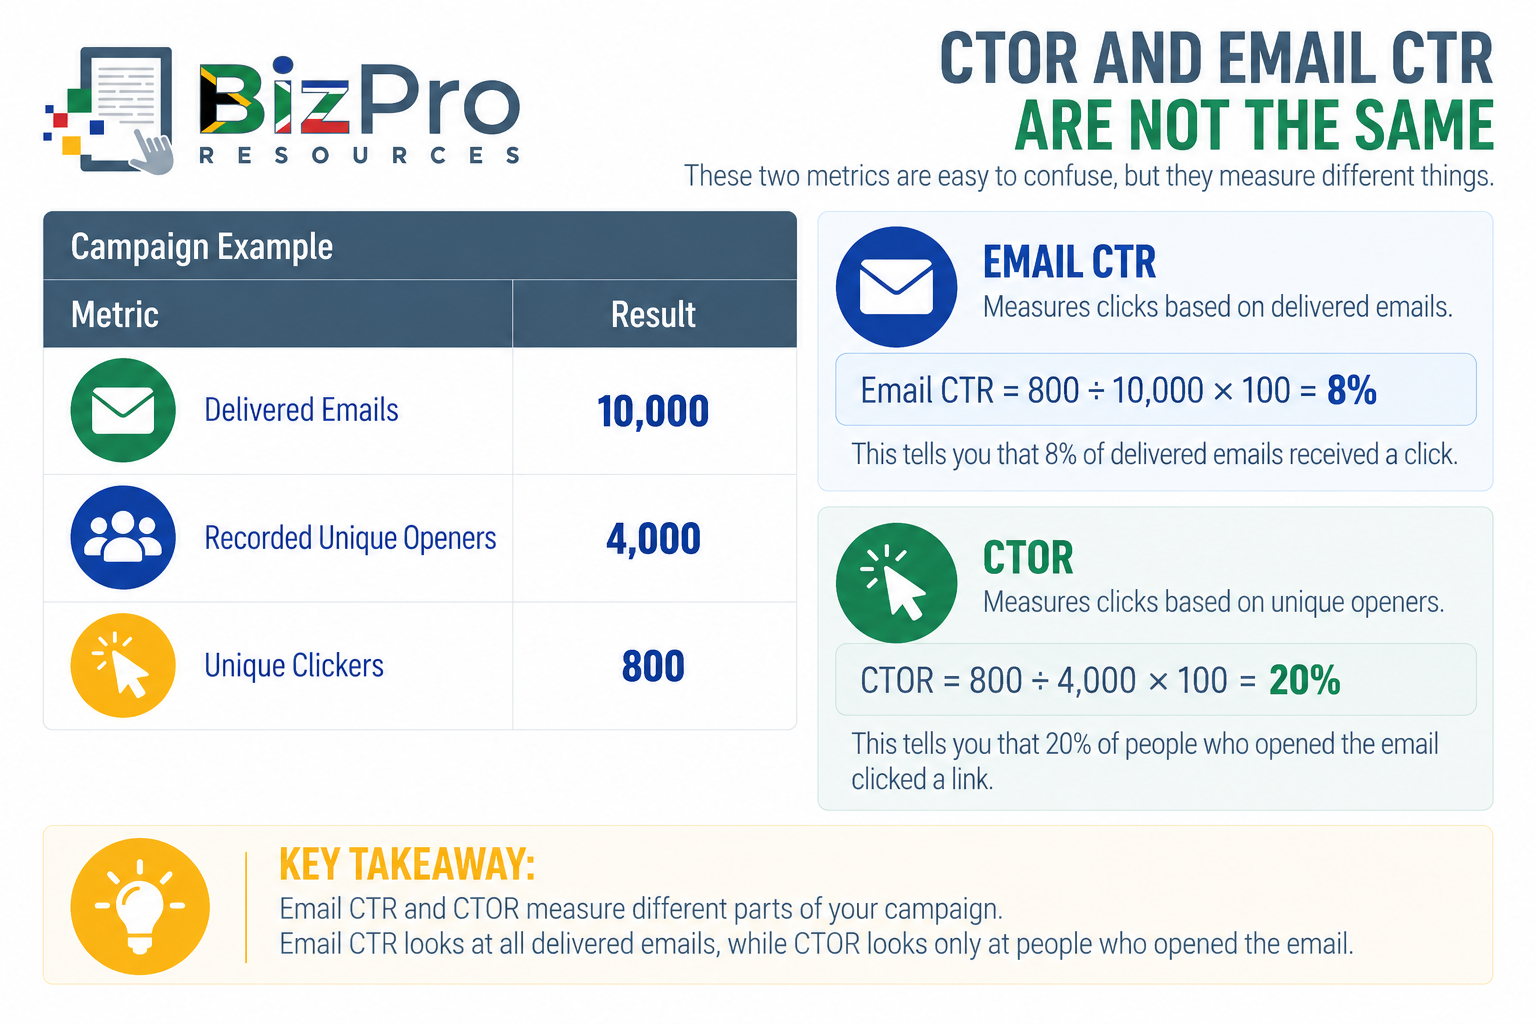
Both numbers describe the same campaign.
But they measure different things:
Email CTR = 8% asks How many delivered emails produced a click?
CTOR = 20% asks How many recorded openers produced a click?
Management should therefore label these metrics clearly.
How the Five Email Marketing Metrics Work Together
These metrics can be viewed as parts of a customer journey:
Send → Deliver → Engage → Click → Visit Website → Convert
Each metric helps diagnose a different stage.
Email Bounce Rate
Can we successfully deliver messages to the list?
Email Engagement Score
How active and responsive are our subscribers over time?
Email CTR
How effectively are delivered emails generating clicks?
CTOR
How effectively is the email content generating clicks among recorded openers?
Email Website Traffic Metrics
What happens after people leave the email and visit the website?
Together, they provide a much stronger picture than any one metric alone.
Example of How the Metrics Work Together
Consider two campaigns:
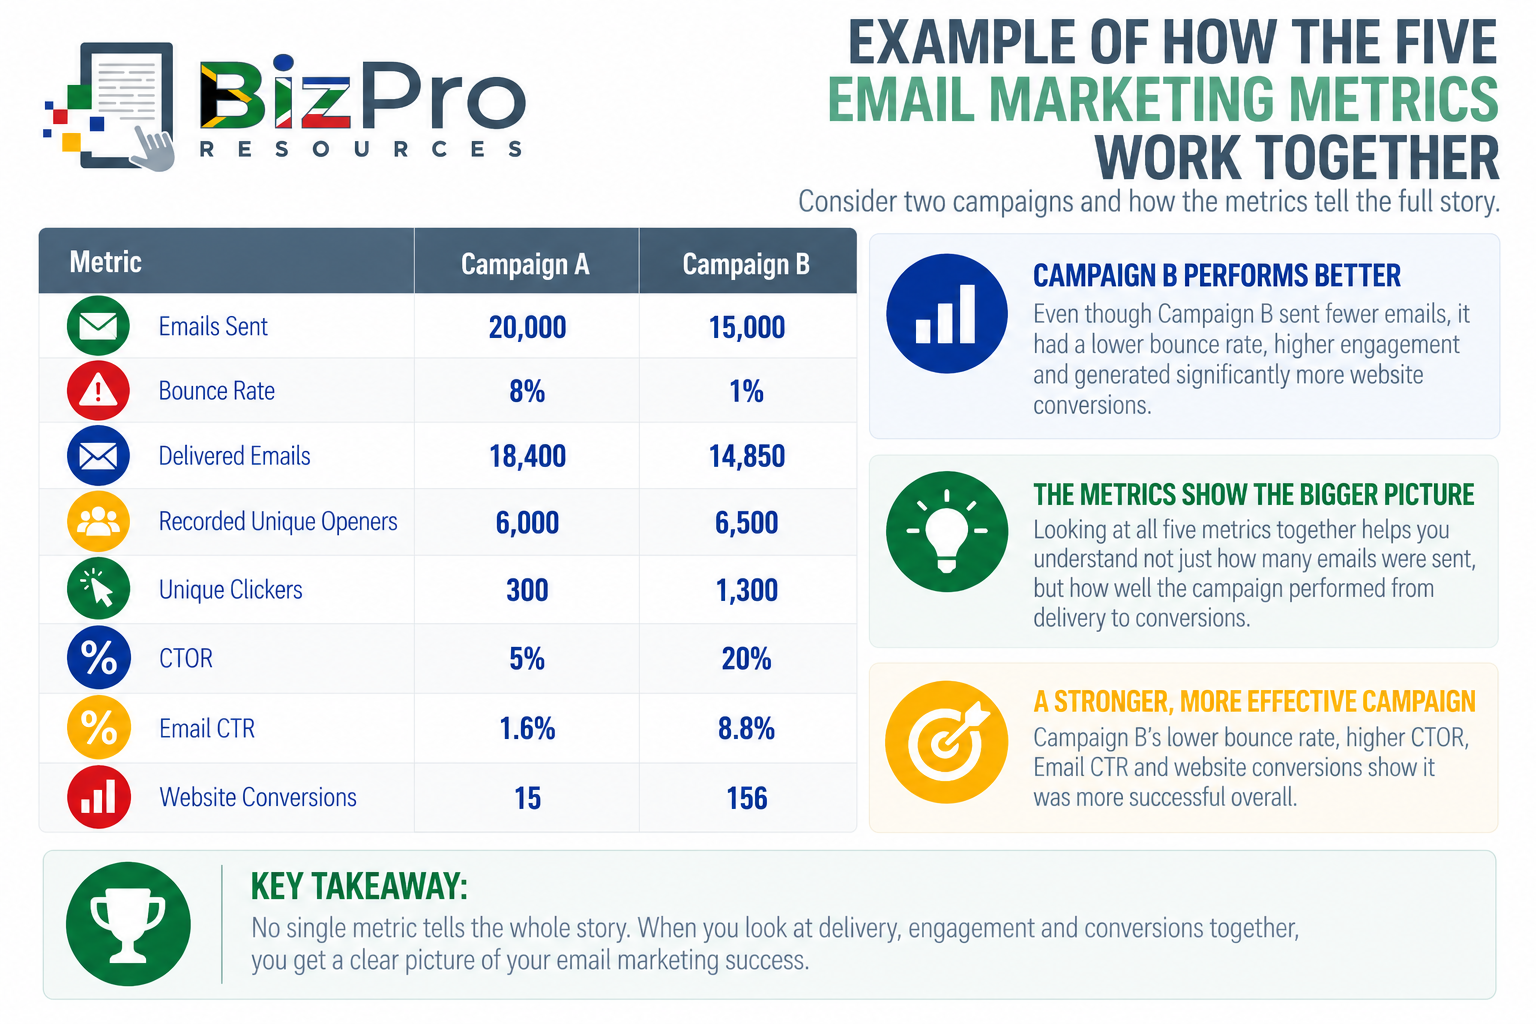
Campaign A was sent to more people.
If management focuses only on list size or emails sent, Campaign A appears stronger.
But Campaign B:
Has a much healthier delivery rate.
Produces stronger engagement.
Generates far more clicks.
Creates substantially more website conversions.
The smaller campaign is clearly producing more useful marketing activity.
Do Not Judge Email Marketing by List Size
A common vanity metric is: “We have 50,000 email subscribers.”
That sounds impressive.
But suppose:
5,000 addresses bounce.
30,000 subscribers are inactive.
Only 1,000 regularly click.
Very few become customers.
The list may be far less valuable than it appears.
Compare that with another company: Subscribers = 8,000
But:
Almost all emails are deliverable.
Subscribers are highly engaged.
1,500 regularly click.
Email consistently generates sales.
The smaller list could be significantly more valuable.
The objective is not simply: Build the biggest mailing list possible.
The objective is: Build a relevant, deliverable, engaged, commercially useful mailing list.
Segment Your Email Metrics
Overall averages can hide important differences.
Suppose a business has an overall Email CTR of 4%.
Segmenting the database reveals:
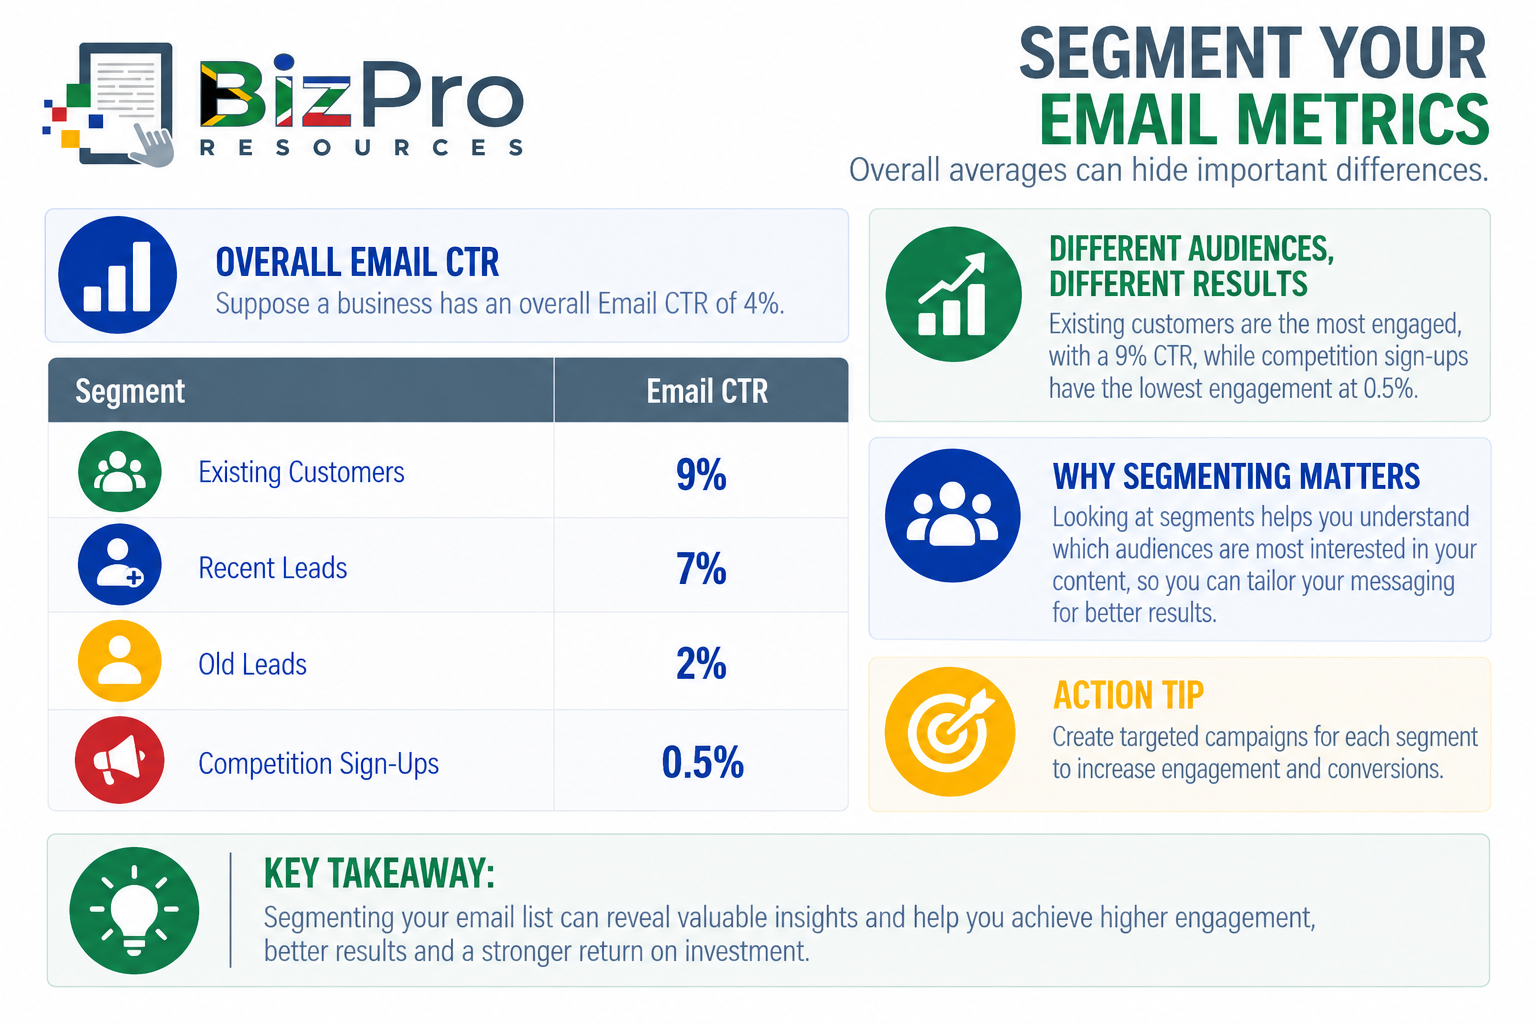
Now management has a much clearer picture.
The poor overall performance is largely driven by old or low-quality subscribers.
Useful segmentation can include:
Existing customers.
Potential customers.
Products purchased.
Geographic location.
Industry.
Customer value.
Previous engagement.
Lead source.
Time since last purchase.
Better segmentation often allows a business to send more relevant emails to fewer people.
That can be far more effective than sending every message to everyone.
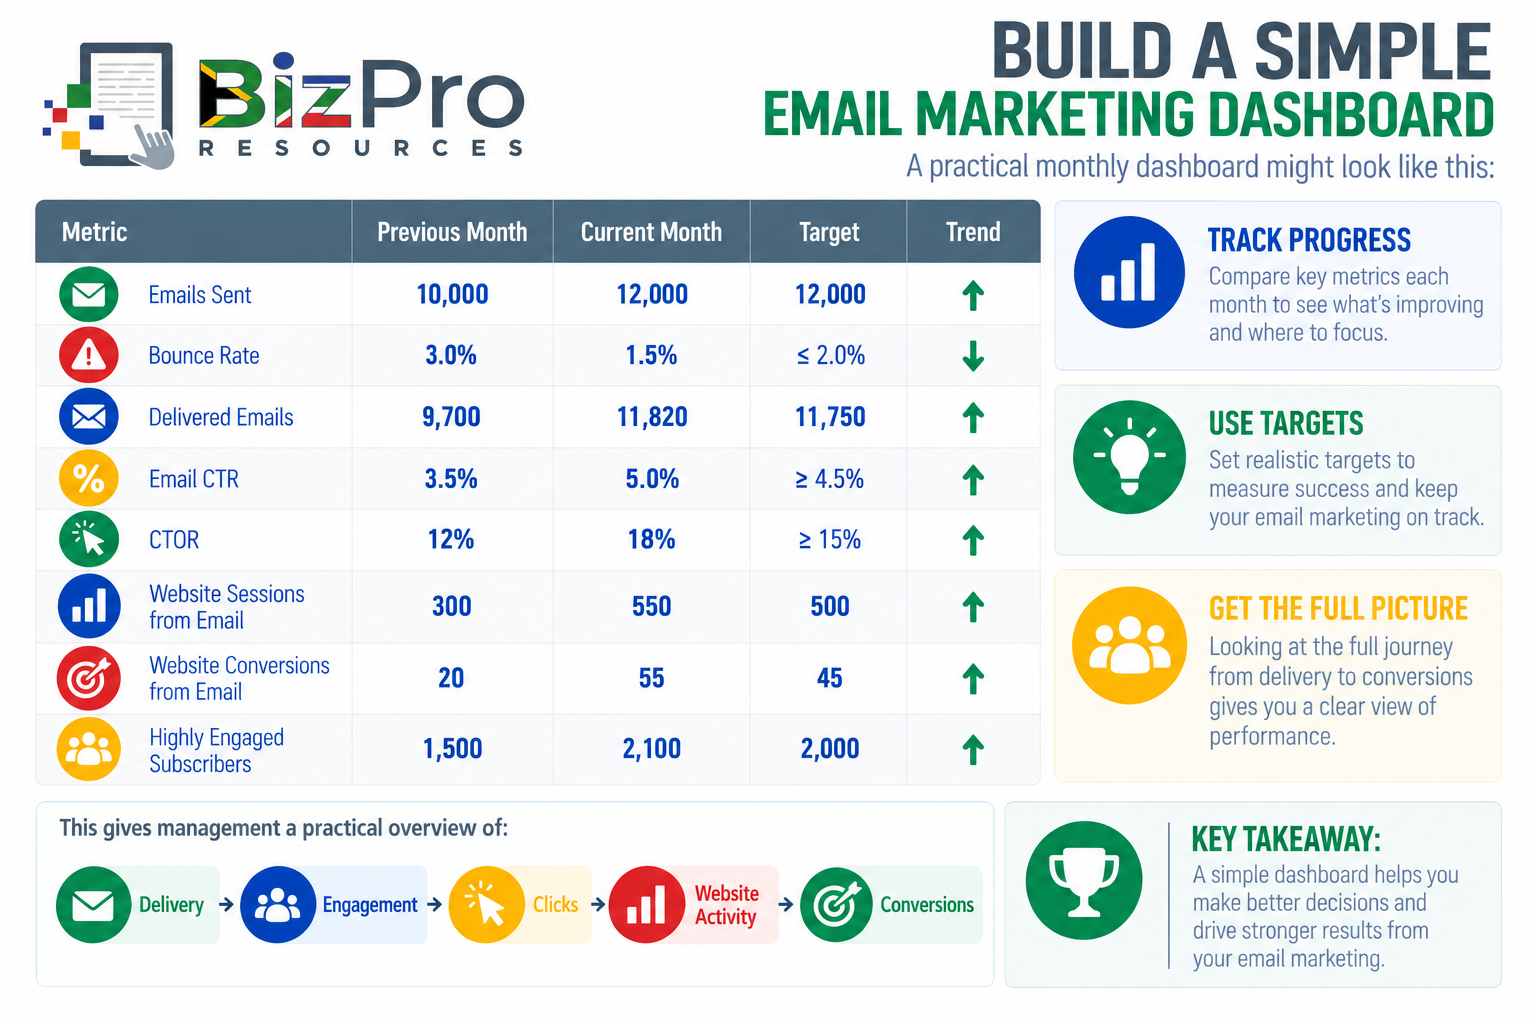
Build a Simple Email Marketing Dashboard
A practical monthly dashboard might look like this:
Track Trends, Not Just Individual Campaigns
One campaign can perform unusually well or badly for many reasons.
Management should therefore monitor trends.
For example:
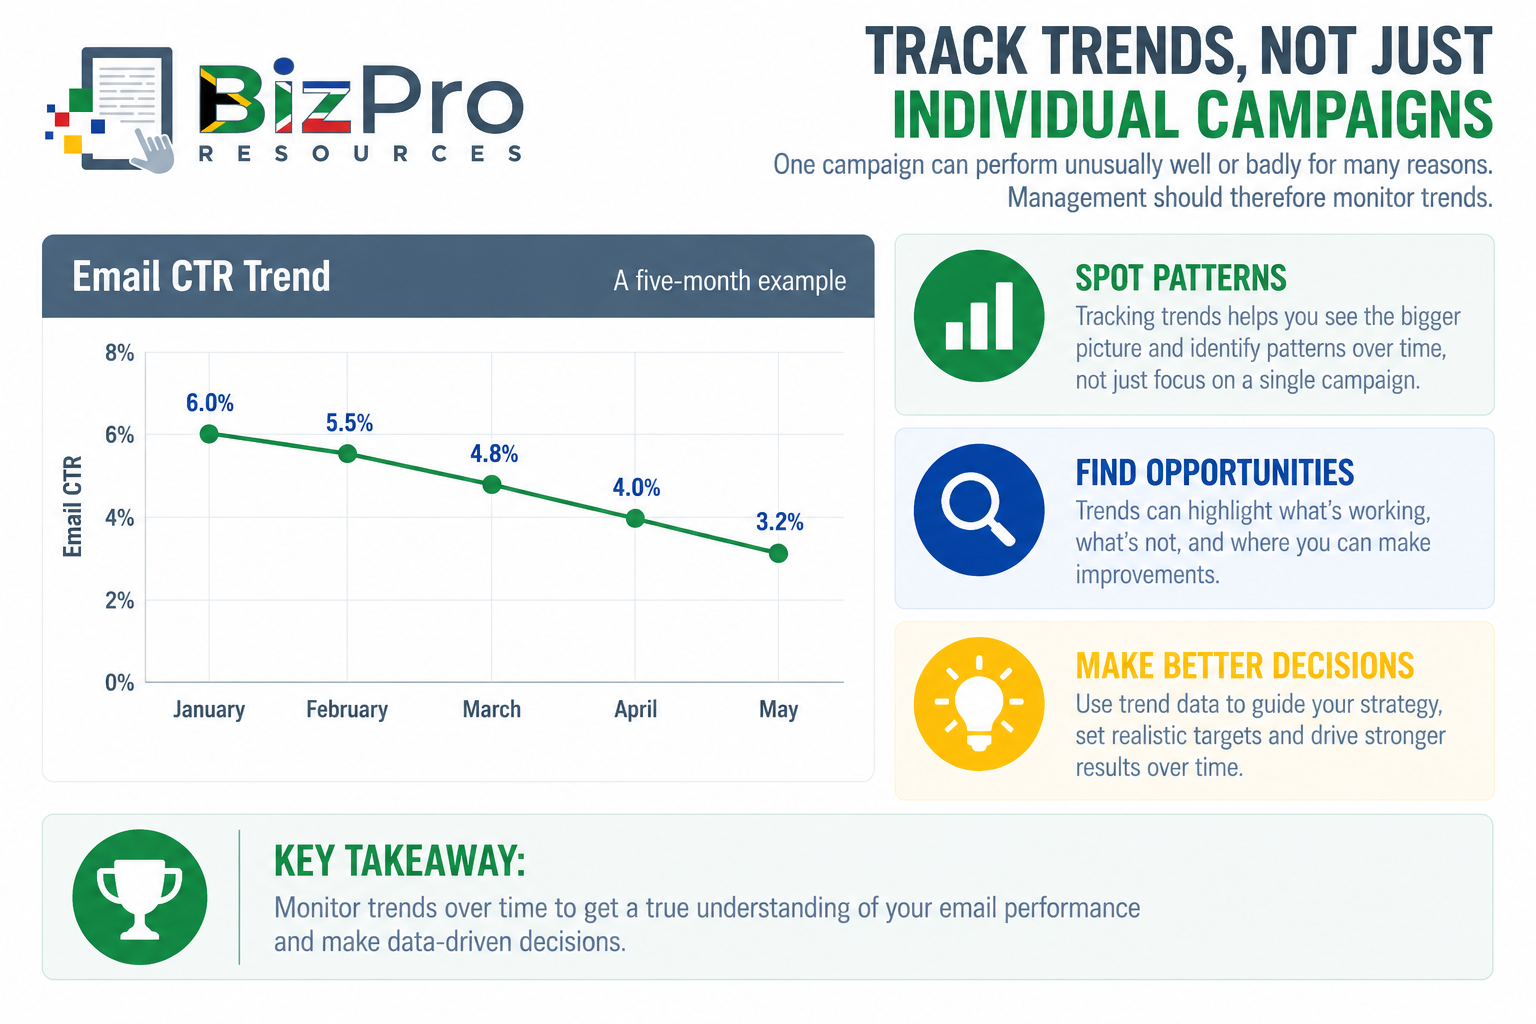
The downward trend deserves investigation.
Possible reasons include:
Subscriber fatigue.
Less relevant content.
Increased sending frequency.
Poor segmentation.
Repetitive offers.
Declining list quality.
A trend can reveal a developing problem before performance collapses.
What Does Good Email Marketing Performance Look Like?
There is no universal CTOR, Email CTR, Engagement Score, Website Traffic target, or Bounce Rate that applies to every business.
Performance depends on:
Industry.
Audience.
Type of email.
Campaign objective.
Mailing list quality.
Frequency.
Customer relationship.
Offer.
Content.
Email platform.
Instead of blindly chasing generic benchmarks, businesses should establish their own baseline and monitor improvement.
Healthy email marketing generally means:
Bounce Rate remains controlled - Most email addresses are valid and deliverable.
Engagement remains strong - A meaningful proportion of subscribers continue interacting with the business.
Email CTR is healthy or improving - Delivered emails are generating clicks.
CTOR indicates that email content is persuading recorded openers to take further action.
Email Website Traffic creates useful activity - People who click are visiting relevant pages and taking meaningful actions.
Most importantly: Email contributes to leads, customers, repeat purchases, and financial value.
Turning Email Marketing Metrics into Action
Metrics should lead to decisions.
If CTOR is poor, investigate:
Email content.
Calls-to-action.
Offers.
Layout.
Relevance.
If the Email Marketing Engagement Score is poor, investigate:
Segmentation.
Content relevance.
Sending frequency.
Inactive subscribers.
List quality.
If Email Website Traffic performs poorly, investigate:
Landing pages.
Website speed.
Mobile experience.
Conversion forms.
Message consistency.
If Email Bounce Rate is high, investigate:
Invalid addresses.
Old contacts.
Data quality.
Sign-up processes.
List maintenance.
If Email CTR is poor, investigate:
Audience.
Content.
Offers.
Calls-to-action.
Subscriber fatigue.
Segmentation.
Then make improvements.
Measure again.
Compare the results.
Keep what works.
Change what does not.
The process should remain:
Measure → Investigate → Act → Measure Again
Final Thoughts
Email marketing should not be measured by how many emails a company sends.
Sending 100,000 emails is not impressive if most recipients ignore them.
A smaller, engaged mailing list can be far more valuable than a huge inactive database:
Click-to-Open Rate helps show how effectively email content encourages recorded openers to click.
Email Marketing Engagement Score helps identify how actively subscribers interact with the business over time.
Email Website Traffic Metrics show what happens when subscribers leave the inbox and visit the website.
Email Bounce Rate helps measure the quality and deliverability of the mailing list.
Email Click-Through Rate shows how effectively delivered emails generate clicks.
Together, these metrics allow management to look beyond: “How many emails did we send?” and instead ask: “Did we reach the right people, did they engage, did they click, and did those clicks create valuable business activity?”
That is the real purpose of email marketing measurement.
The objective is not simply to fill inboxes.
It is to build a relevant audience, communicate useful messages, encourage meaningful action, and turn email marketing into a measurable contributor to business growth..
Related Articles in the Marketing Performance Metrics Series
Marketing Financial Metrics: ROI, CAC, CLV, and ROAS Explained
Marketing Conversion and Lead Metrics: CVR, CPL, and MQL Explained
Marketing Traffic and Engagement Metrics: CTR, Bounce Rate, and Engagement Rate Explained
Social Media Metrics: Followers, Comments, Engagement Rate, and Video Views Explained
SEO Metrics: Page Views, CTR, Domain AUthority, Organic Traffic, and Keyword Rankings Explained
Email Marketing Metrics: CTOR, Engagement, Website Traffic, Bounce Rate, and CTR Explained
AI Disclaimer
AI Tools were used to assist with research. Remember to always cross-check everything that you read.


