
Marketing Traffic and Engagement Metrics: CTR, Bounce Rate, and Engagement Rate Explained
Article #3 of #7 in the Marketing Performance Metrics Series
Introduction
Getting your marketing in front of people is only the beginning.
The next question is: What do people do when they see it?
Do they click?
Do they visit your website and immediately leave?
Do they read your content, watch your videos, comment on your posts, or interact with your business?
These questions are important because marketing attention has very little value if people are not interested enough to take the next step.
A business might proudly report: “Our advertisement was shown 100,000 times.”
That sounds impressive. But what if only 100 people clicked on it?
Another company might report: “Our website received 10,000 visitors this month.”
Again, that sounds positive. But what if most visitors left almost immediately without doing anything?
A social media page might have 50,000 followers, but what if almost nobody interacts with its content?
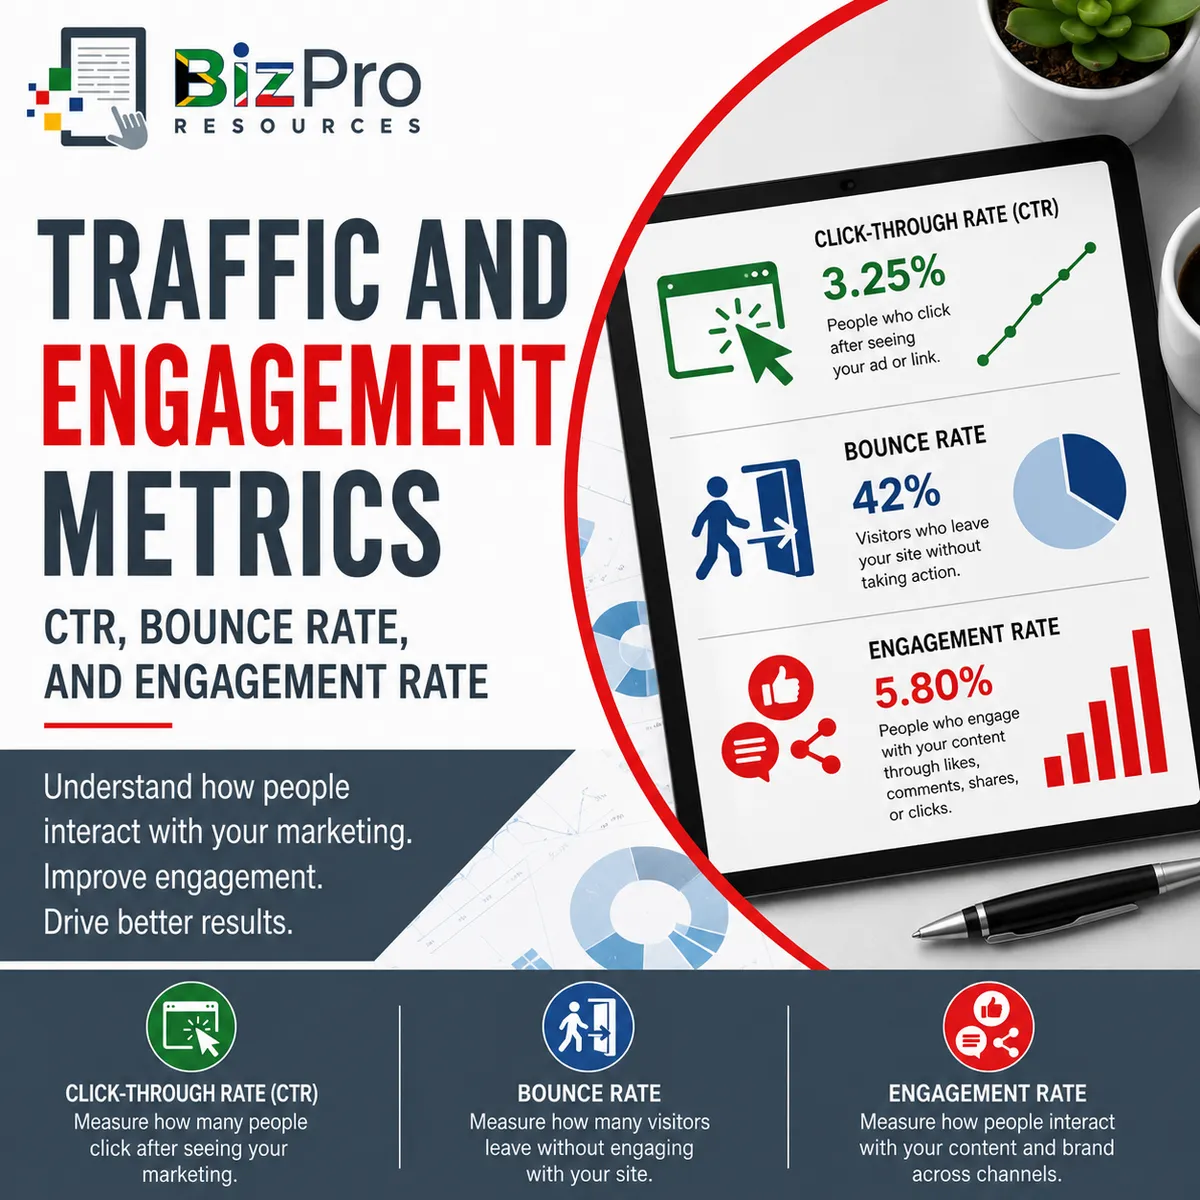
Traffic and engagement metrics help businesses look beyond headline numbers and understand how people actually respond to marketing.
Three useful metrics are:
Click-Through Rate (CTR)
Bounce Rate
Engagement Rate
Together, these metrics help answer three practical questions:
Click-Through Rate: Are people interested enough in our marketing to click?
Bounce Rate: Are visitors leaving without meaningfully engaging with our website or landing page?
Engagement Rate: Are people interacting with our content?
For small businesses with limited marketing budgets, these metrics can help identify where marketing is working and where potential customers are losing interest.
1. Click-Through Rate (CTR)
What Is Click-Through Rate?
Click-Through Rate, usually abbreviated as CTR, measures the percentage of people who click on a link, advertisement, button, or other clickable marketing element after having an opportunity to see it.
CTR is commonly used for:
Google Ads
Social media advertising
Display advertisements
Email marketing
Search results
Online banners
Marketing messages
Website calls-to-action
CTR helps answer: “Of the people who saw this marketing message, how many were interested enough to click?”
For example, imagine a company runs a Google advertisement:
The advertisement appears 10,000 times.
It receives 300 clicks.
CTR tells the business what percentage of those advertising impressions resulted in clicks.
How Is Click-Through Rate Calculated?
The standard formula is: CTR = Number of Clicks ÷ Number of Impressions × 100
Using the example:
Impressions = 10,000
Clicks = 300
Therefore: CTR = 300 ÷ 10,000 × 100 = 3%
The advertisement therefore achieved a 3% Click-Through Rate.
This means that approximately three out of every 100 impressions resulted in a click.
What Is an Impression?
An impression generally means that a piece of content or an advertisement was displayed.
If an advertisement receives 20,000 impressions, this does not necessarily mean that 20,000 different people saw it.
One person may have been shown the advertisement several times.
For this reason: Impressions are not necessarily the same as unique people reached.
Businesses should understand how the marketing platform defines impressions when interpreting CTR.
CTR Depends on What You Are Measuring
CTR can be measured in different marketing environments.
For example:
Advertising CTR
Advertisement Clicks ÷ Advertisement Impressions × 100
Email CTR
Email Link Clicks ÷ Delivered Emails × 100
Depending on the email platform, reporting definitions may differ, so management should understand exactly how the software calculates the metric.
Website CTR
A business could measure the percentage of visitors who click a particular button.
For example: “Request a Quote” Clicks ÷ Page Visitors × 100
The underlying principle remains the same: How often does exposure lead to a click?
Example of Poor Click-Through Rate
Imagine a Durban vehicle repair business runs a paid social media campaign promoting air-conditioning repairs.
The advertisement receives:
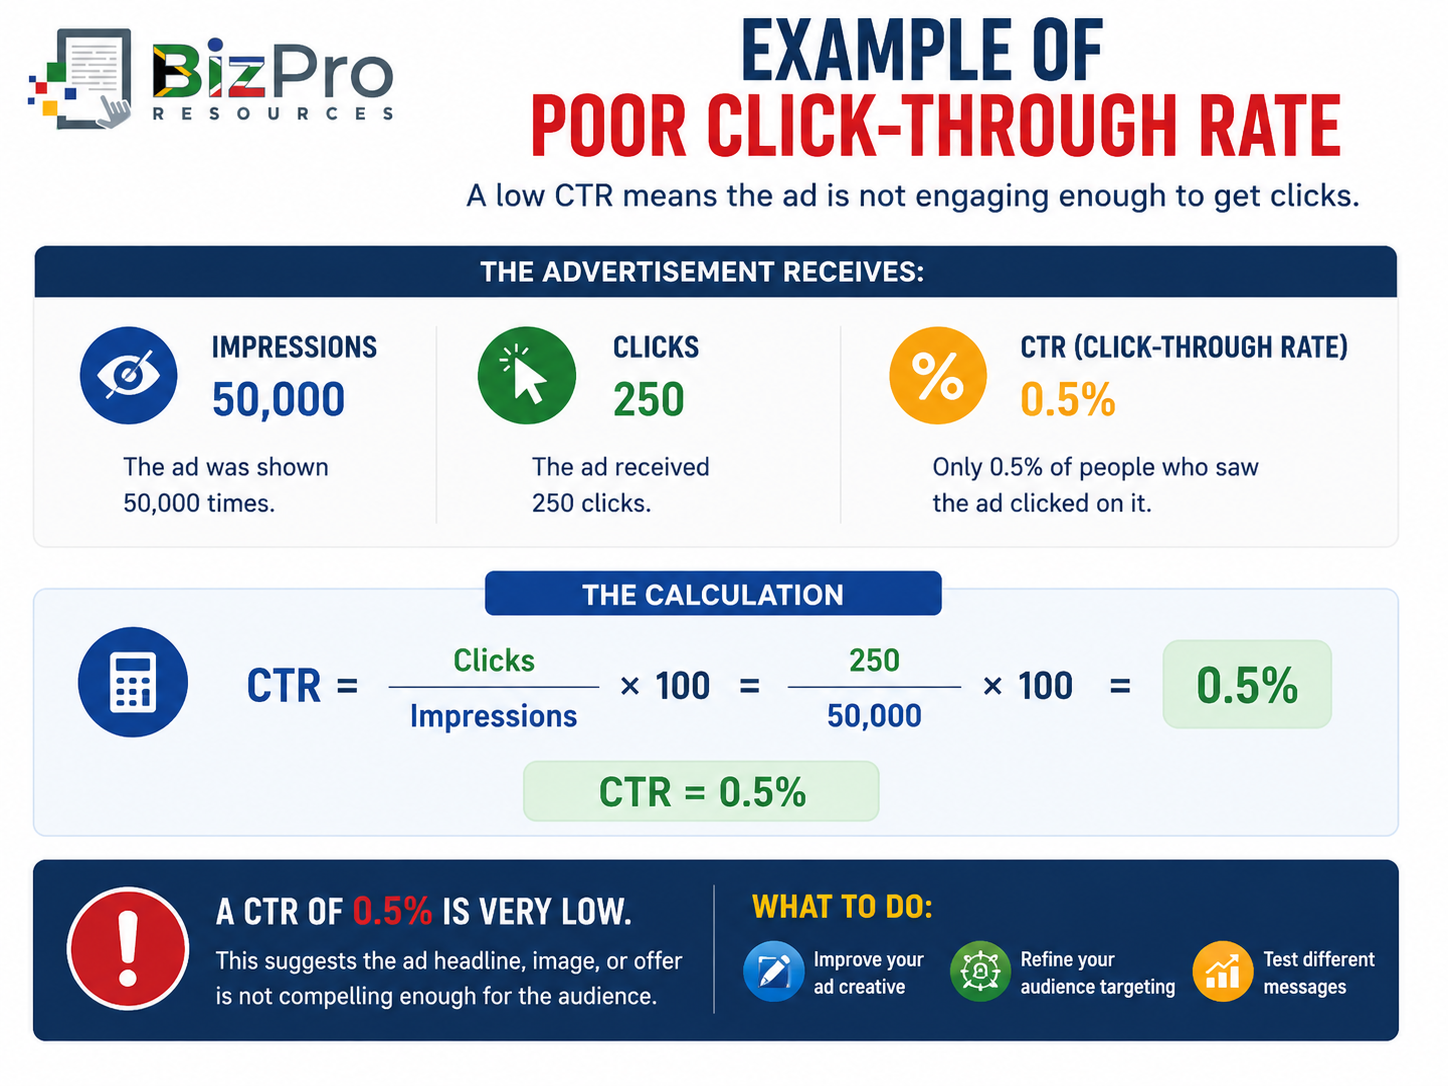
Assume similar campaigns from the business have historically generated CTRs of around 2%.
In this context, 0.5% indicates poor performance.
What Does Poor CTR Mean for the Company?
A low CTR suggests that people are seeing the marketing but relatively few are interested enough to click.
Possible reasons include:
The advertisement is not relevant.
The wrong audience is being targeted.
The headline is weak.
The image or video is ineffective.
The offer is unattractive.
The call-to-action is unclear.
Competitors have stronger offers.
People do not understand what is being advertised.
The advertisement has been shown too many times to the same audience.
The marketing message does not address an important customer need.
Poor CTR can also increase marketing costs on some advertising platforms because the business may be paying for large numbers of impressions that generate little traffic.
But low CTR should not automatically lead to changing the advertisement.
Management should first investigate whether the campaign objective and audience make the comparison meaningful.
Example of Good Click-Through Rate
The vehicle repair business changes the campaign.
It improves the headline from a generic message about vehicle servicing to a more specific offer: “Car Aircon Not Cooling? Book an Aircon Check Today.”
It also improves the image, targets motorists in the correct service area, and adds a clear booking button.
The next campaign receives:
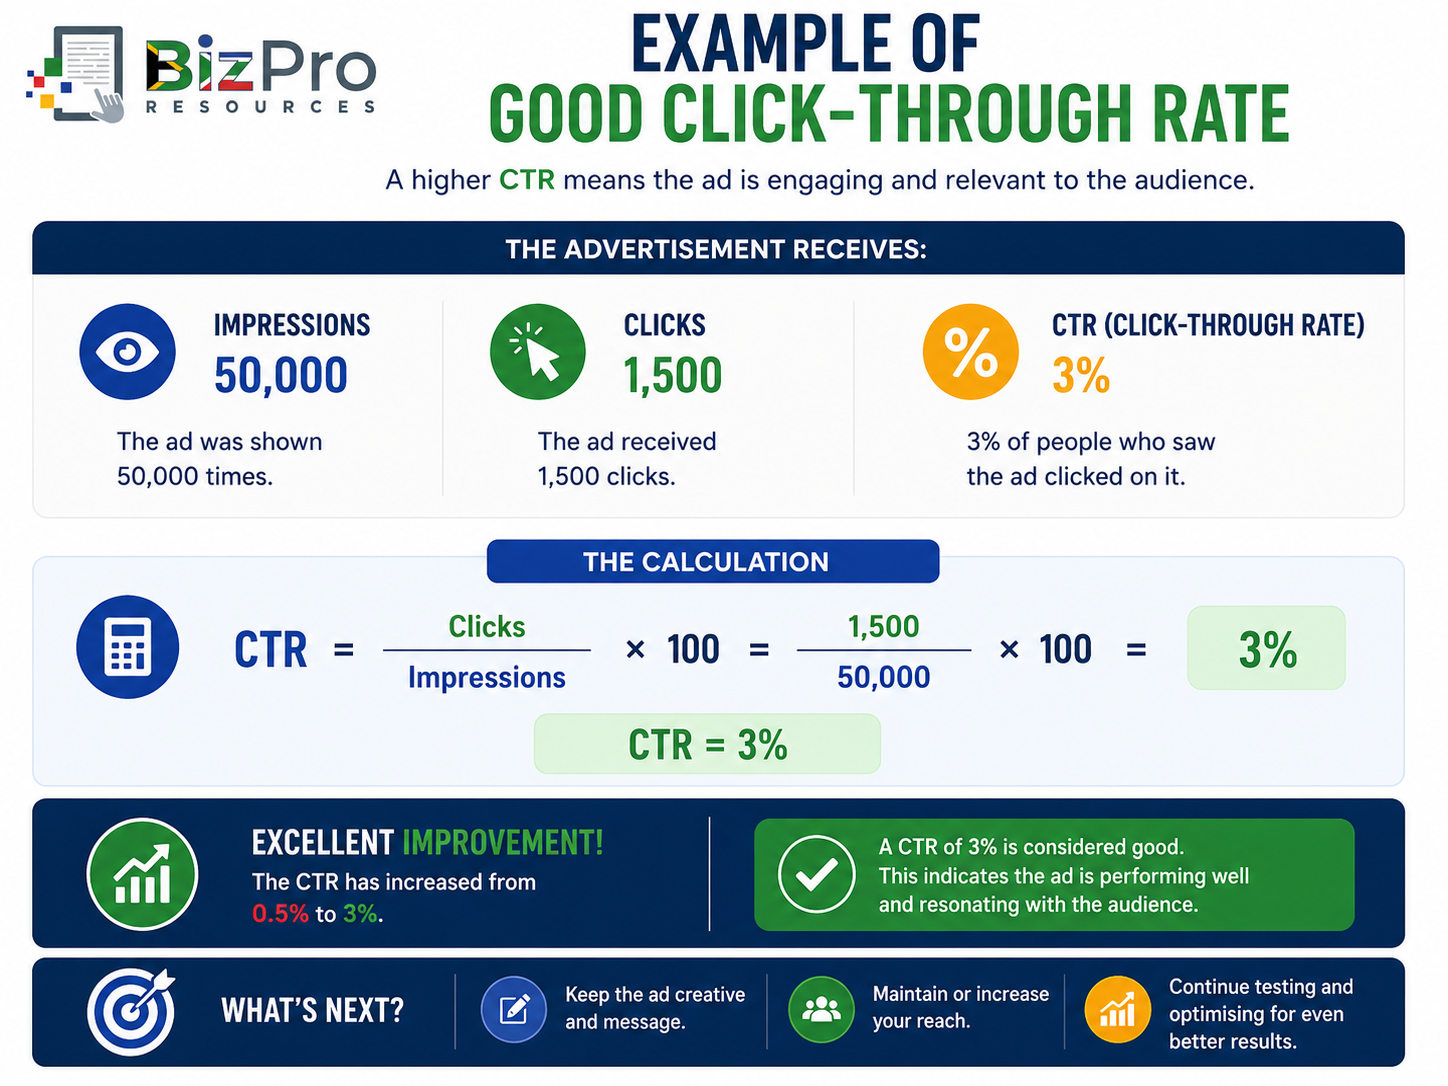
The calculation is: CTR = 1,500 ÷ 50,000 × 100 = 3%
The CTR has increased from 0.5% to 3%.
What Does Good CTR Mean for the Company?
The advertisement is now generating significantly more interest from the audience.
Previously: 50,000 impressions → 250 clicks
Now: 50,000 impressions → 1,500 clicks
The business receives six times more clicks from the same number of impressions.
This suggests that the combination of:
Audience
Message
Offer
Creative content
Call-to-action
is working more effectively.
However, high CTR does not automatically mean the campaign is profitable.
Those 1,500 visitors still need to:
Click → Engage → Enquire → Convert → Buy
CTR therefore measures an important early stage of marketing performance, not the final financial result.
Do Not Chase Clicks for the Sake of Clicks
A business can sometimes increase CTR using sensational or misleading messages.
For example: “You Won't Believe This Incredible Offer!”
That headline may attract clicks.
But if the landing page does not deliver what people expect, visitors may leave immediately.
This can produce: High CTR + Poor Conversion Rate
That is not successful marketing.
The objective is not simply to get people to click.
The objective is to get the right people to click for the right reason.
2. Bounce Rate
What Is Bounce Rate?
Bounce Rate is a website engagement metric used to indicate the proportion of visits or sessions that do not meet the analytics platform's criteria for meaningful engagement.
Historically, bounce rate was often explained simply as: The percentage of visitors who arrive on a page and leave without visiting another page or interacting further.
Modern analytics platforms can define engagement differently.
For example, a platform may consider factors such as:
How long the session lasted
Whether the visitor viewed more than one page
Whether a conversion occurred
Whether another defined engagement action took place
This means businesses should understand how their particular analytics system defines a bounce.
The underlying business question remains useful: “Are people arriving and then leaving without meaningfully engaging?”
How Is Bounce Rate Calculated?
A simplified formula is: Bounce Rate = Bounced Sessions ÷ Total Sessions × 100
Suppose a landing page receives 2,000 sessions.
Of those, 1,400 are classified as bounced sessions: Bounce Rate = 1,400 ÷ 2,000 × 100 = 70%
This means 70% of sessions met the analytics platform's definition of a bounce.
In some modern analytics systems, bounce rate may instead be calculated as the inverse of engagement rate: Bounce Rate = 100% − Engagement Rate
Because analytics definitions and software change, businesses should always confirm how their own platform calculates the metric.
Example of Poor Bounce Rate
Imagine an electrical contractor runs Google Ads promoting solar installations.
The advertisement sends visitors to a landing page.
The results are:
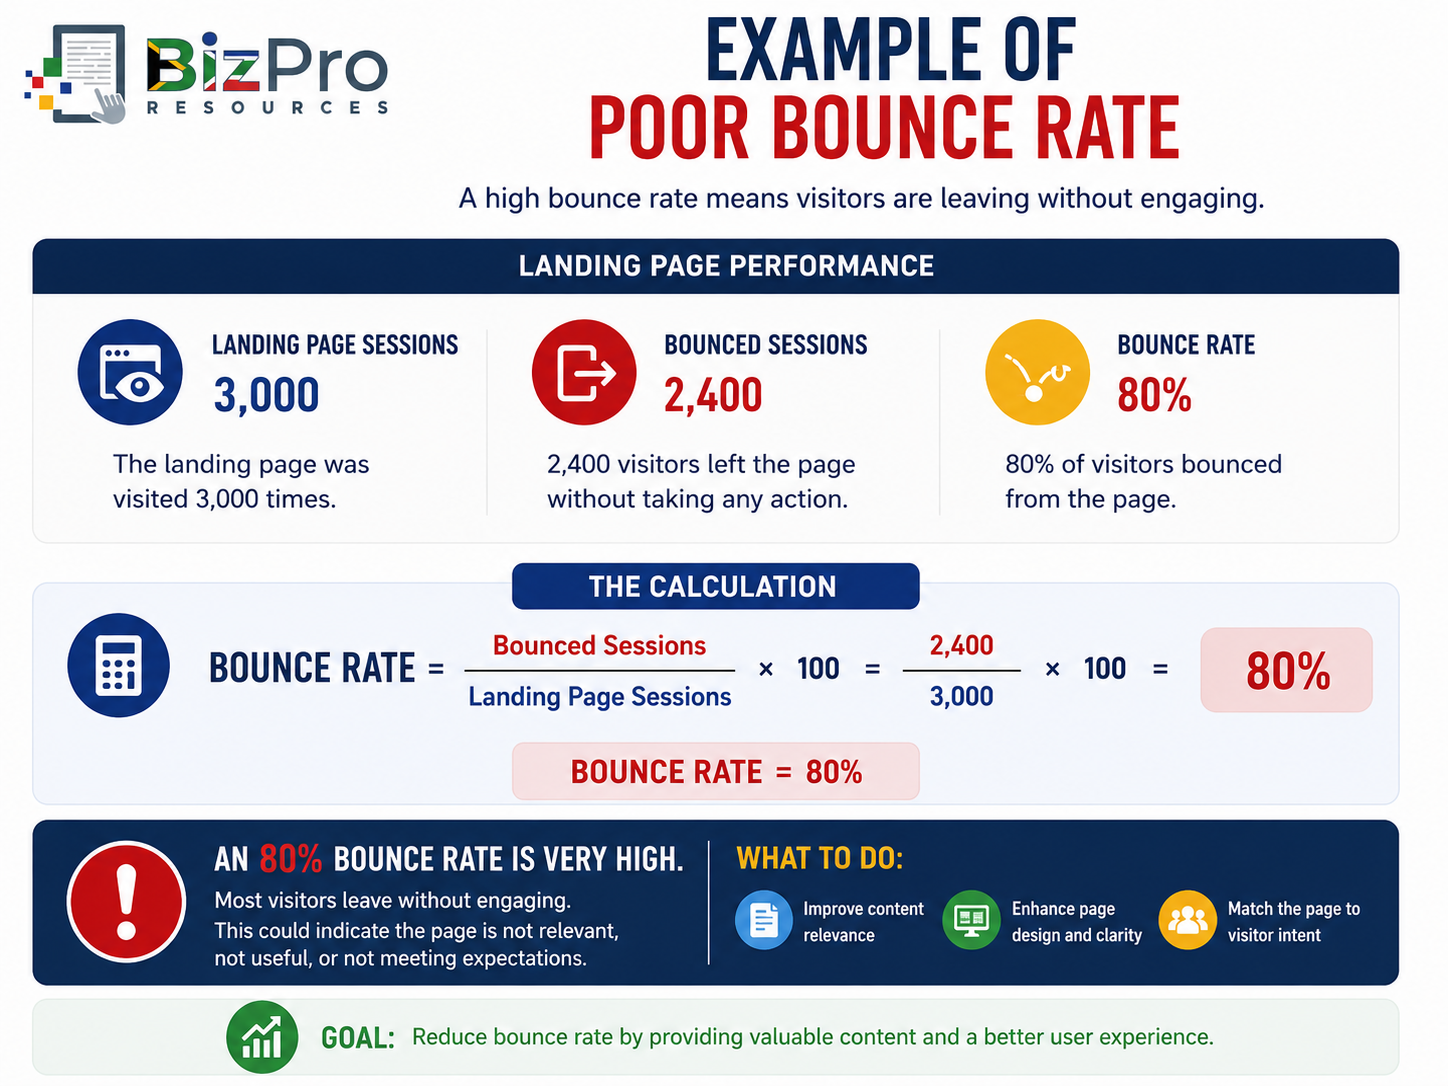
Assume the company's comparable high-performing landing pages normally have substantially lower bounce rates.
The 80% result therefore deserves investigation.
What Does Poor Bounce Rate Mean for the Company?
A high bounce rate may suggest that visitors arrive but quickly decide the page is not useful or relevant.
Possible causes include:
The page loads too slowly.
The website looks unprofessional.
The advertisement and landing page do not match.
The content is confusing.
The visitor cannot quickly find the information they need.
The website performs poorly on mobile devices.
There is no clear call-to-action.
Pricing or offers are unattractive.
The wrong audience is being sent to the page.
The page contains technical errors.
Visitors do not trust the business.
This can become expensive.
Suppose the electrical contractor paid R15 per click. It generated 3,000 visits.
Advertising cost would be: 3,000 × R15 = R45,000
If most visitors leave without meaningful engagement, a significant portion of that advertising expenditure may be producing little commercial value.
Example of Good Bounce Rate
The contractor improves the landing page:
Improves page speed.
Makes the site mobile-friendly.
Uses a clear solar installation headline.
Adds photographs of completed installations.
Explains the installation process.
Adds customer testimonials.
Displays financing information.
Includes a clear Request a Solar Assessment button.
Ensures the landing page closely matches the advertisement.
The next campaign produces:
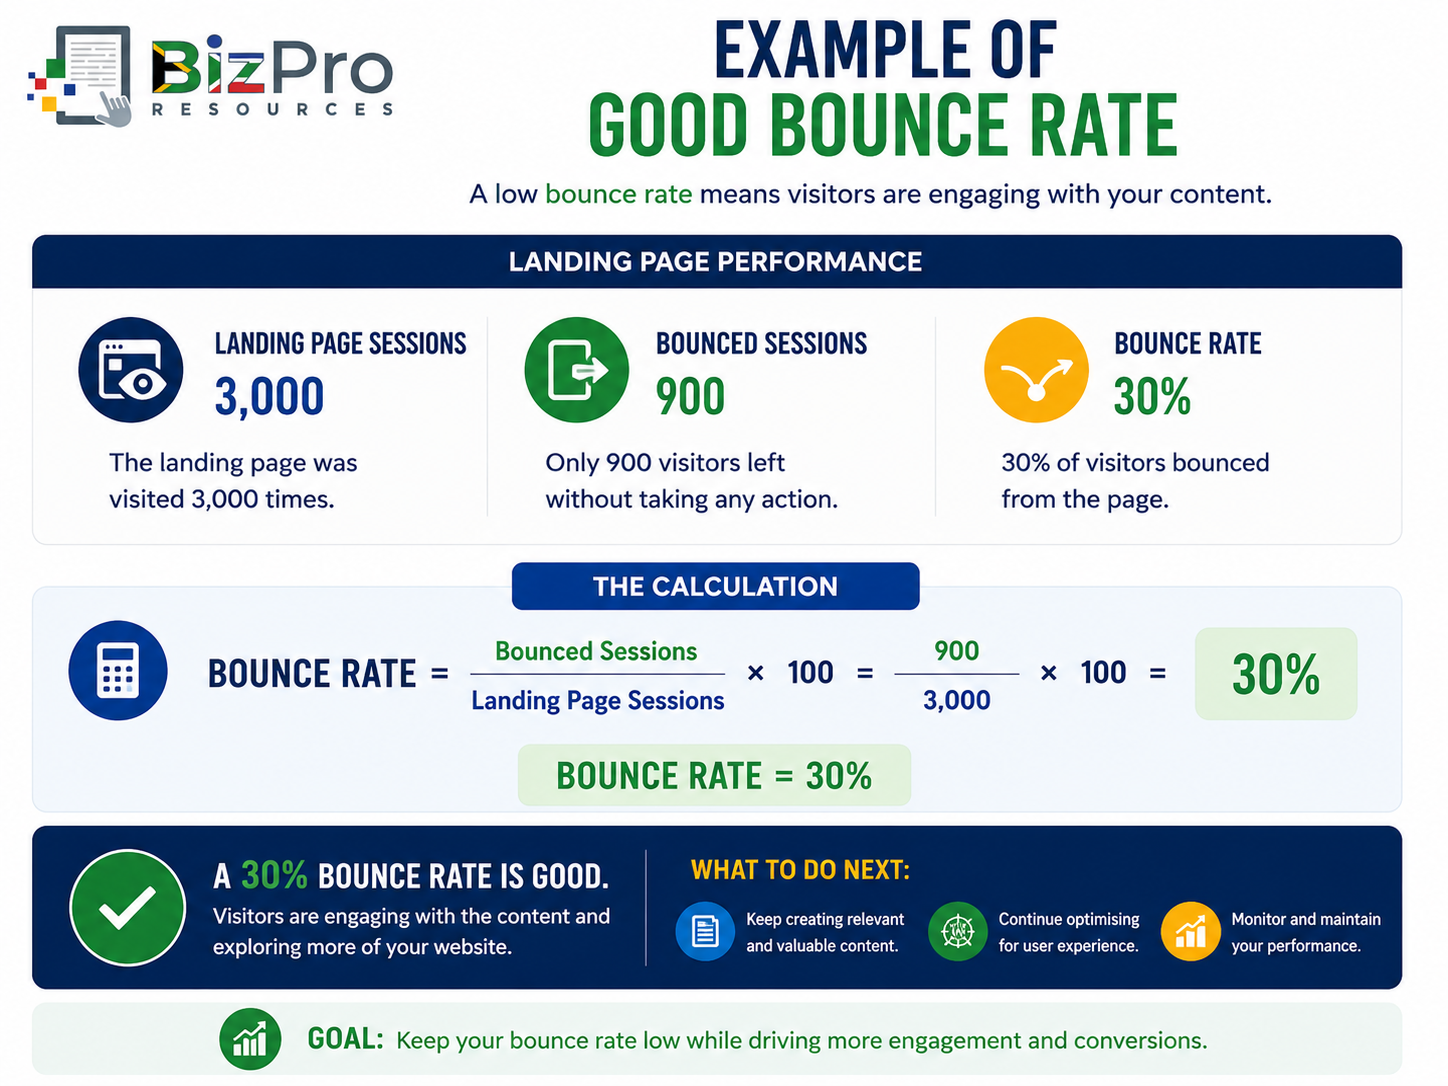
The calculation is: Bounce Rate = 900 ÷ 3,000 × 100 = 30%
What Does Good Bounce Rate Mean for the Company?
A lower bounce rate in this context suggests that more visitors are engaging with the page rather than immediately leaving.
This could indicate that:
Traffic is more relevant.
The page better matches visitor expectations.
Website usability has improved.
The offer is clearer.
Visitors trust the business more.
Calls-to-action are easier to find.
However, a low bounce rate should still not be treated as proof of business success. Visitors could interact with several pages and still never enquire or buy.
The business should therefore connect bounce rate with conversion metrics.
A High Bounce Rate Is Not Always Bad
Context matters.
Imagine a customer searches: “What time does ABC Plumbing open?” They arrive on the company's contact page, find the opening hours immediately, and leave.
Technically, that visit could sometimes appear as a bounce depending on the analytics system. But the page successfully answered the customer's question.
Similarly, a person might:
Read an entire blog article.
Find a telephone number.
Read a FAQ.
Get the information they need.
Then leave without viewing another page. That does not automatically mean the page failed.
This is why businesses should avoid using universal statements such as: “A high bounce rate always means your website is bad.” It does not.
Bounce rate must be interpreted according to:
Page purpose
Traffic source
Visitor intent
Analytics definition
Conversion behaviour
3. Engagement Rate
What Is Engagement Rate?
Engagement Rate measures how actively people interact with marketing content relative to the audience exposed to it.
It is commonly associated with social media, although engagement can also be measured on websites, email platforms, and other digital channels.
Social media engagement might include:
Likes
Comments
Shares
Saves
Reactions
Clicks
Replies
Different platforms may include different actions in their definition of engagement.
Engagement Rate helps answer: “Are people merely seeing our content, or are they actually interacting with it?”
This is useful because audience size alone can be misleading. A business with 100,000 followers may look impressive. But if only 50 people interact with each post, that audience may not be particularly engaged.
Another business with 5,000 followers and 500 interactions per post may have a much more responsive audience.
How Is Engagement Rate Calculated?
There are several ways to calculate Engagement Rate.
One common formula is: Engagement Rate = Total Engagements ÷ Total Reach × 100.
Suppose a social media post reaches 5,000 people.
It receives:
180 likes
30 comments
40 shares
50 saves
Total engagements are: 180 + 30 + 40 + 50 = 300
Therefore: Engagement Rate = 300 ÷ 5,000 × 100 = 6%
The post generated engagement equal to 6% of its reach under this calculation method.
Engagement Rate Can Be Calculated in Different Ways
Some businesses calculate engagement against followers: Engagement Rate by Followers = Total Engagements ÷ Total Followers × 100.
Others calculate it against reach: Engagement Rate by Reach = Total Engagements ÷ Reach × 100.
Some platforms may calculate it against impressions. These calculations can produce very different percentages.
For this reason, management should never compare engagement rates unless the same formula is being used.
A report should ideally state: Engagement Rate by Reach rather than simply: Engagement Rate
This makes the measurement clearer.
Example of Poor Engagement Rate
Imagine a small business consultancy has 20,000 social media followers.
A typical post reaches 10,000 people.
It receives:
30 likes
5 comments
5 shares
Total engagements: 30 + 5 + 5 = 40
Using reach: Engagement Rate = 40 ÷ 10,000 × 100 = 0.4%
Assume the company's previous educational posts regularly generated engagement rates of around 3% to 5%.
The current 0.4% result is therefore poor compared with its normal performance.
What Does Poor Engagement Rate Mean for the Company?
Low engagement may indicate:
Content is not relevant.
Posts are too promotional.
Content is repetitive.
The audience is poorly targeted.
Headlines are weak.
Visual content is ineffective.
Followers are no longer interested.
Content does not encourage interaction.
The business is posting at ineffective times.
The audience includes inactive or low-quality followers.
It may also indicate that the company has focused too much on increasing follower numbers rather than building a relevant audience.
A large audience that does not care about the company's content may have limited commercial value.
Example of Good Engagement Rate
The consultancy changes its content strategy. Instead of repeatedly posting: “Contact us for business consulting.”
it publishes practical content such as:
Cash flow tips
Staff management checklists
Pricing mistakes
Short business guides
Common tax questions
Customer service advice
Simple business templates
One post reaches 10,000 people and receives:
350 likes
80 comments
120 shares
50 saves
Total engagements: 350 + 80 + 120 + 50 = 600
Therefore: Engagement Rate = 600 ÷ 10,000 × 100 = 6%
What Does Good Engagement Rate Mean for the Company?
The content is generating a much stronger response from the audience.
This can indicate that people find it:
Relevant
Interesting
Helpful
Entertaining
Worth discussing
Worth saving
Worth sharing
Strong engagement can also help the business learn more about its audience.
Comments may reveal:
Common customer problems
Questions
Objections
Product ideas
Service problems
Content opportunities
Engagement therefore creates more than a marketing number.
It can create customer insight.
Not All Engagement Has Equal Value
Suppose two posts each generate 500 engagements:
Post A receives: 490 likes + 10 comments
Post B receives: 150 likes + 100 comments + 150 shares + 100 saves
Both have 500 total engagements.
But the behaviour is very different.
Shares may extend the reach of content.
Saves may indicate that people find the content valuable enough to revisit.
Comments may create conversation.
Clicks may move people toward a website or sales page.
Businesses should therefore look beyond the total engagement number and examine what type of engagement is occurring.
How CTR, Bounce Rate, and Engagement Rate Work Together
These three metrics measure different parts of audience behaviour.
CTR measures initial interest: Did the marketing persuade people to click?
Bounce Rate measures what happens after arrival: Did visitors remain meaningfully engaged, or did they leave without doing much?
Engagement Rate measures interaction: Did people actively respond to the content?
Consider a digital campaign:
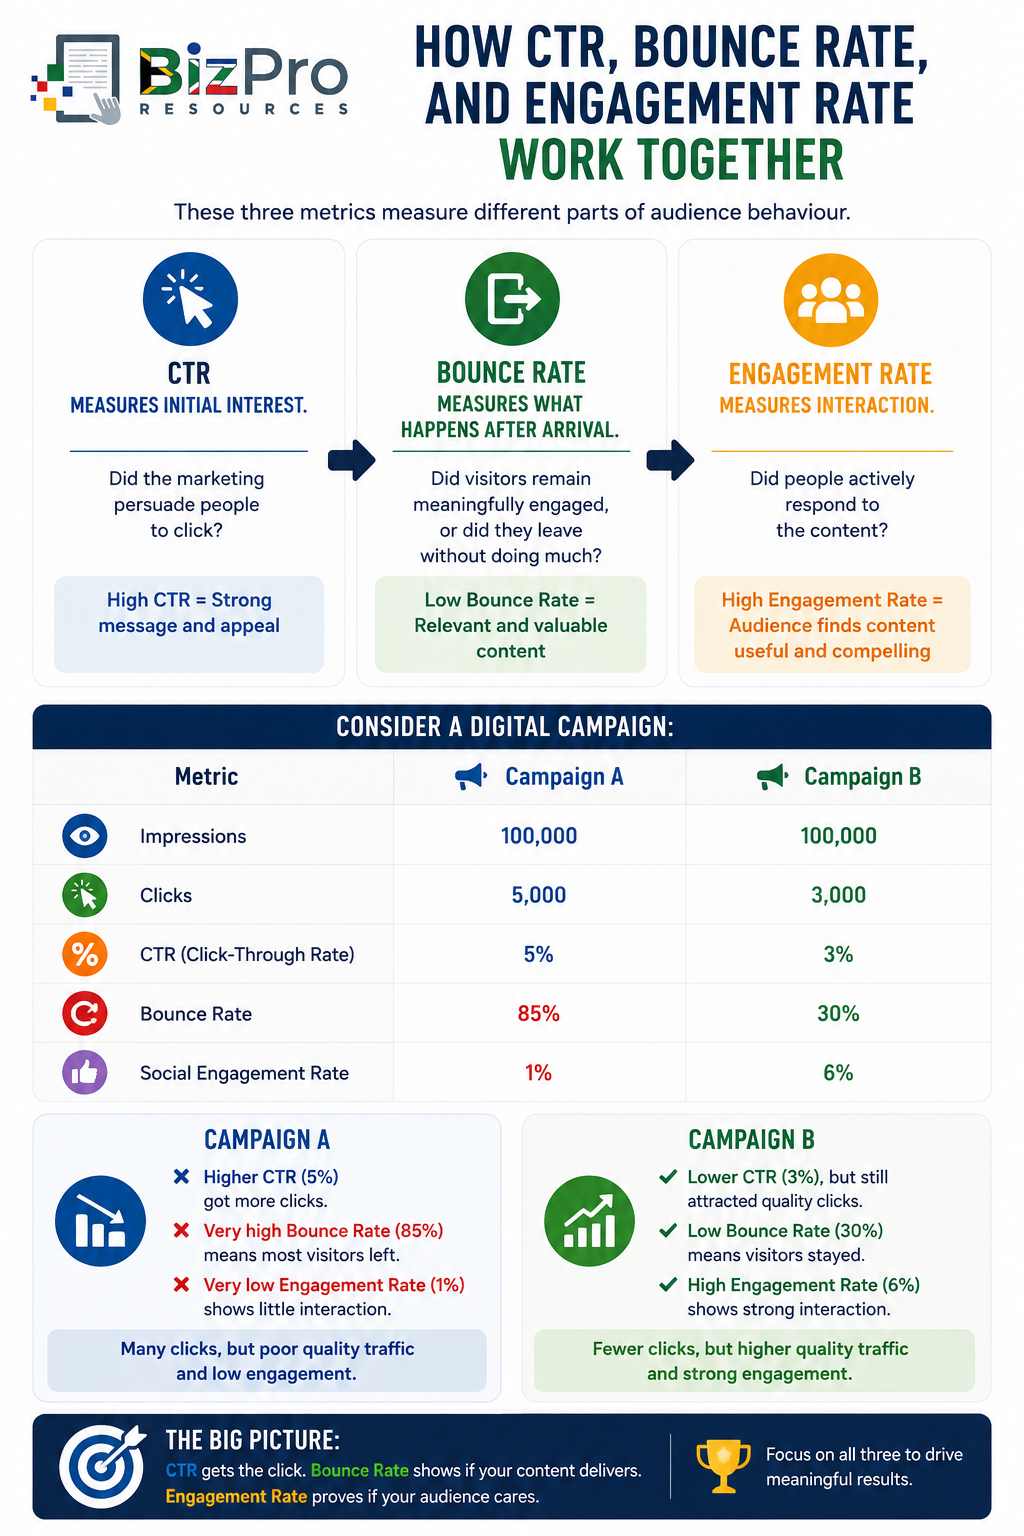
This should lead management to investigate the quality of the traffic, not simply the quantity.
Follow the Customer Journey
Traffic and engagement metrics become more useful when management views them as part of a sequence.
For example:
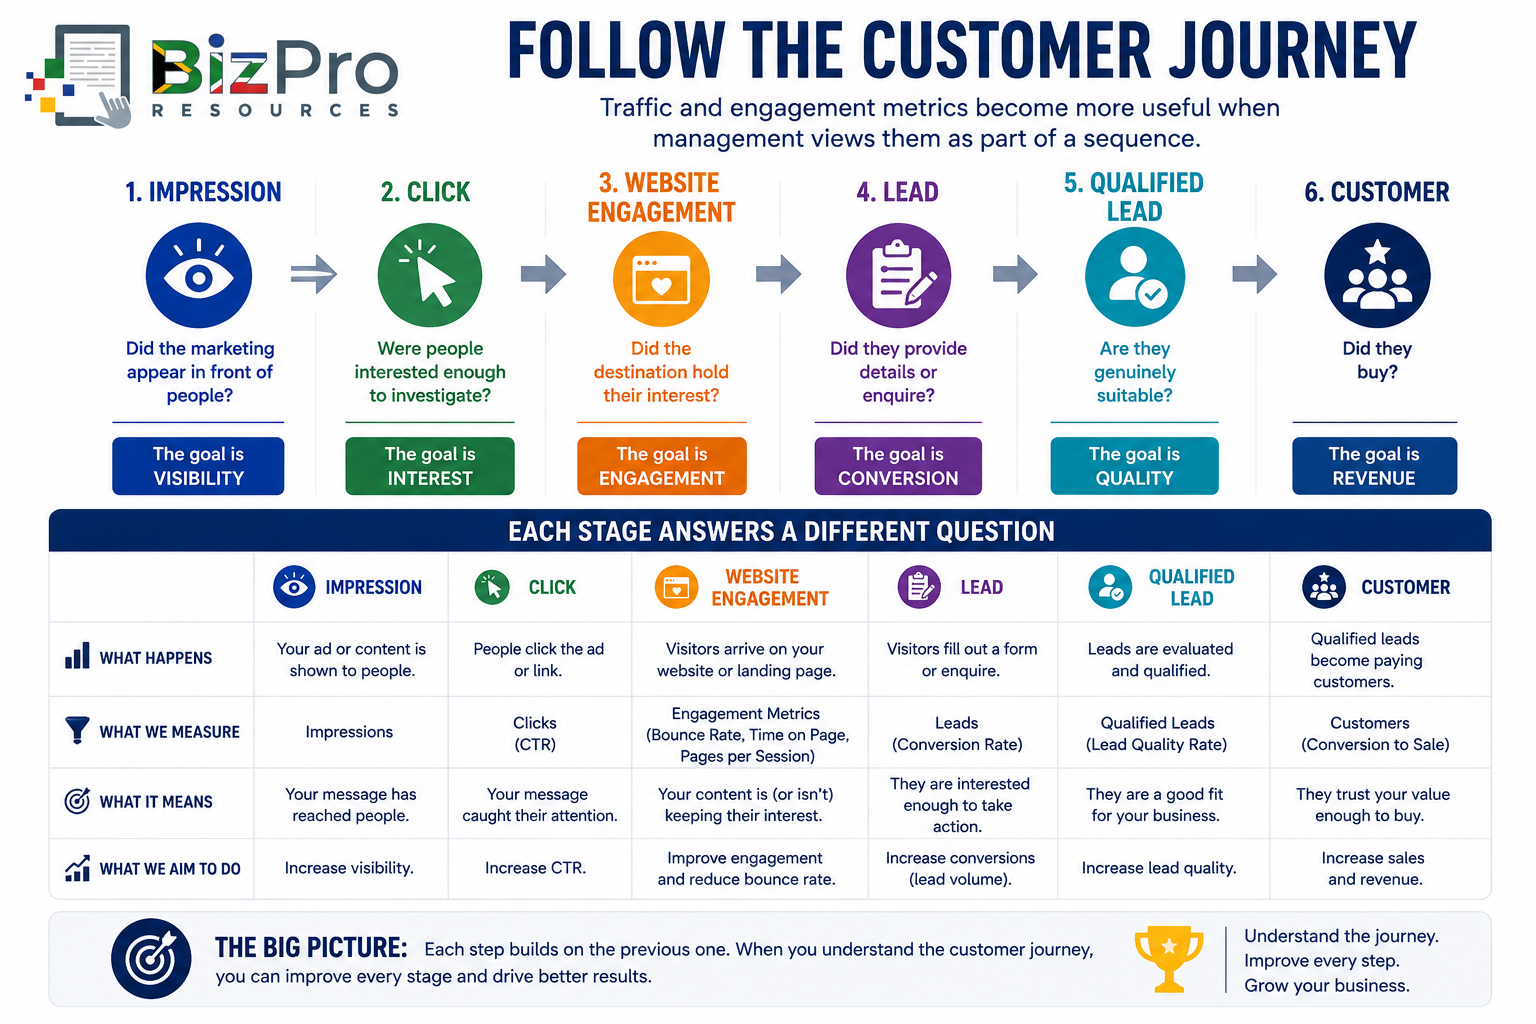
A strong marketing system should move enough of the right people through each stage.
Avoid Vanity Metrics
A vanity metric is a number that looks impressive but provides little useful information when viewed alone.
Examples can include:
Followers
Impressions
Page views
Likes
Video views
These metrics are not useless.
The problem occurs when they are presented without context.
For example: “We received one million impressions!”
Management should ask:
How many clicks?
How many engaged?
How many leads?
How many customers?
How much revenue?
A million impressions that produce no commercial value may be less useful than 10,000 impressions shown to highly relevant potential customers.
Segment Traffic and Engagement Metrics
A company-wide average can hide major differences. Suppose the overall website bounce rate is 50%.
When segmented by traffic source:
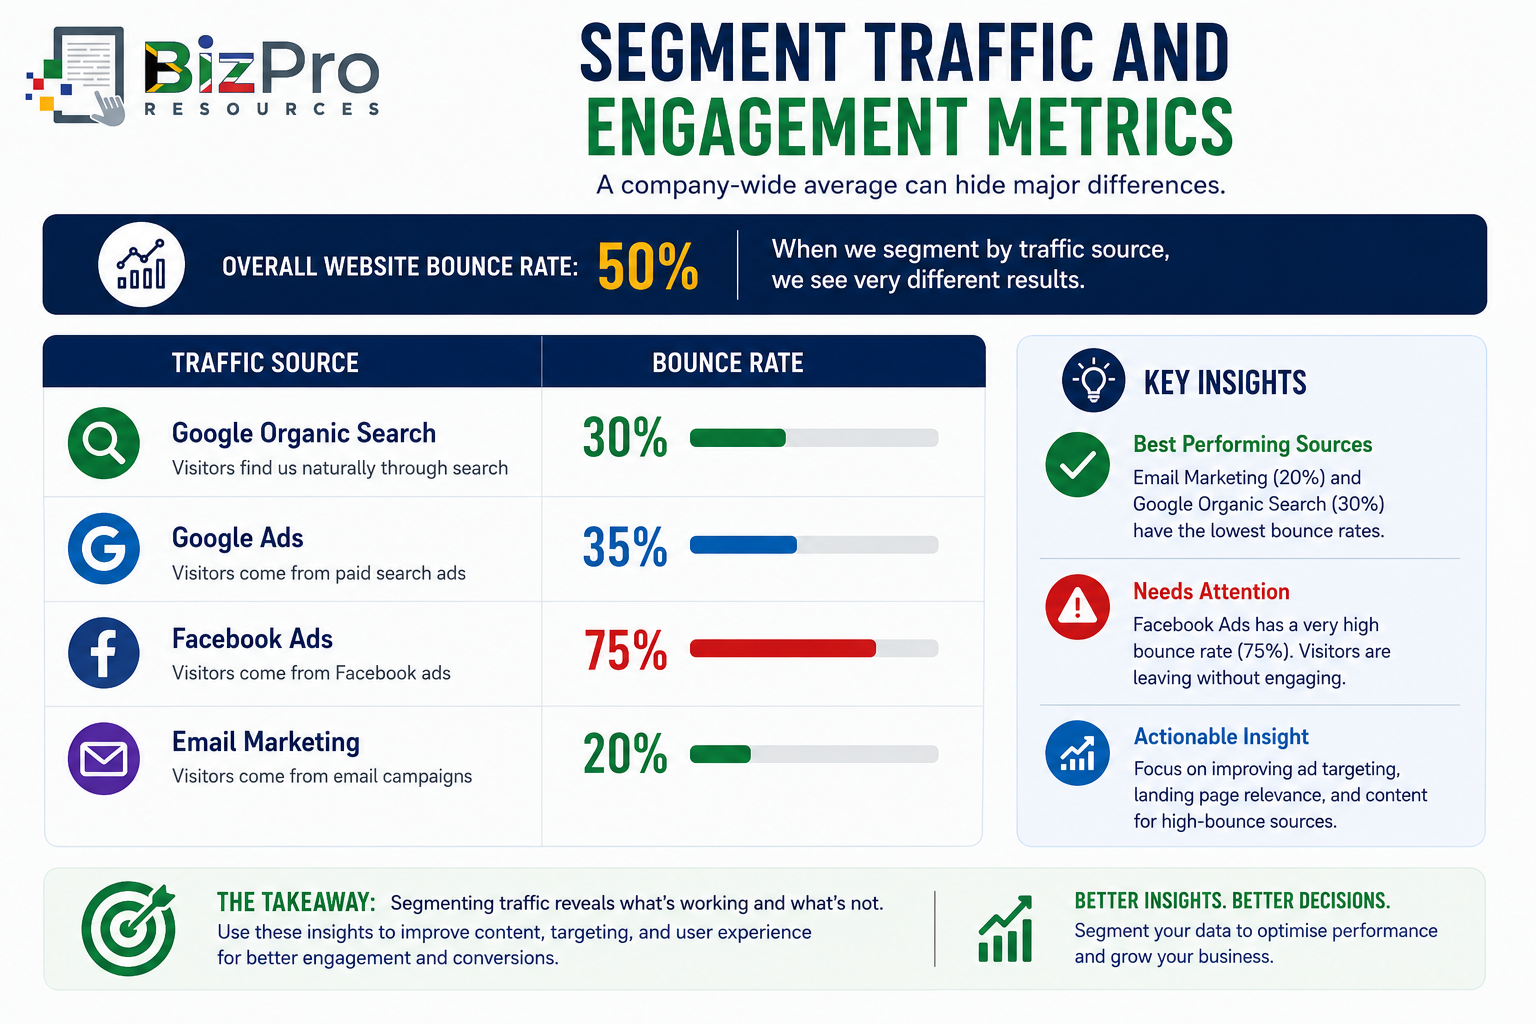
Now management can see where investigation is required. Facebook traffic appears to behave very differently from other traffic.
Possible explanations include:
Poor targeting
Misleading advertisements
Weak landing page alignment
Mobile usability problems
Different visitor intent
The same principle applies to CTR and Engagement Rate.
Businesses can segment metrics by:
Campaign
Advertisement
Marketing channel
Audience
Product
Service
Location
Device
Content type
Landing page
This helps management identify exactly what is working and what is not.
Build a Simple Traffic and Engagement Dashboard
A small business does not need a complicated analytics department to monitor these metrics.
A basic monthly dashboard might look like this:
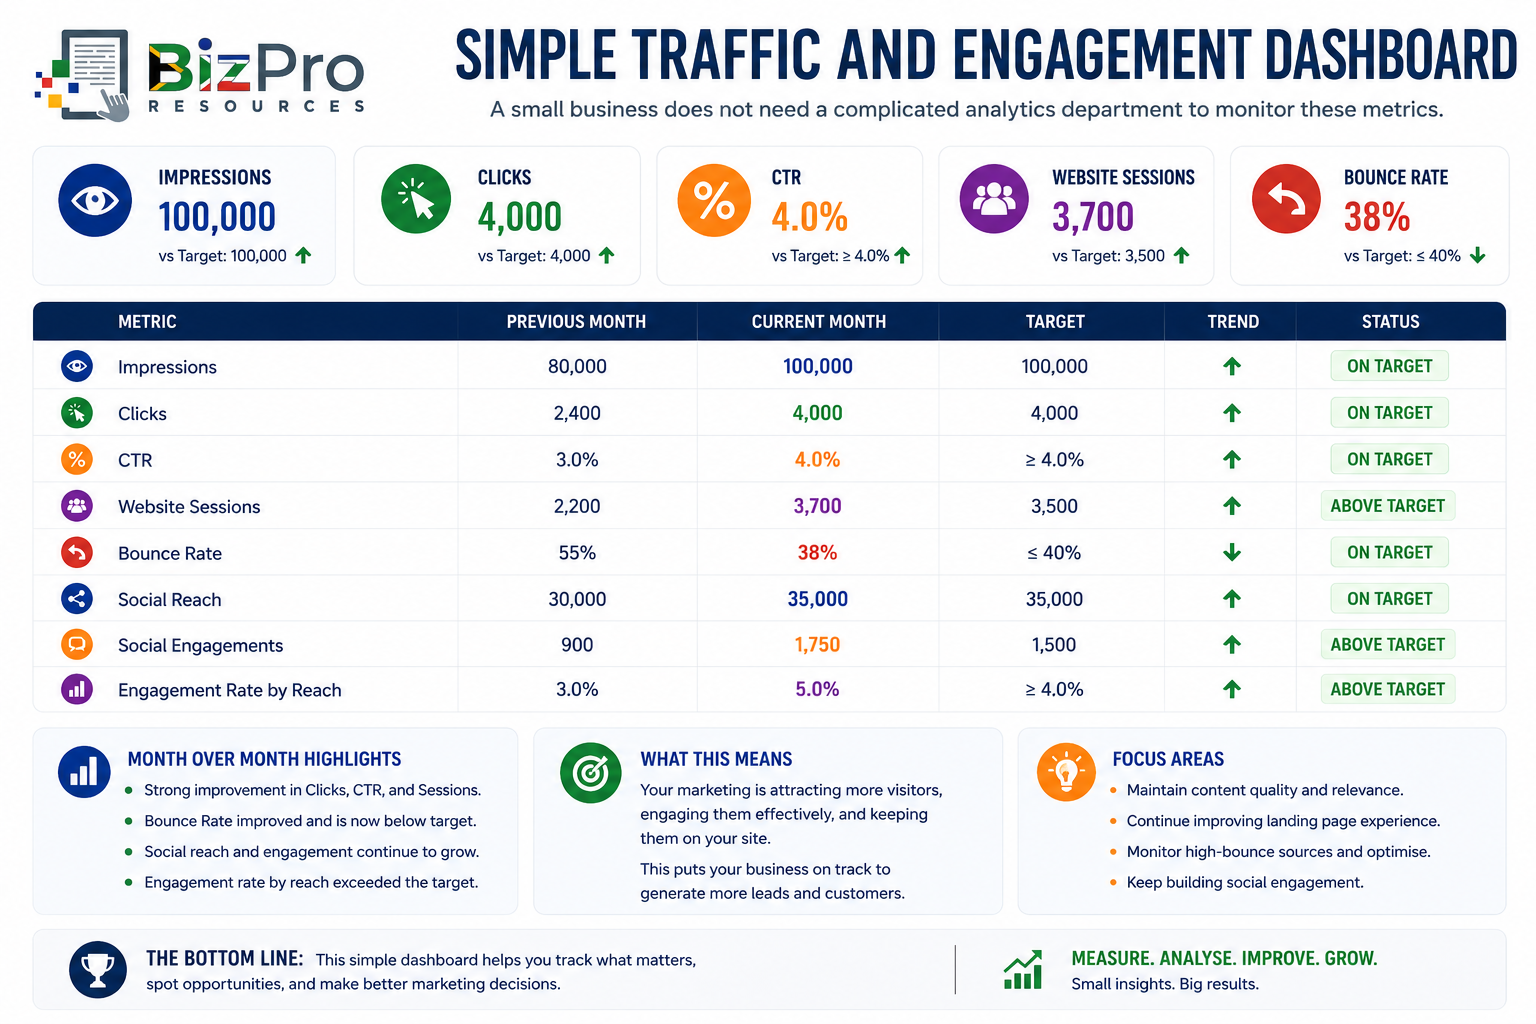
The dashboard should then lead to questions.
Why did CTR improve?
Why did Bounce Rate decrease?
Which posts produced the strongest engagement?
Which advertisements produced the weakest CTR?
Did better engagement eventually generate more leads and customers?
This is where metrics become management tools.
Do Not Compare Different Channels Blindly
A common mistake is comparing marketing metrics across completely different channels without considering how people use those channels.
For example, CTR on:
Google Search
Facebook
LinkedIn
Email
Display advertising
may differ substantially because user behaviour and intent are different.
Someone searching Google for: “Emergency plumber Pretoria” already has a specific problem.
Someone casually scrolling through Instagram may not currently need a plumber at all.
Their likelihood of clicking is naturally different.
Similarly, engagement behaviour differs between:
LinkedIn
Facebook
Instagram
TikTok
YouTube
Instead of asking: “Which platform has the highest number?”
ask: “Is this channel improving against its own historical performance, and is it contributing to our business objectives?”
What Does Good Traffic and Engagement Performance Look Like?
There is no universal CTR, Bounce Rate, or Engagement Rate that is appropriate for every business.
Performance depends on:
Industry
Marketing channel
Audience
Campaign objective
Content type
Product
Service
Price
Customer intent
Website design
Conversion objective
Healthy performance generally means:
CTR indicates relevant interest. The right people are clicking on marketing messages.
Bounce Rate is appropriate for the page and is not showing obvious signs of poor traffic quality or website problems.
Engagement Rate indicates that relevant audiences are interacting with content.
Most importantly, traffic and engagement should contribute to later outcomes.
Good engagement that never produces enquiries, customers, retention, or brand value deserves further investigation.
Turning Traffic and Engagement Metrics into Action
Metrics should result in action.
If CTR is poor, investigate:
Audience targeting
Headlines
Offers
Images
Videos
Calls-to-action
Advertisement relevance
If Bounce Rate is concerning, investigate:
Traffic quality
Page speed
Mobile usability
Landing page relevance
Website design
Content
Calls-to-action
Technical problems
If Engagement Rate is poor, investigate:
Content relevance
Audience quality
Content formats
Posting frequency
Topics
Visual quality
Calls for interaction
Then test improvements.
Measure again.
Compare the results.
Keep what works.
Change what does not.
Marketing performance should become a continuous cycle:
Measure → Investigate → Act → Measure Again
Final Thoughts
Traffic is useful.
Engagement is useful.
Clicks are useful.
But none of them should be confused with the final objective of the business.
A click is not a lead.
A lead is not necessarily a customer.
A customer is not necessarily profitable.
Traffic and engagement metrics therefore need to be viewed as part of the broader marketing measurement system:
Click-Through Rate tells you whether people are interested enough to click.
Bounce Rate helps you understand whether visitors meaningfully engage after arriving.
Engagement Rate tells you whether audiences actively interact with your content.
Together, these metrics help answer an important question: “Are people merely seeing our marketing, or are they actually responding to it?”
For a small business, the goal should not be to collect impressive digital numbers.
The goal should be to use those numbers to understand customer behaviour, improve marketing performance, and ultimately create more valuable business opportunities.
Because successful marketing is not simply about being seen.
It is about getting the right people to notice, respond, engage, and move closer to becoming customers.
Related Articles in the Marketing Performance Metrics Series
Marketing Financial Metrics: ROI, CAC, CLV, and ROAS Explained
Marketing Conversion and Lead Metrics: CVR, CPL, and MQL Explained
Marketing Traffic and Engagement Metrics: CTR, Bounce Rate, and Engagement Rate Explained
Social Media Metrics: Followers, Comments, Engagement Rate, and Video Views Explained
SEO Metrics: Page Views, CTR, Domain AUthority, Organic Traffic, and Keyword Rankings Explained
Email Marketing Metrics: CTOR, Engagement, Website Traffic, Bounce Rate, and CTR Explained
AI Disclaimer
AI Tools were used to assist with research. Remember to always cross-check everything that you read.


