
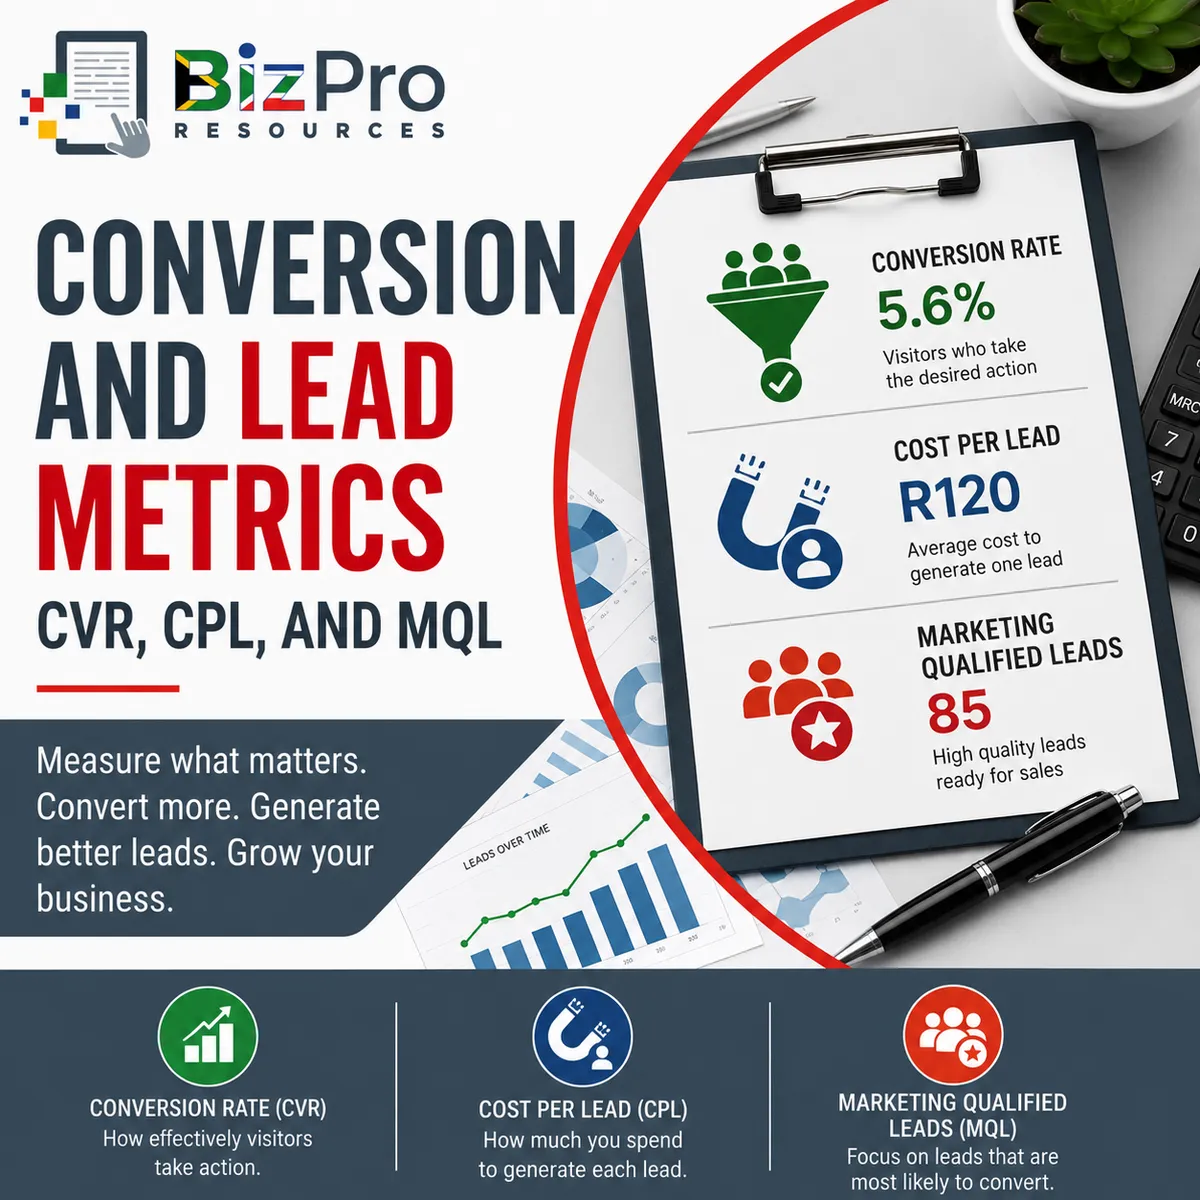
Marketing Conversion and Lead Metrics: CVR, CPL, and MQL Explained
Article #2 of #7 in the Marketing Performance Metrics Series
Introduction
Marketing does not end when someone sees an advertisement, visits a website, reads a social media post, or opens an email.
Those activities create attention.
The next challenge is turning that attention into action.
A potential customer might:
Complete an enquiry form.
Request a quotation.
Call the business.
Book a consultation.
Download a brochure.
Sign up for a trial.
Register for a webinar.
Subscribe to an email list.
Ask a salesperson to contact them.
These actions move people closer to becoming customers.
For a small business, measuring this movement is extremely important. A company could attract thousands of website visitors every month and still generate very little business if almost nobody takes the next step.
This is where conversion and lead metrics become useful.
Three particularly important metrics are:
Conversion Rate (CVR)
Cost Per Lead (CPL)
Marketing Qualified Leads (MQL)
Together, these metrics help answer three practical questions:
Conversion Rate: What percentage of people take the action we want them to take?
Cost Per Lead: How much are we spending to generate each lead?
Marketing Qualified Leads: How many of our leads appear genuinely suitable and ready enough to move closer to the sales process?
These metrics help a business move beyond simply asking: “How many people did our marketing reach?”
Instead, management can ask: “How effectively are we turning that attention into genuine sales opportunities?”
1. Conversion Rate (CVR)
What Is Conversion Rate?
Conversion Rate, often abbreviated as CVR, measures the percentage of people who complete a desired action.
A conversion does not always mean a sale.
The business decides what action counts as a conversion based on the objective of the marketing activity.
For example, a conversion could be:
Completing an online enquiry form
Requesting a quotation
Calling the company
Booking an appointment
Making an online purchase
Creating an account
Signing up for a free trial
Downloading a guide
Joining a mailing list
Registering for an event
Suppose a plumbing company runs Google Ads:
The advertisement sends 1,000 people to a landing page.
Of those visitors, 50 request quotations.
The business has generated 50 conversions from 1,000 visitors.
Conversion Rate tells management how effectively the landing page and marketing process converted those visitors into enquiries.
How Is Conversion Rate Calculated?
The basic formula is: Conversion Rate = Number of Conversions ÷ Total Number of Visitors or Opportunities × 100
Using the plumbing example:
Website Visitors = 1,000
Quotation Requests = 50
Therefore: CVR = 50 ÷ 1,000 × 100 = 5%
The landing page therefore has a 5% conversion rate.
In practical terms, five out of every 100 visitors completed the desired action.
Define the Conversion Clearly
Before measuring CVR, the business must clearly define what counts as a conversion.
Consider an accounting practice. Its website receives 2,000 visitors.
During the month:
200 download a tax guide.
80 subscribe to the newsletter.
50 request a consultation.
20 become paying clients.
Which number should be used?
It depends on what the business is measuring:
The guide download conversion rate is: 200 ÷ 2,000 × 100 = 10%
The consultation conversion rate is: 50 ÷ 2,000 × 100 = 2.5%
The customer conversion rate is: 20 ÷ 2,000 × 100 = 1%
All three numbers are correct. They simply measure different stages of the customer journey. For this reason, management should always label conversion rates clearly.
Instead of reporting: “Our conversion rate is 5%.”
A better report would say: “Our website visitor-to-quotation conversion rate is 5%.”
That removes ambiguity.
Example of Poor Conversion Rate
Imagine a Johannesburg security company runs a digital campaign promoting CCTV installations.
During one month:
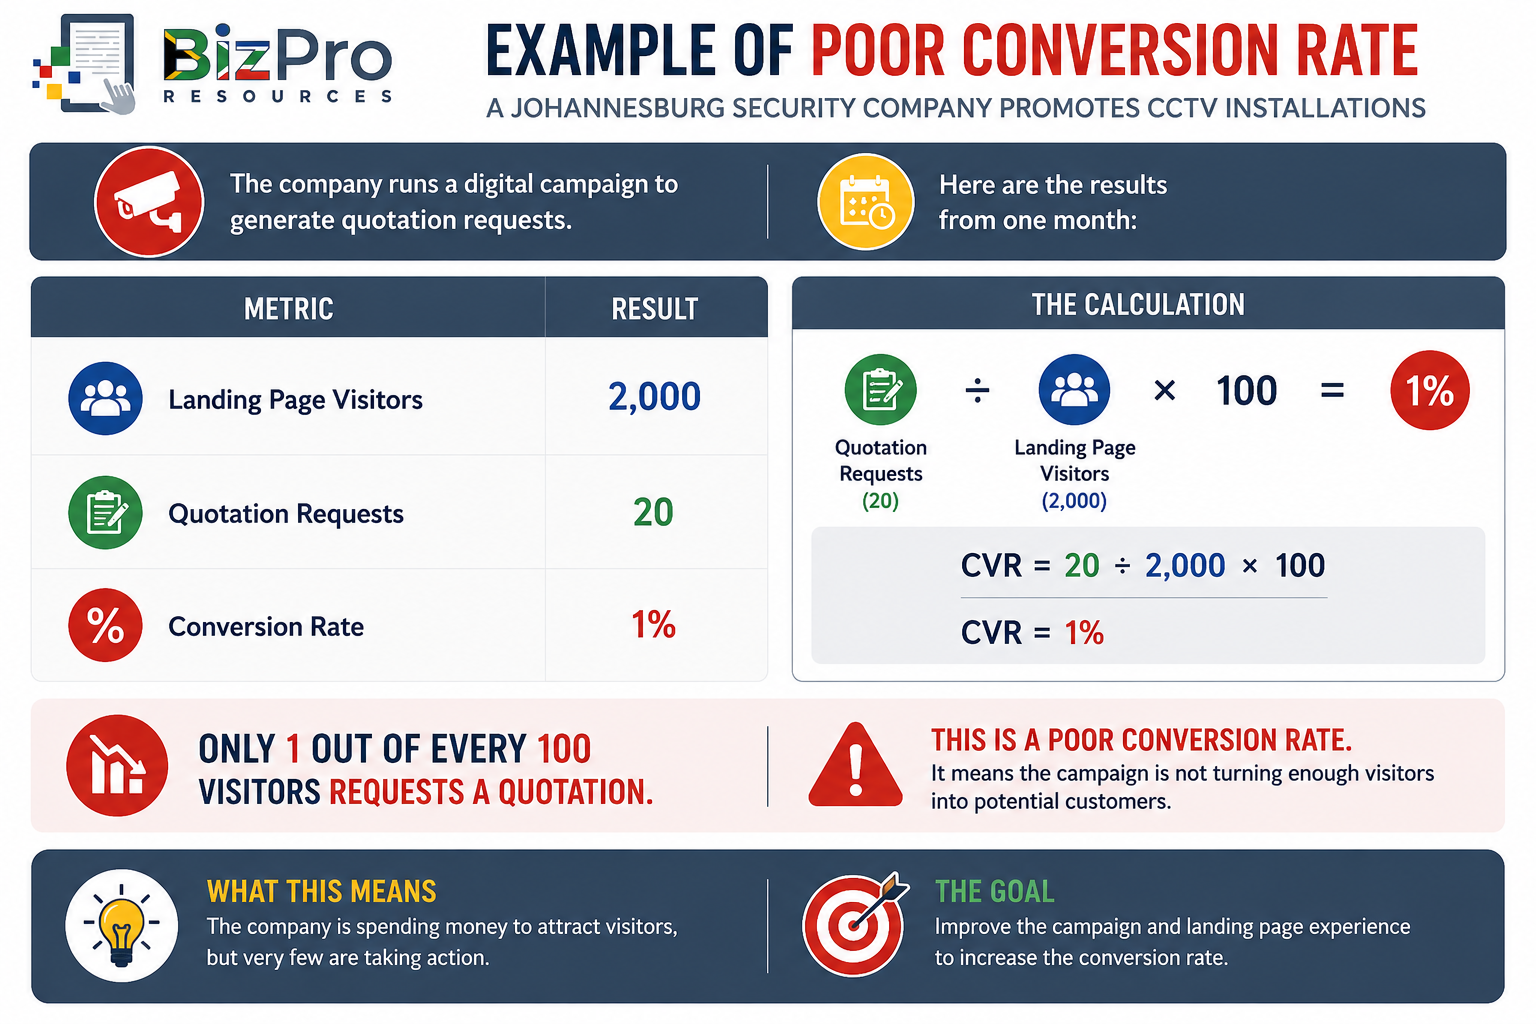
Whether 1% is objectively poor depends on the industry, offer, traffic source, and type of conversion. However, assume the company's historical performance for comparable campaigns is around 4%.
In this context, 1% represents poor performance.
What Does Poor Conversion Rate Mean for the Company?
A low conversion rate indicates that the business is attracting people but struggling to persuade them to take the next step.
There could be many reasons:
The advertisement may be attracting the wrong audience.
The landing page may be confusing.
The quotation form may be too long.
The offer may not be attractive.
Pricing may appear too expensive.
The website may look unprofessional.
The website may load slowly.
The call-to-action may be unclear.
Visitors may not trust the company.
The site may not display properly on mobile phones.
The advertisement may promise something that the landing page does not deliver.
Poor conversion can also make otherwise successful marketing extremely expensive.
Suppose the security company spends R20,000 to attract those 2,000 visitors. If only 20 become leads, the company has effectively spent: R20,000 ÷ 20 = R1,000 per lead.
Now imagine the business improves its conversion rate without increasing advertising expenditure.
That could dramatically change the economics of the campaign.
Example of Good Conversion Rate
The security company redesigns the landing page:
Makes the quotation button more visible.
Reduces the number of form fields.
Adds customer testimonials.
Clearly explains the installation process.
Adds photographs of completed projects.
Displays relevant credentials.
Improves mobile usability.
Makes the offer clearer.
The next month, the landing page receives the same 2,000 visitors.
This time, 100 request quotations: CVR = 100 ÷ 2,000 × 100 = 5%.
The visitor-to-quotation conversion rate has increased from 1% to 5%.
What Does Good Conversion Rate Mean for the Company?
The business is now extracting significantly more value from the same amount of traffic.
Previously: 2,000 visitors → 20 leads
Now: 2,000 visitors → 100 leads
The company did not need five times more website traffic. It simply became better at converting the traffic it already had.
This demonstrates an important marketing principle: Sometimes improving conversion is more valuable than increasing traffic.
Businesses frequently focus on attracting more people when the real problem is that existing visitors are not converting.
Track Conversion Rates Through the Entire Funnel
Conversion does not happen only once. A customer often moves through several stages.
For example:
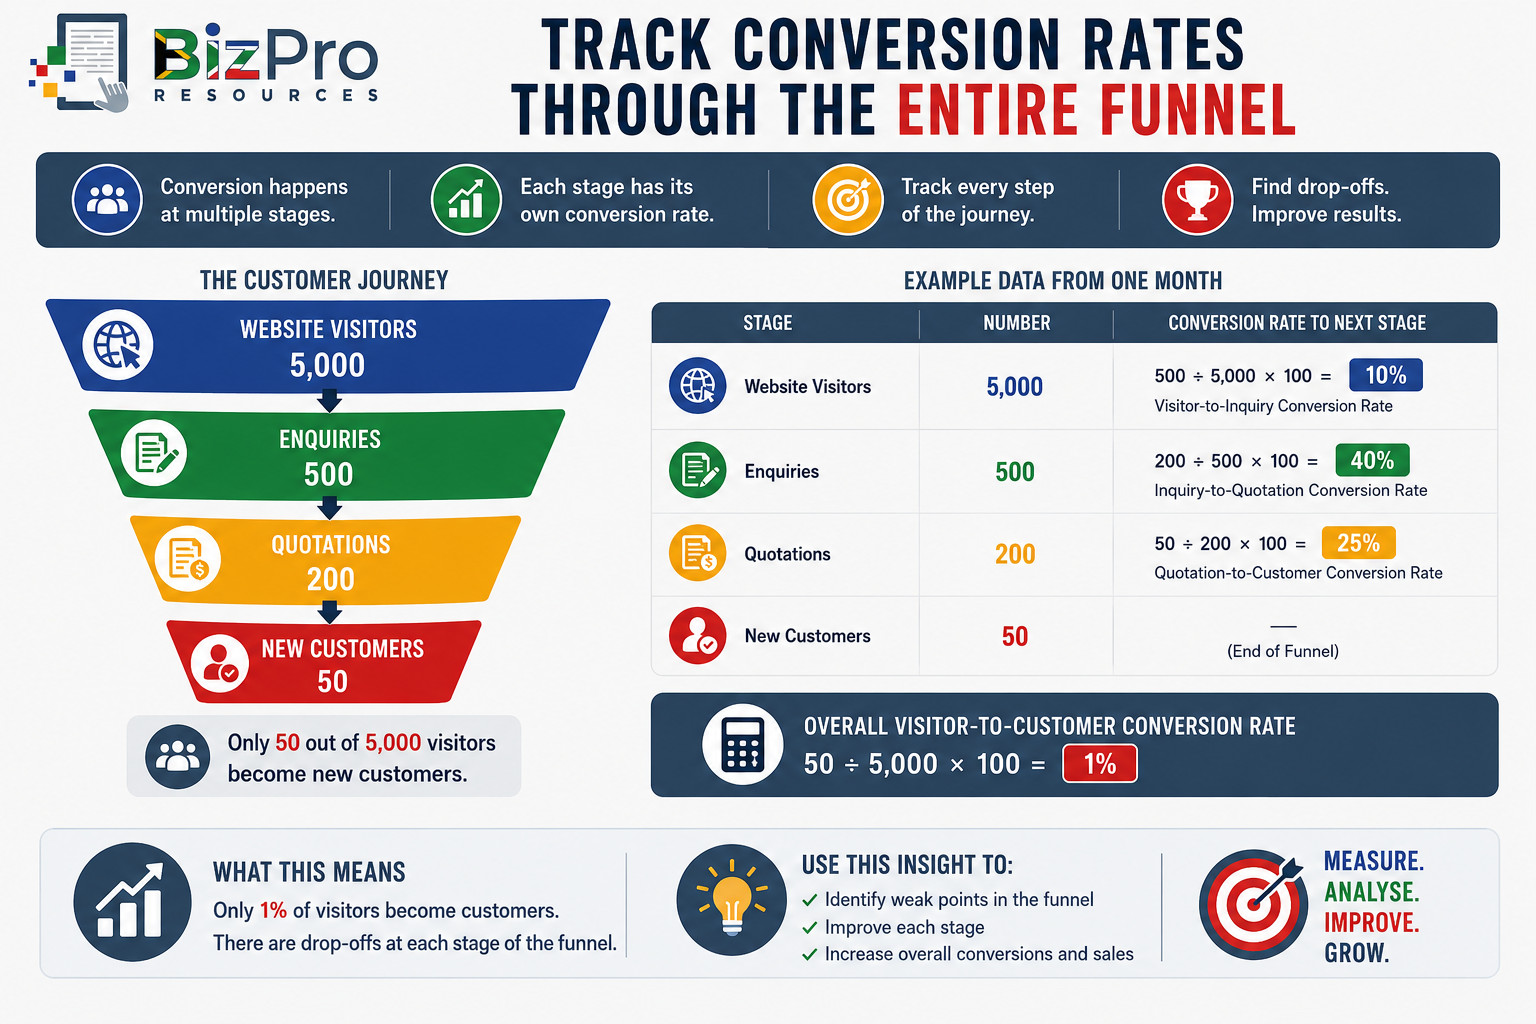
This gives management much more information than one overall conversion number.
It helps identify where potential customers are being lost.
2. Cost Per Lead (CPL)
What Is Cost Per Lead?
Cost Per Lead, or CPL, measures how much marketing expenditure is required to generate one lead.
A lead is generally a person or organisation that has shown enough interest to provide contact details or make an enquiry.
Examples include someone who:
Requests a quotation.
Completes a contact form.
Calls after seeing an advertisement.
Requests a product demonstration.
Books a consultation.
Provides their details for a sales call.
Registers interest in a service.
CPL answers: “How much are we paying to generate each potential sales opportunity?”
This is different from Customer Acquisition Cost (CAC).
CPL measures the cost of generating a lead.
CAC measures the cost of acquiring a customer.
Not every lead becomes a customer. That distinction is extremely important.
How Is Cost Per Lead Calculated?
The basic formula is: CPL = Marketing Spend ÷ Number of Leads Generated
Suppose an electrical contractor spends R15,000 on a Google Ads campaign.
The campaign generates 100 enquiries: CPL = R15,000 ÷ 100 = R150.
The company therefore paid an average of R150 per lead.
Be Consistent About Which Costs Are Included
Businesses should decide what expenditure is included in the CPL calculation.
A simple campaign-level calculation might include only advertising spend.
A broader calculation might include:
Advertising spend
Agency fees
Creative production
Landing page costs
Marketing software
Lead generation fees
Neither approach is automatically wrong.
The important issue is consistency.
If management compares one campaign using only advertising spend with another campaign using advertising plus agency and production costs, the comparison may be misleading.
Example of Poor CPL
Imagine a legal practice runs a digital campaign aimed at small businesses needing commercial legal services.
The campaign costs R30,000. It generates 20 leads: CPL = R30,000 ÷ 20 = R1,500 per lead.
Again, R1,500 is not automatically good or bad. The business needs context.
Suppose historically it generates comparable qualified leads for around R500.
The current R1,500 CPL is therefore a serious deterioration.
Worse, assume many of the 20 enquiries are unsuitable:
People looking for free legal advice
Consumers rather than businesses
People outside the firm's service area
Enquiries about services the firm does not offer
The company is therefore paying a high price for poor-quality leads.
What Does Poor CPL Mean for the Company?
High CPL may indicate:
Advertising costs are too high.
Conversion rates are too low.
Targeting is too broad.
The offer is weak.
Competition for advertising space is high.
The landing page performs poorly.
The campaign generates insufficient leads.
The business is using an inefficient marketing channel.
A rising CPL can eventually cause CAC to rise as well.
Suppose leads cost R1,500 each and only one out of five becomes a customer.
Ignoring other acquisition costs: 5 leads × R1,500 = R7,500.
The business is effectively spending R7,500 in lead-generation advertising to acquire one customer.
If the customer only creates R4,000 in economic value, the acquisition process is unsustainable.
Example of Good CPL
The legal practice improves its campaign:
It narrows the audience to established small businesses in its target region.
It improves advertising copy.
It creates a landing page specifically for commercial legal services.
It also adds a short qualifying question to the enquiry form.
The next campaign costs R30,000 again.
This time, it generates 75 leads: CPL = R30,000 ÷ 75 = R400 per lead.
CPL has fallen from R1,500 to R400.
What Does Good CPL Mean for the Company?
The company is now generating substantially more leads from the same marketing expenditure.
Previously: R30,000 → 20 leads
Now: R30,000 → 75 leads
If lead quality remains strong, the campaign has become significantly more efficient.
But there is an important warning: Cheap leads are not automatically good leads.
A campaign generating 1,000 leads at R20 each may be worse than a campaign generating 100 leads at R200 each if almost none of the cheap leads are genuine prospects.
That brings us to the third metric.
3. Marketing Qualified Leads (MQL)
What Is a Marketing Qualified Lead?
A Marketing Qualified Lead, commonly called an MQL, is a lead that meets defined criteria indicating that they are more likely than an ordinary lead to become a genuine sales opportunity.
Not every person who provides contact details deserves immediate attention from the sales team.
Consider a company that sells commercial solar installations.
It receives 100 online enquiries.
Among them are:
Homeowners looking for small residential systems
Students researching solar power
Suppliers trying to sell equipment
People asking for jobs
Businesses wanting quotations
Factory owners investigating large installations
All 100 may technically be recorded as leads. But they are not equally valuable. The business therefore needs a way to identify which leads deserve further attention.
That is the purpose of marketing qualification.
How Are Marketing Qualified Leads Calculated?
MQL is primarily a count, rather than a financial ratio:
The business first establishes qualification criteria.
It then counts how many leads meet those criteria.
For example:
Total Leads = 200
Leads Meeting MQL Criteria = 60
Therefore: MQLs = 60
The business generated 60 Marketing Qualified Leads.
Management can also calculate the percentage of total leads that become MQLs.
This can be called the Lead-to-MQL Conversion Rate: Lead-to-MQL Conversion Rate = MQLs ÷ Total Leads × 100
Using the example: 60 ÷ 200 × 100 = 30%
Thirty percent of the leads generated were marketing qualified.
How Does a Business Decide What Counts as an MQL?
There is no universal definition. Each business needs qualification criteria suited to its own sales process.
For a B2B IT company, an MQL might need to:
Work for a business in the target market.
Be located within the service area.
Require one of the company's services.
Have a minimum number of employees.
Provide a business email address.
Request a consultation or quotation.
For an accounting practice, criteria might include:
Registered business owner
Within the firm's target turnover range
Needs bookkeeping, payroll, tax, or accounting services
Located in an area the practice serves
Willing to pay for professional services
For an online retailer, qualification may work differently. Behaviour could be used.
A person might become more valuable when they:
Visit several product pages.
Add products to a basket.
Download a buying guide.
Subscribe to promotional emails.
Return to the website repeatedly.
The important principle is: Qualification should help distinguish genuine prospects from general interest.
Example of Poor MQL Performance
Imagine a Cape Town IT services company runs a campaign.
The results are:
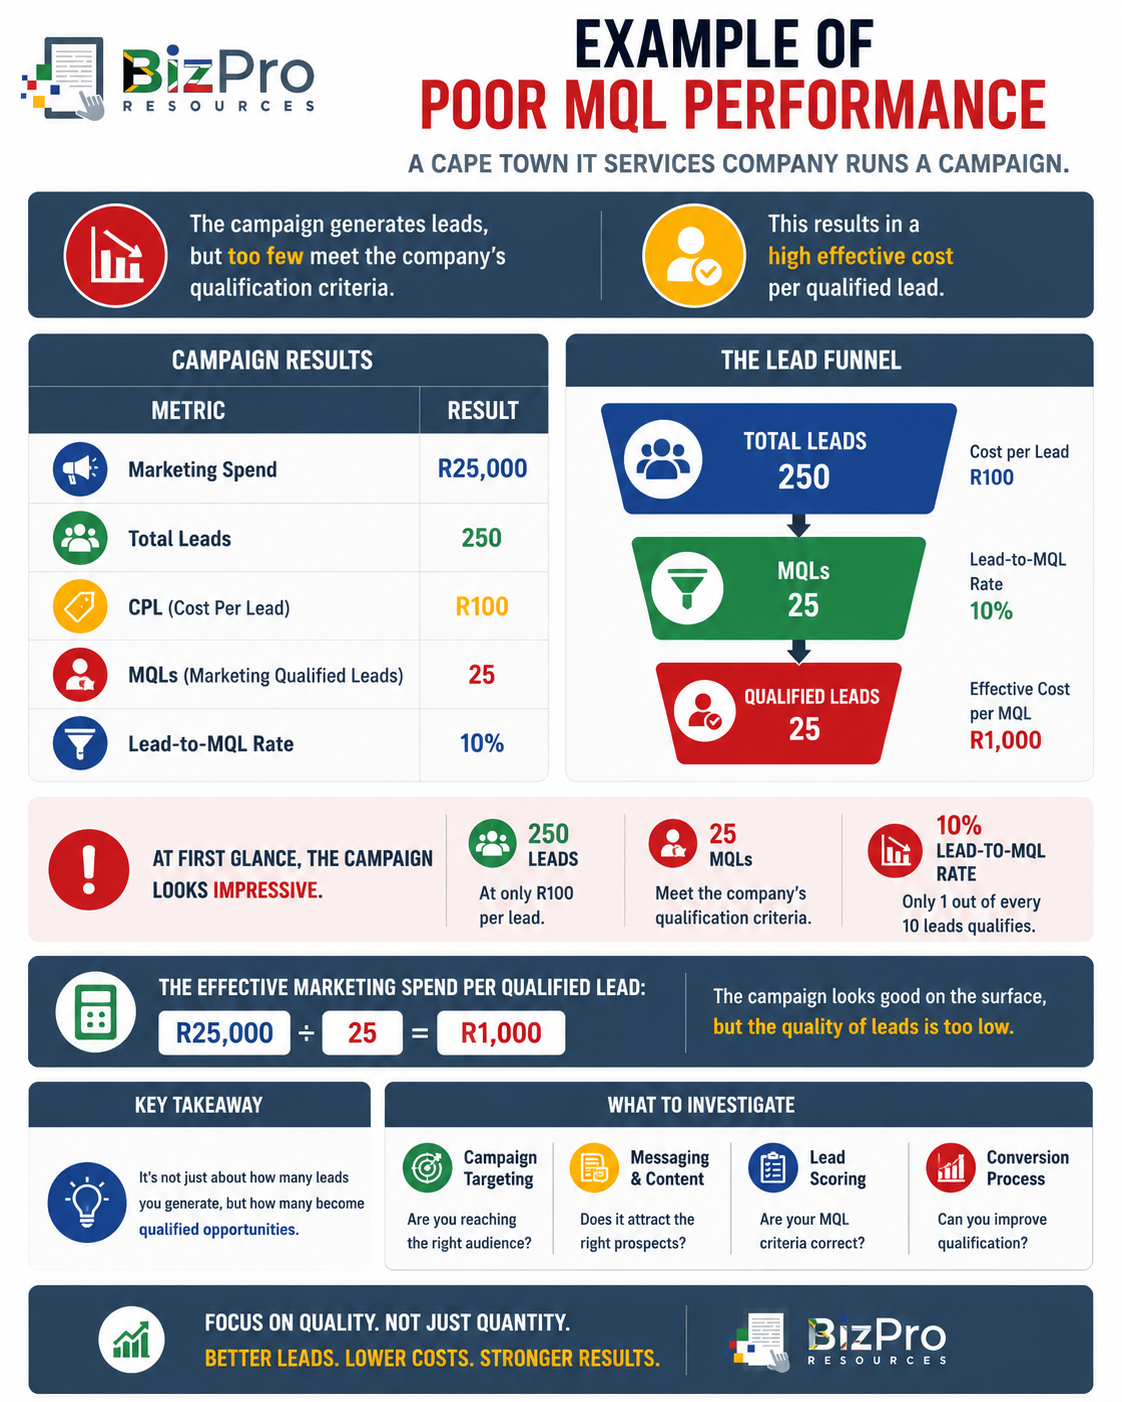
The campaign therefore looks very different once lead quality is considered.
What Does Poor MQL Performance Mean for the Company?
A low number or percentage of MQLs may mean:
Targeting is too broad.
Marketing attracts people who cannot afford the service.
Advertising messages are unclear.
The business is attracting the wrong customer type.
Forms do not screen enquiries effectively.
Marketing and sales disagree about what a good lead looks like.
Campaigns focus too heavily on generating volume instead of quality.
Poor MQL performance also wastes sales resources.
Imagine five salespeople repeatedly contacting people who:
Have no budget
Do not need the service
Are outside the service area
Have no authority to make purchasing decisions
Those salespeople are spending time on opportunities that were unlikely to succeed from the beginning.
Lead quality therefore affects more than marketing performance.
It also affects sales productivity.
Example of Good MQL Performance
The IT company improves its targeting and introduces a more focused offer aimed specifically at SMEs requiring managed IT support.
Its next campaign produces:
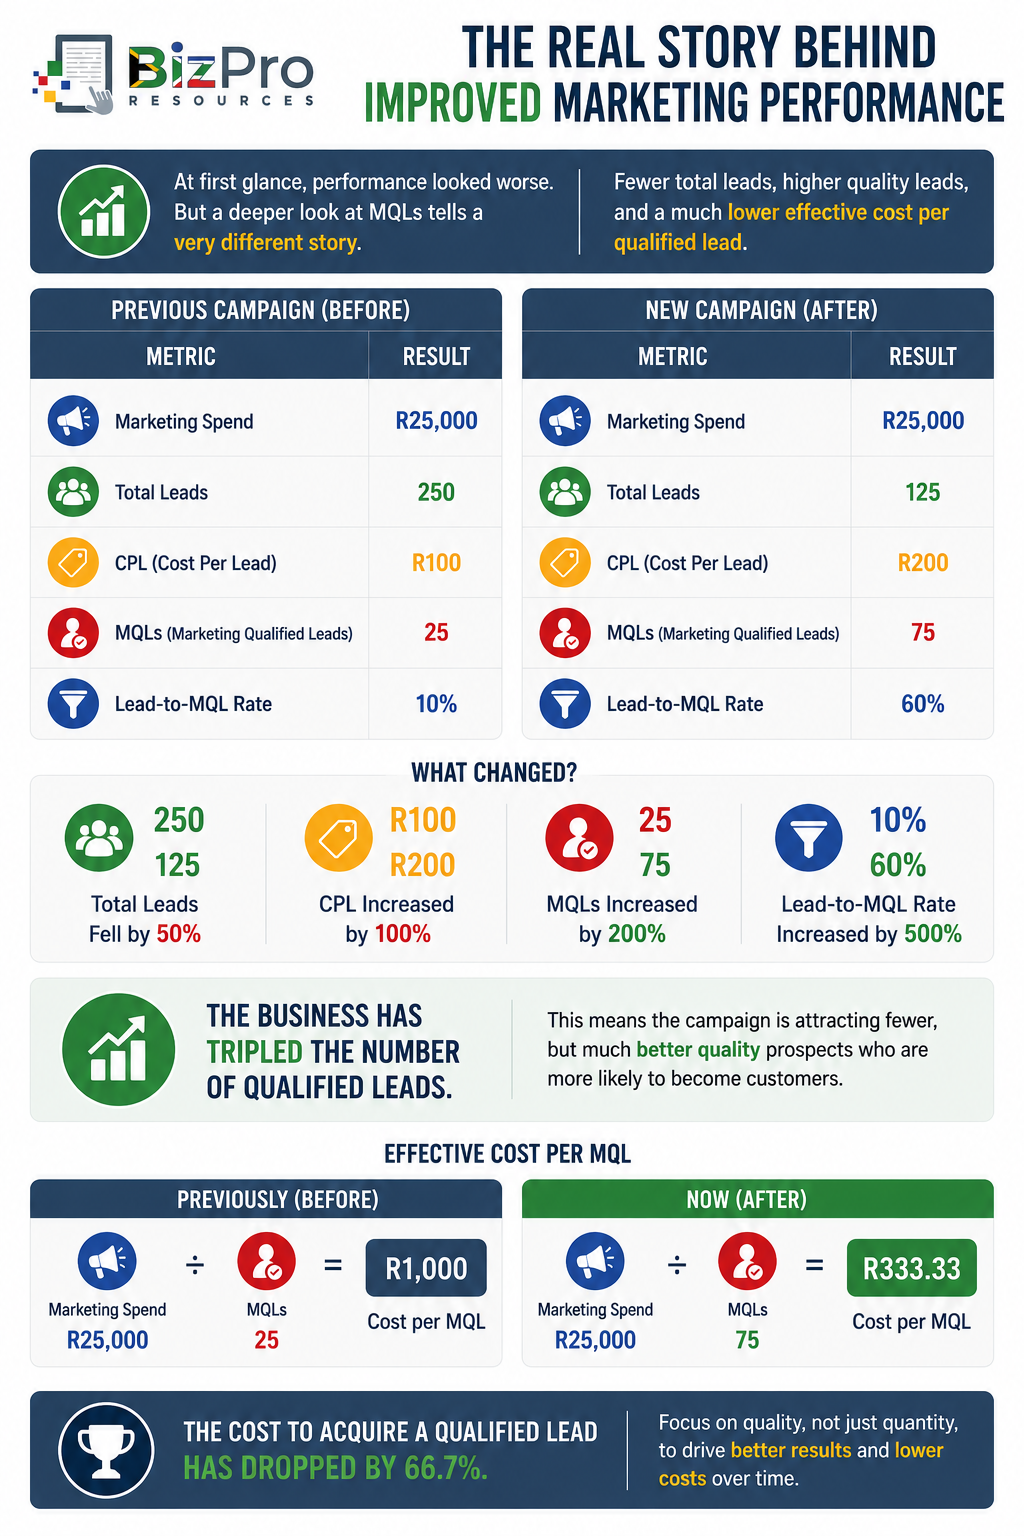
Something interesting has happened:
Total leads have fallen from 250 to 125.
CPL has increased from R100 to R200.
At first glance, someone looking only at lead volume and CPL might conclude: “Marketing performance has become worse.”
But look at MQLs:
Previously: 25 MQLs
Now: 75 MQLs
The business has tripled the number of qualified leads.
Its effective cost per MQL is: R25,000 ÷ 75 = R333.33
Previously it was: R25,000 ÷ 25 = R1,000
The new campaign is significantly stronger.
What Does Good MQL Performance Mean for the Company?
A high number of suitable MQLs means marketing is producing opportunities that more closely match what the sales team actually needs.
This can result in:
Better sales productivity
Higher conversion rates
Lower customer acquisition costs
Shorter sales cycles
Less time wasted
Better alignment between marketing and sales
More profitable customer acquisition
This example demonstrates why businesses should never judge marketing performance using only one metric.
How CVR, CPL, and MQL Work Together
These three metrics tell different parts of the same story.
Conversion Rate measures effectiveness: Are people taking the desired action?
Cost Per Lead measures efficiency: How much are we spending to generate each lead?
Marketing Qualified Leads measure quality: Are the leads we generate actually suitable prospects?
Consider two campaigns.
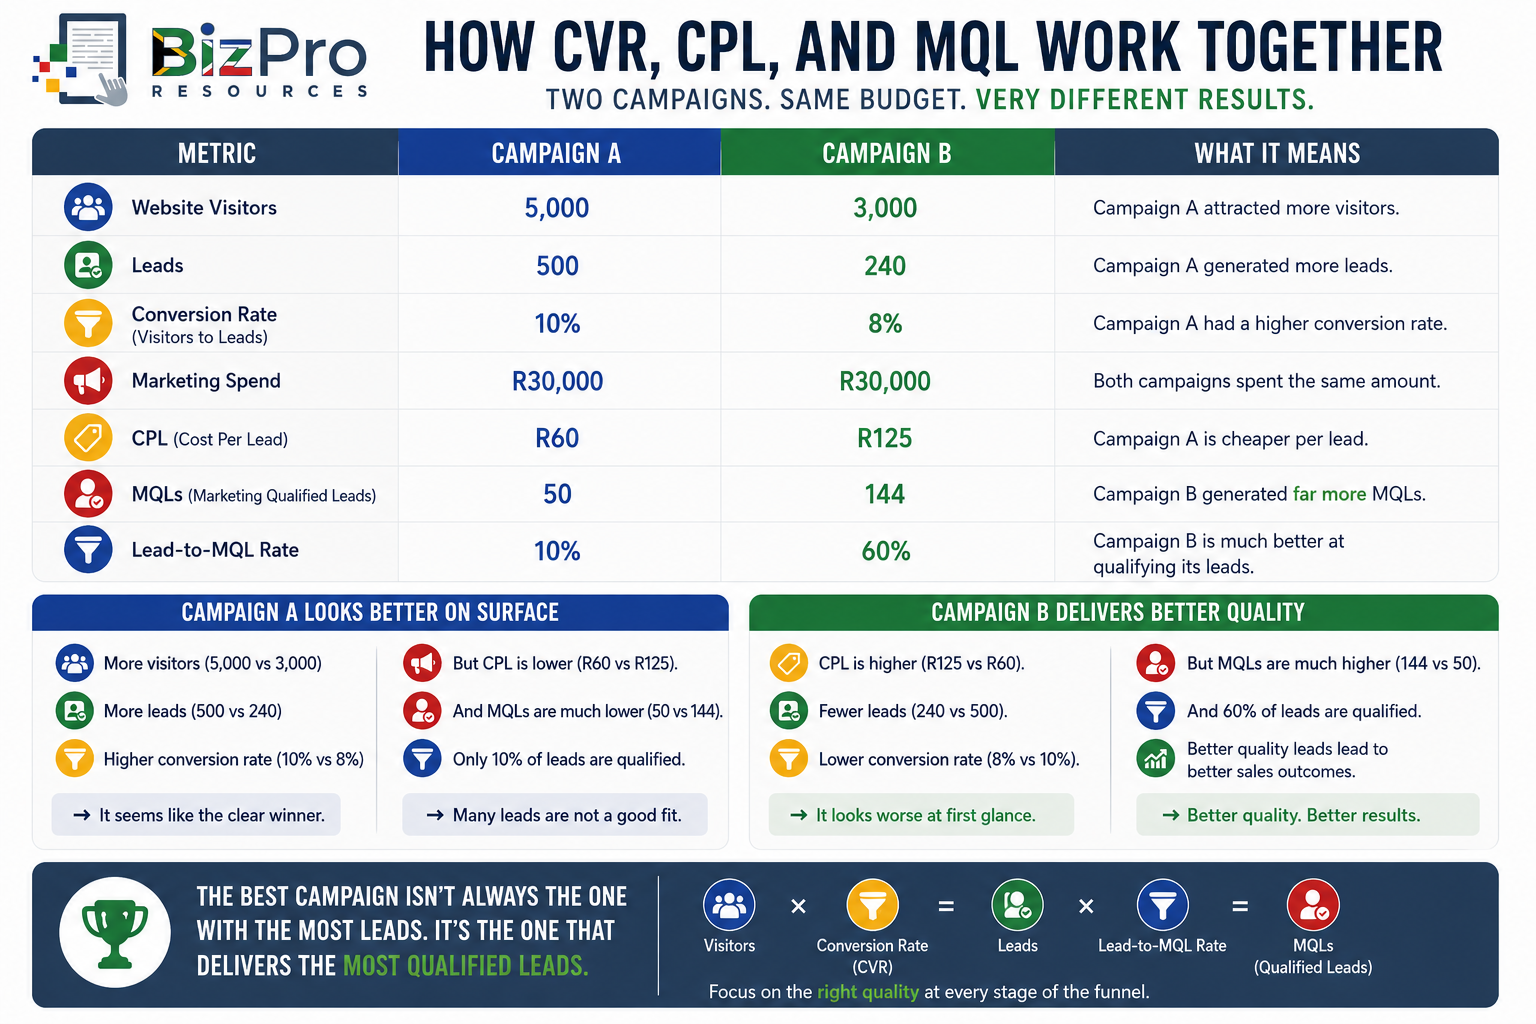
If management looks only at CVR and CPL, Campaign A appears superior.
It has:
More leads
Higher conversion
Lower CPL
But Campaign B produces 144 qualified leads compared with only 50.
Campaign B may therefore create significantly more real sales opportunities.
This is why marketing measurement should move from: Traffic → Leads
to: Traffic → Leads → Qualified Leads → Customers → Financial Value
Do Not Confuse Lead Quantity with Lead Quality
A common marketing mistake is celebrating lead volume without asking whether those leads are useful.
Imagine an agency reports: “Fantastic news! We generated 600 leads this month.”
Management should immediately ask:
How many were qualified?
How many became quotations?
How many became customers?
How much revenue did they generate?
Generating leads is relatively easy if quality does not matter.
A business can:
Give away prizes.
Offer large discounts.
Use vague advertisements.
Target extremely broad audiences.
Make free resources available.
These tactics may produce thousands of contact details.
But the objective of most business marketing is not to build the largest possible spreadsheet of names.
The objective is to create commercial opportunities.
Measure Cost Per Qualified Lead
Although CPL is useful, businesses that qualify leads should consider adding another internal metric: Cost Per Marketing Qualified Lead
The formula is: Cost Per MQL = Marketing Spend ÷ Number of MQLs
Suppose:
Marketing Spend = R40,000
Total Leads = 400
MQLs = 80
CPL is: R40,000 ÷ 400 = R100
Cost per MQL is: R40,000 ÷ 80 = R500
Both numbers are useful.
The first tells management what it costs to generate interest.
The second tells management what it costs to generate qualified interest.
Build a Simple Conversion and Lead Dashboard
A small business can monitor these metrics using a simple spreadsheet or CRM dashboard.
For example:
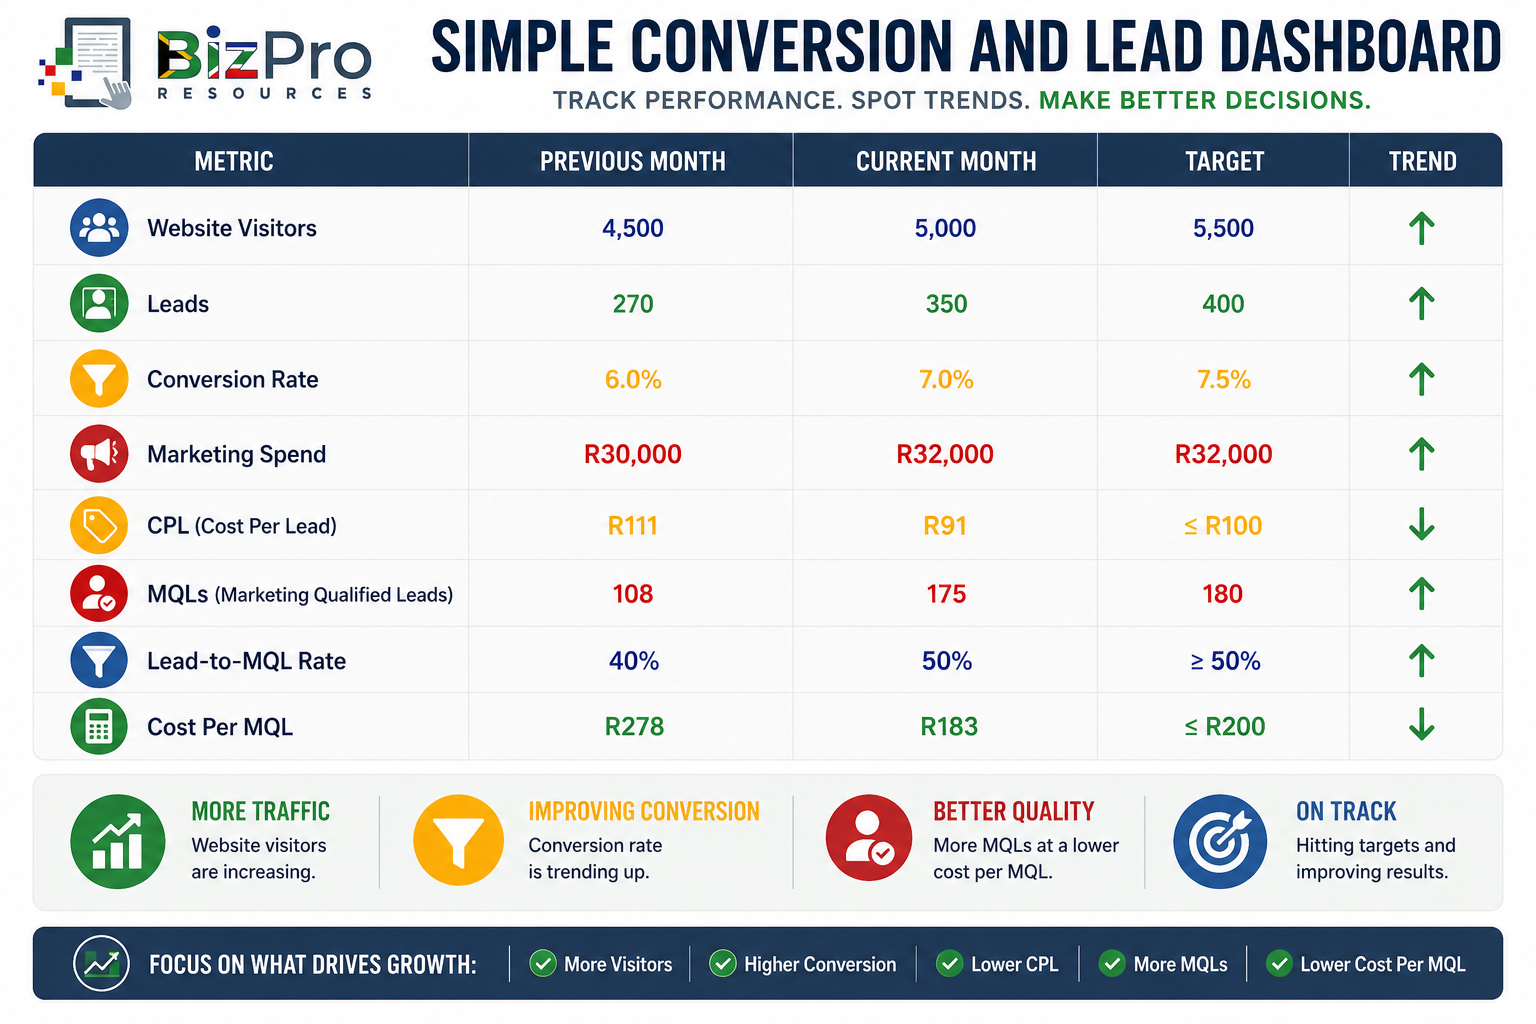
This gives management a much clearer picture than simply reporting website traffic.
Segment Your Conversion and Lead Metrics
Company-wide averages can hide major differences.
Suppose the overall CPL is R200. Break it down by marketing channel:
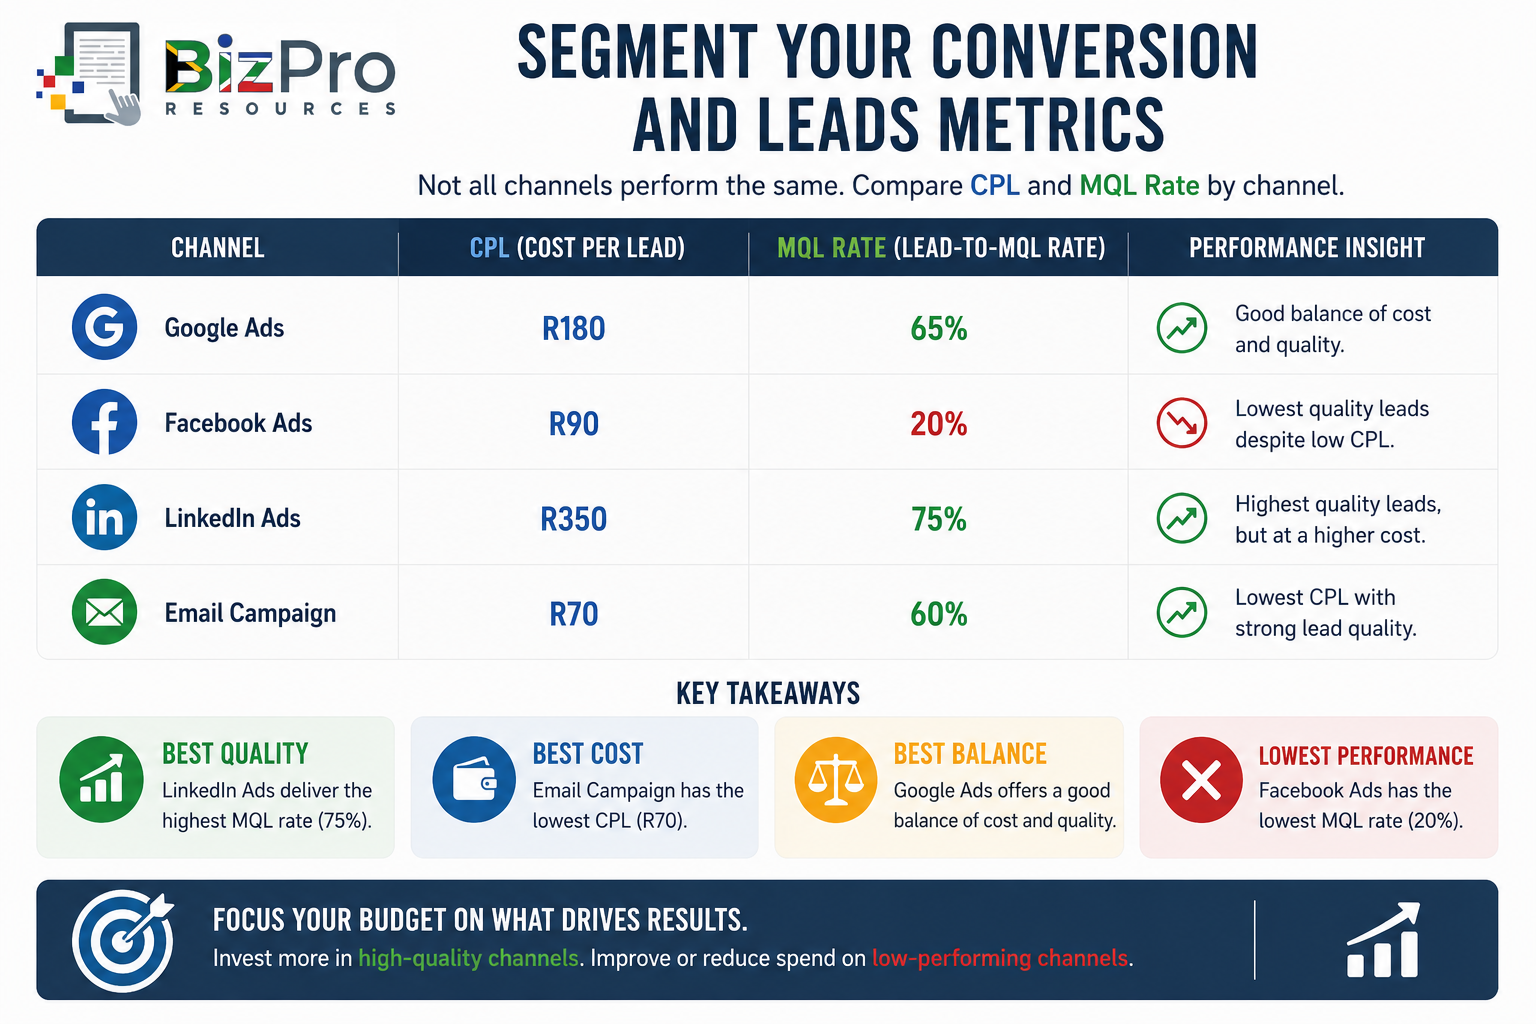
Facebook appears excellent if management only looks at CPL. It generates leads for R90 each. But only 20% become MQLs.
LinkedIn looks expensive at R350 per lead, but 75% are qualified.
Management should therefore investigate the full economics of each channel before reallocating budgets.
Useful segmentation could include:
Marketing channel
Campaign
Product
Service
Customer segment
Geographic area
Device type
Landing page
Advertisement
Lead source
The objective is to discover not only how many leads are being generated, but where the best leads are coming from.
Marketing and Sales Must Agree on Lead Quality
MQL measurement becomes ineffective when marketing and sales use different definitions:
Marketing may say: “We delivered 100 qualified leads.”
Sales may respond: “Most of them were useless.”
That disagreement needs to be resolved.
Both teams should agree on basic questions such as:
What type of customer are we looking for?
What makes someone a genuine prospect?
What information should marketing collect?
When should a lead be passed to sales?
What causes a lead to be rejected?
What feedback should sales give marketing?
For a small business, this does not require complicated corporate processes.
It may simply require the owner, marketing person, and salesperson to sit down and agree on five or six qualification criteria.
That alone can dramatically improve lead measurement.
What Does Good Conversion and Lead Performance Look Like?
There is no universal conversion rate or CPL that every business should target.
A good result depends on:
Industry
Product
Service
Price
Marketing channel
Customer type
Competition
Sales cycle
Lead definition
Conversion definition
Customer lifetime value
Instead of chasing generic internet benchmarks, management should establish its own baseline and work toward improvement.
Healthy performance generally means:
Conversion Rate is improving: A growing percentage of the right people take the desired action.
CPL is financially sustainable: The business can generate leads at a cost that supports profitable customer acquisition.
MQL volume and quality are improving: Marketing produces more prospects that genuinely match the company's target customer.
Most importantly: These improvements eventually produce more profitable customers.
Turning Conversion and Lead Metrics into Action
Metrics should lead to decisions.
If Conversion Rate is poor, investigate:
Landing pages
Calls-to-action
Website usability
Mobile performance
Forms
Offers
Pricing
Trust signals
Audience targeting
If CPL is too high, investigate:
Advertising costs
Targeting
Conversion rates
Marketing channels
Campaign efficiency
Landing page performance
If MQL performance is poor, investigate:
Lead qualification criteria
Customer targeting
Marketing messages
Lead forms
Marketing and sales alignment
Customer profiles
Then make a change.
Measure the result.
Compare it with the previous result.
Continue improving.
The process should become a cycle:
Measure → Investigate → Act → Measure Again
Final Thoughts
Marketing success is not simply about generating attention.
A business needs to convert that attention into meaningful commercial opportunities:
Conversion Rate tells you how effectively people are moving to the next step.
Cost Per Lead tells you how much you are spending to generate each lead.
Marketing Qualified Leads tell you whether those leads are genuinely useful to the business.
Viewed together, these metrics help management understand the quantity, cost, and quality of its marketing leads:
A business that focuses only on traffic may attract plenty of visitors but few enquiries.
A business that focuses only on CPL may generate cheap but useless leads.
A business that focuses only on lead volume may overwhelm its sales team with people who were never likely to buy.
The objective is therefore not simply: More leads.
The objective is: More of the right leads, generated efficiently, and converted into profitable customers.
That is when marketing starts becoming a measurable engine for business growth.
Related Articles in the Marketing Performance Metrics Series
Marketing Financial Metrics: ROI, CAC, CLV, and ROAS Explained
Marketing Conversion and Lead Metrics: CVR, CPL, and MQL Explained
Marketing Traffic and Engagement Metrics: CTR, Bounce Rate, and Engagement Rate Explained
Social Media Metrics: Followers, Comments, Engagement Rate, and Video Views Explained
SEO Metrics: Page Views, CTR, Domain AUthority, Organic Traffic, and Keyword Rankings Explained
Email Marketing Metrics: CTOR, Engagement, Website Traffic, Bounce Rate, and CTR Explained
AI Disclaimer
AI Tools were used to assist with research. Remember to always cross-check everything that you read.


