
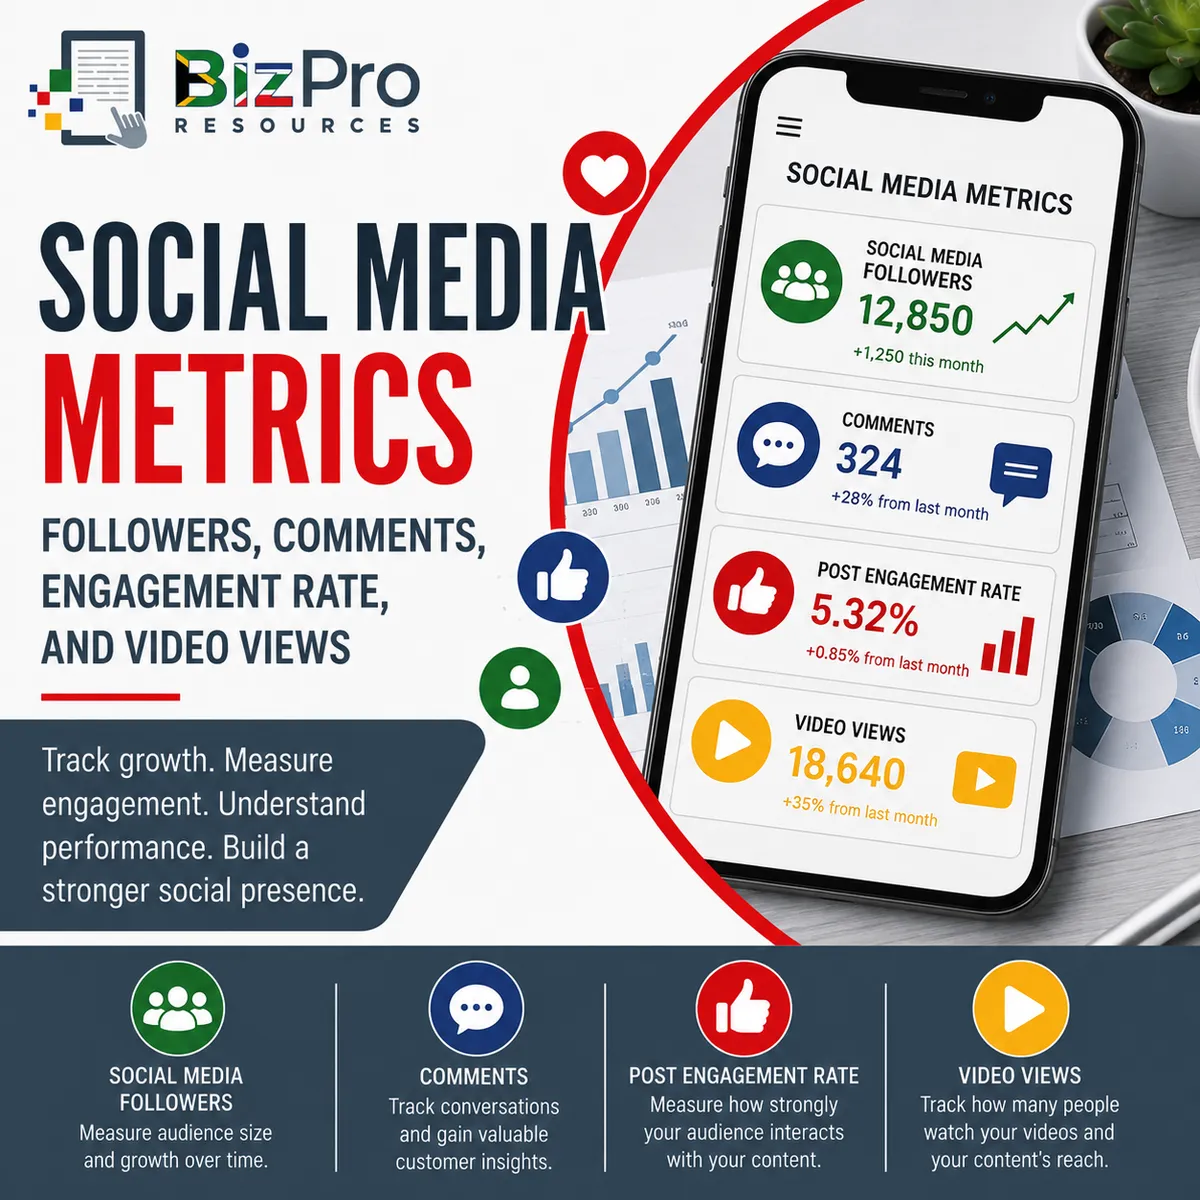
Social Media Metrics: Followers, Comments, Engagement Rate, and Video Views Explained
Article #4 of #7 in the Marketing Performance Metrics Series
Introduction
Social media has become an important marketing channel for many small businesses.
Platforms such as Facebook, Instagram, LinkedIn, TikTok, and YouTube allow businesses to:
Build awareness.
Communicate with customers.
Demonstrate products and services.
Share useful information.
Generate enquiries.
Promote special offers.
Build credibility.
Create communities around their brands.
Drive visitors to websites and online stores.
But social media can also create a measurement problem.
The platforms provide businesses with enormous amounts of data:
Followers.
Likes.
Comments.
Shares.
Views.
Reach.
Impressions.
Clicks.
Watch time.
Engagement.
With so many numbers available, it can be easy to focus on whatever looks impressive rather than what is actually useful.
A business might proudly say: “We now have 25,000 followers!” But what if almost none of those followers interact with the content?
Another business might celebrate: “Our video received 100,000 views!” But what if most viewers watched only a few seconds?
Social media metrics need to be interpreted carefully.
Four useful metrics for small businesses are:
Social Media Followers
Comments
Post Engagement Rate
Video Views
Together, they help answer four different questions:
Social Media Followers: Is our potential social media audience growing?
Comments: Are people interested enough to join the conversation?
Post Engagement Rate: How strongly is our audience interacting with individual posts?
Video Views: Are people watching our video content?
These metrics do not directly tell management whether social media is profitable.
But they can provide useful information about audience growth, content relevance, interaction, and attention.
1. Social Media Followers
What Are Social Media Followers?
Social Media Followers are people or accounts that choose to follow, subscribe to, or otherwise receive content from a business's social media profile.
Depending on the platform, they may be called:
Followers
Subscribers
Connections
Page followers
The terminology differs, but the basic idea is similar.
A follower has indicated some level of interest in receiving or seeing future content from the business.
For example, a plumbing company may have:
Facebook Followers = 8,500
Instagram Followers = 3,200
LinkedIn Followers = 1,100
These numbers indicate the size of the potential audience associated with each account.
However, followers should not automatically be treated as customers.
A follower may be:
An existing customer.
A potential customer.
A former customer.
An employee.
A competitor.
A supplier.
A friend or family member.
Someone who likes the content but will never purchase.
Follower numbers therefore measure audience size, not customer numbers.
How Are Social Media Followers Calculated?
The simplest follower metric is a count: Total Followers = Number of Accounts Following the Social Media Profile
For example: Instagram Followers = 5,000
Businesses can also measure Follower Growth.
A useful formula is: Follower Growth = Ending Followers − Starting Followers
Suppose a company starts the month with 5,000 followers and ends with 5,500.
Follower Growth = 5,500 − 5,000 = 500
The company gained a net 500 followers during the month.
A percentage growth rate can also be calculated: Follower Growth Rate = Net New Followers ÷ Starting Followers × 100
Therefore: 500 ÷ 5,000 × 100 = 10%
The company's follower base grew by 10% during the period.
Example of Poor Social Media Follower Performance
Imagine a Johannesburg business consultancy has the following Instagram results:
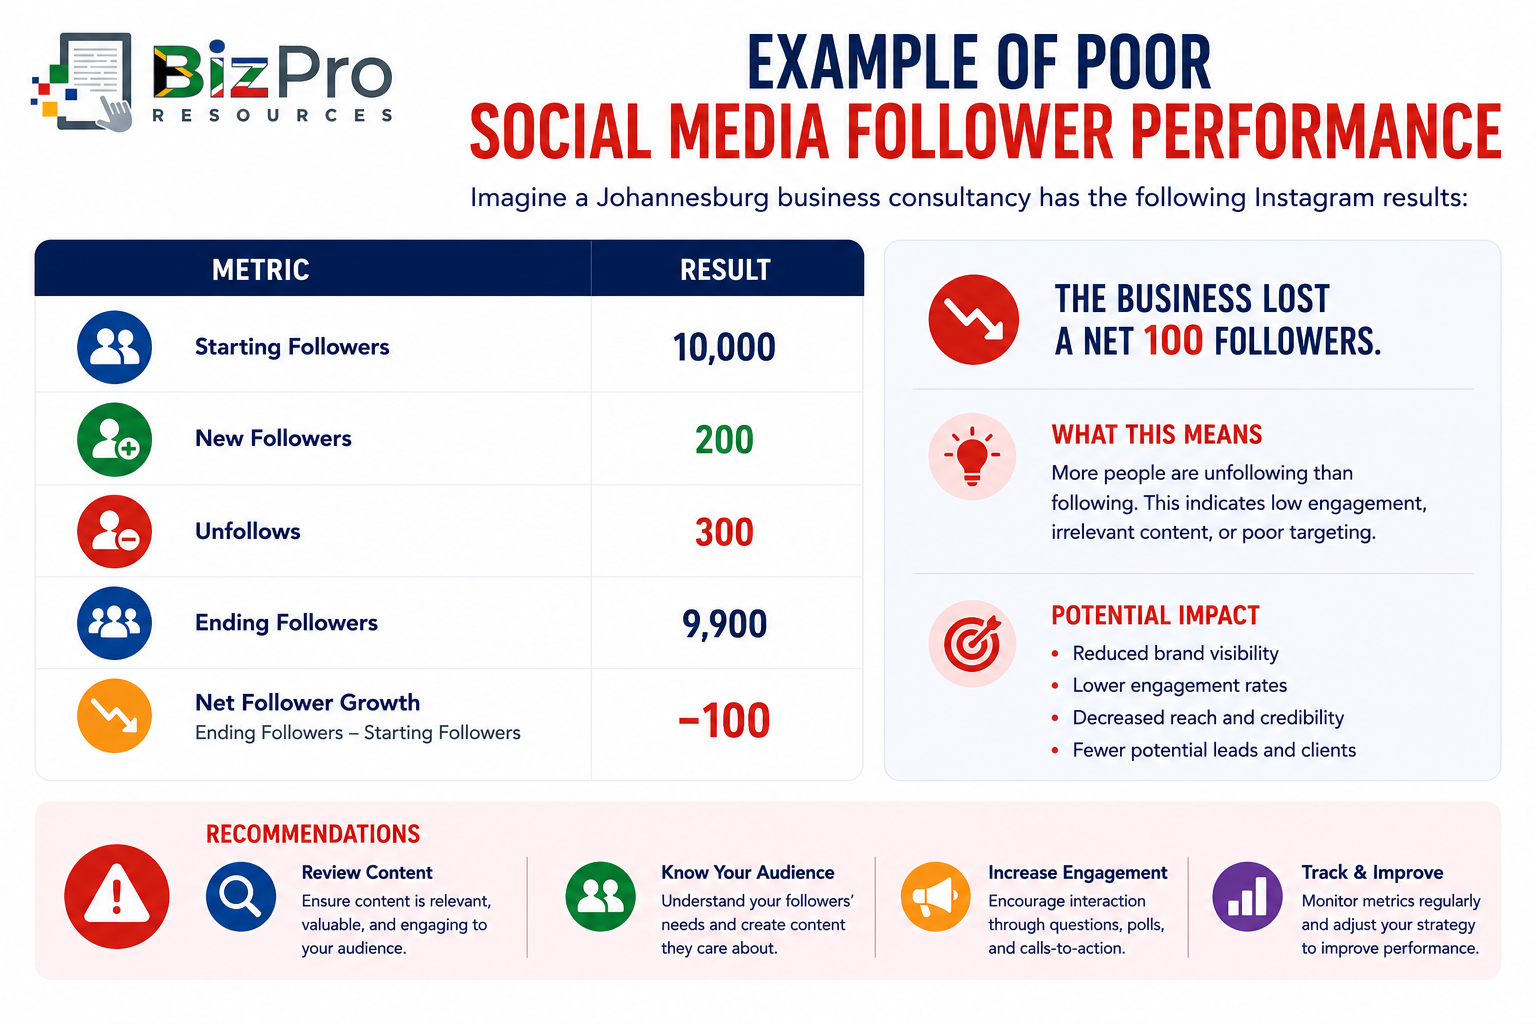
The business lost a net 100 followers.
Its follower growth rate is: −100 ÷ 10,000 × 100 = −1%
The follower base decreased by 1%.
Assume this decline continues for several months.
What Does Poor Follower Performance Mean for the Company?
Declining or stagnant follower numbers may indicate:
Content is no longer relevant.
The business posts too infrequently.
Content is too promotional.
The audience is losing interest.
Competitors are producing better content.
The business is attracting the wrong audience.
Posting quality has declined.
The brand has experienced negative publicity.
Followers are not seeing enough value in remaining connected.
However, a declining follower count is not automatically disastrous.
Suppose the business previously attracted thousands of people through competitions offering expensive prizes unrelated to its services.
Many of those people may never have been genuine potential customers.
If low-quality followers leave while the remaining audience becomes more relevant and engaged, the business could actually be improving its social media audience quality.
Follower numbers therefore require context.
Example of Good Social Media Follower Performance
The consultancy changes its strategy.
Instead of repeatedly posting advertisements, it begins publishing:
Practical small-business tips.
Short financial explanations.
Staff management advice.
Business checklists.
Common business mistakes.
Short educational videos.
Customer success stories.
Over the next month:
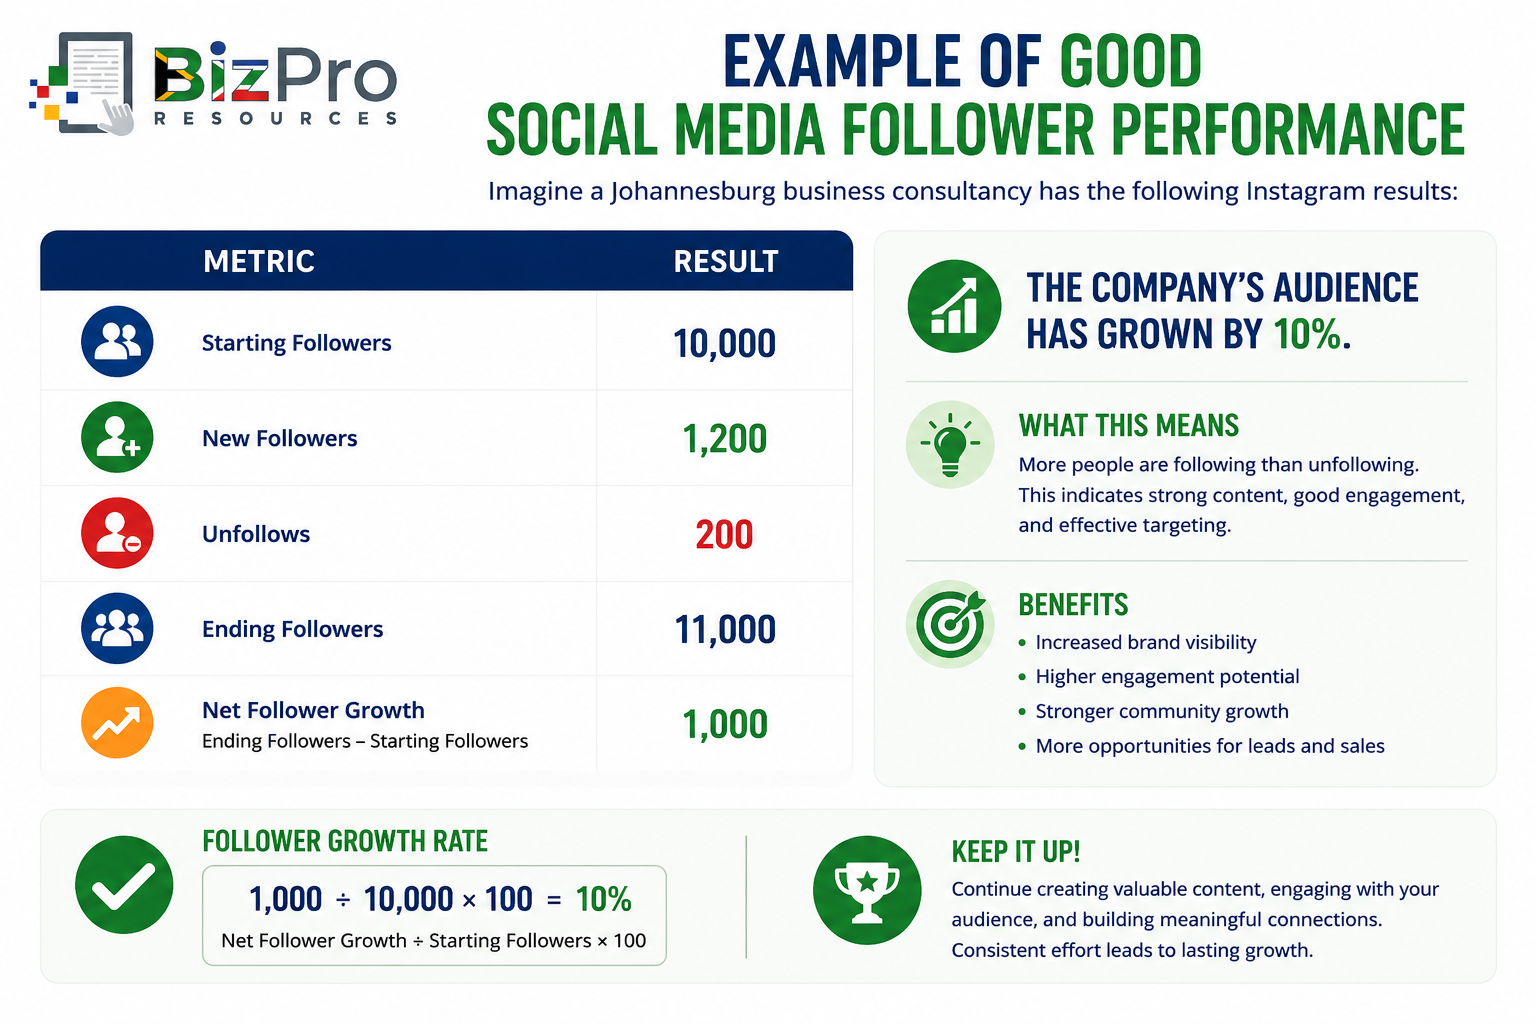
Follower Growth Rate is: 1,000 ÷ 10,000 × 100 = 10%
The company's audience has grown by 10%.
What Does Good Follower Performance Mean for the Company?
Healthy follower growth can suggest that more people consider the company's content worth receiving.
This may increase the potential audience available for future:
Educational content.
Promotions.
Product launches.
Announcements.
Offers.
Events.
Lead-generation campaigns.
But management should still ask: Are these the right followers?
A South African accounting practice gaining 5,000 followers who are mostly overseas consumers may receive little commercial benefit.
The quality and relevance of the audience matter as much as the number.
Do Not Buy Followers
Businesses may sometimes be tempted to purchase followers because a larger number makes an account appear more successful.
This can create serious measurement problems.
Purchased or artificial followers may:
Never interact.
Never enquire.
Never buy.
Reduce engagement rates.
Distort audience data.
Damage credibility.
Make marketing reports misleading.
A smaller, relevant audience is usually more valuable than a large artificial audience.
For example: Account A: 50,000 followers with 100 meaningful interactions may be less valuable than: Account B: 5,000 followers with 500 meaningful interactions
Social media success should not become a competition to collect the biggest number.
2. Comments
What Are Comments?
Comments are written responses that users leave on social media posts, videos, advertisements, or other content.
Comments can be especially useful because they require more effort than simply pressing a Like button.
Someone who comments may be:
Asking a question.
Sharing an opinion.
Requesting information.
Recommending the business.
Complaining.
Tagging another person.
Discussing the topic.
Showing interest in the product or service.
Comments can therefore provide both a quantity metric and a source of qualitative customer insight.
How Are Comments Calculated?
The simplest measure is: Total Comments = Number of Comments Received During the Measurement Period
For example, a business publishes 20 posts during a month. Together, the posts receive 400 comments. Hence: Total Monthly Comments = 400
Management can also calculate: Average Comments Per Post = Total Comments ÷ Number of Posts
Therefore: 400 ÷ 20 = 20 comments per post
This allows businesses to compare performance even when posting frequency changes.
A comment rate can also be calculated if useful: Comment Rate = Comments ÷ Reach × 100.
If a post reaches 10,000 people and receives 100 comments: Comment Rate = 100 ÷ 10,000 × 100 = 1%.
Example of Poor Comment Performance
Imagine a vehicle workshop has 15,000 Facebook followers:
During a month, it publishes 20 posts.
Those posts receive a total of only 20 comments.
Average Comments Per Post = 20 ÷ 20 = 1 comment per post
Suppose the account previously averaged 10 comments per post.
This represents a substantial decline.
What Does Poor Comment Performance Mean for the Company?
Low or declining comments may suggest:
Content does not encourage discussion.
Posts are too promotional.
Followers are becoming less interested.
Content topics are repetitive.
The audience is not seeing the posts.
The audience includes many inactive followers.
Posts do not invite questions or opinions.
Content is not relevant enough to create conversation.
But businesses should not judge comments purely by quantity.
One comment saying: “Can you please send me a quotation?” may have greater commercial value than 50 comments containing only emojis.
The content of comments matters.
Example of Good Comment Performance
The vehicle workshop changes its content:
Instead of only posting advertisements such as: “Book your vehicle service today.”
it begins asking practical questions and sharing useful advice.
For example: “What warning light on your dashboard worries you the most?”
Another post explains: “Five signs your brakes may need attention.”
During the next month, the business publishes 20 posts and receives 300 comments.
Average Comments Per Post = 300 ÷ 20 = 15 comments per post
What Does Good Comment Performance Mean for the Company?
An increase in relevant comments can indicate that the audience is becoming more involved with the content.
Comments can also provide valuable information.
Customers may reveal:
Common problems.
Frequently asked questions.
Buying concerns.
Product preferences.
Service complaints.
Misunderstandings.
Future content ideas.
For example, if dozens of people ask: “How often should I replace my brake pads?” the business has discovered a topic for:
A blog article.
A video.
A social media post.
An email.
A customer education campaign.
Comments are therefore not simply an engagement number.
They can become a form of customer research.
Negative Comments Still Matter
Businesses sometimes assume that more comments automatically mean better performance. That is dangerous.
Imagine a post receives 1,000 comments:
That looks impressive.
But 800 comments may be customers complaining about poor service.
The volume is high.
The sentiment is terrible.
Management should therefore monitor:
Positive comments.
Neutral comments.
Questions.
Complaints.
Spam.
Genuine enquiries.
A sudden increase in comments should lead to investigation.
The important question is not simply: “How many comments did we receive?”
It is: “What are people saying?”
3. Post Engagement Rate
What Is Post Engagement Rate?
Post Engagement Rate measures how much interaction an individual social media post generates relative to its audience or exposure.
Engagement can include actions such as:
Likes
Reactions
Comments
Shares
Saves
Clicks
The exact definition depends on the platform and the business's reporting method.
Post Engagement Rate is useful because it puts interactions into context.
Suppose:
Post A receives 500 engagements.
Post B receives 300 engagements.
Post A appears better. But suppose Post A reached 50,000 people while Post B reached only 3,000. Now the picture changes dramatically.
Engagement Rate helps management compare the response relative to audience exposure.
How Is Post Engagement Rate Calculated?
A useful formula is: Post Engagement Rate = Total Post Engagements ÷ Post Reach × 100
Suppose a post reaches 8,000 people.
It generates:
250 likes
50 comments
70 shares
30 saves
Total engagements: 250 + 50 + 70 + 30 = 400
Therefore: Post Engagement Rate = 400 ÷ 8,000 × 100 = 5%
Under this calculation, engagements equal 5% of the post's reach.
Use the Same Formula Consistently
Engagement rates can be calculated against:
Reach
Impressions
Followers
For example: Engagement Rate by Reach = Engagements ÷ Reach × 100
and: Engagement Rate by Followers = Engagements ÷ Followers × 100
These can produce very different results.
Management should therefore define the method being used and apply it consistently.
Example of Poor Post Engagement Rate
Imagine a security company publishes a Facebook post.
The post reaches 20,000 people.
It receives:
60 likes
10 comments
10 shares
20 clicks
Total engagements: 60 + 10 + 10 + 20 = 100
Therefore: Post Engagement Rate = 100 ÷ 20,000 × 100 = 0.5%
Assume comparable posts from the business normally achieve around 3%.
This post has performed poorly.
What Does Poor Post Engagement Rate Mean for the Company?
Poor engagement may suggest:
The topic is not relevant.
The content is too promotional.
The visual is weak.
The headline does not attract attention.
The post does not provide enough value.
The audience has seen similar content too often.
The wrong audience is being reached.
The call-to-action is weak.
Management should compare poor-performing posts with strong-performing posts.
Ask: What was different?
The answer may reveal what the audience actually wants.
Example of Good Post Engagement Rate
The security company publishes another post.
This time, it shares a practical home security checklist titled: “7 Things to Check Before You Leave Home for the Holidays.”
The post reaches 20,000 people.
It receives:
600 likes
120 comments
200 shares
80 saves
Total engagements: 600 + 120 + 200 + 80 = 1,000
Therefore: Post Engagement Rate = 1,000 ÷ 20,000 × 100 = 5%
What Does Good Post Engagement Rate Mean for the Company?
The content is generating substantially more interaction relative to its reach. This suggests that the topic is more relevant or useful to the audience.
Management can learn from this.
Perhaps practical security advice performs better than direct sales messages. That does not mean the company should never advertise.
It means the content strategy could include a healthy combination of:
Educate → Build Trust → Demonstrate Expertise → Promote
rather than: Sell → Sell → Sell → Sell
4. Video Views
What Are Video Views?
Video Views measure how many times video content has been viewed according to the rules of the platform on which it appears.
Video has become increasingly important across:
Facebook
Instagram
TikTok
YouTube
LinkedIn
Websites
Businesses can use video to:
Demonstrate products.
Explain services.
Introduce employees.
Show completed projects.
Answer customer questions.
Share customer testimonials.
Provide tutorials.
Explain complicated topics.
Build trust.
Video Views provide an indication of how much viewing activity a piece of video content has generated.
But there is an important warning: Not every platform defines a video view in the same way. One platform may count a view after a short period of playback. Another may apply different rules.
Businesses should therefore understand the definition used by each platform before comparing results.
How Are Video Views Calculated?
The basic metric is a count: Video Views = Number of Views Recorded by the Platform
Suppose a video receives: Video Views = 25,000
The business can report that the platform recorded 25,000 views according to its measurement rules.
Businesses can also calculate a View Rate when appropriate: Video View Rate = Video Views ÷ Video Impressions × 100
Suppose:
Video Impressions = 100,000
Video Views = 25,000
Therefore: View Rate = 25,000 ÷ 100,000 × 100 = 25%
Again, the exact definition of a qualifying view should be understood before interpreting the result.
Example of Poor Video View Performance
Imagine a plumbing company publishes an educational video titled: “How to Identify a Water Leak Before It Becomes Expensive.”
The video receives:
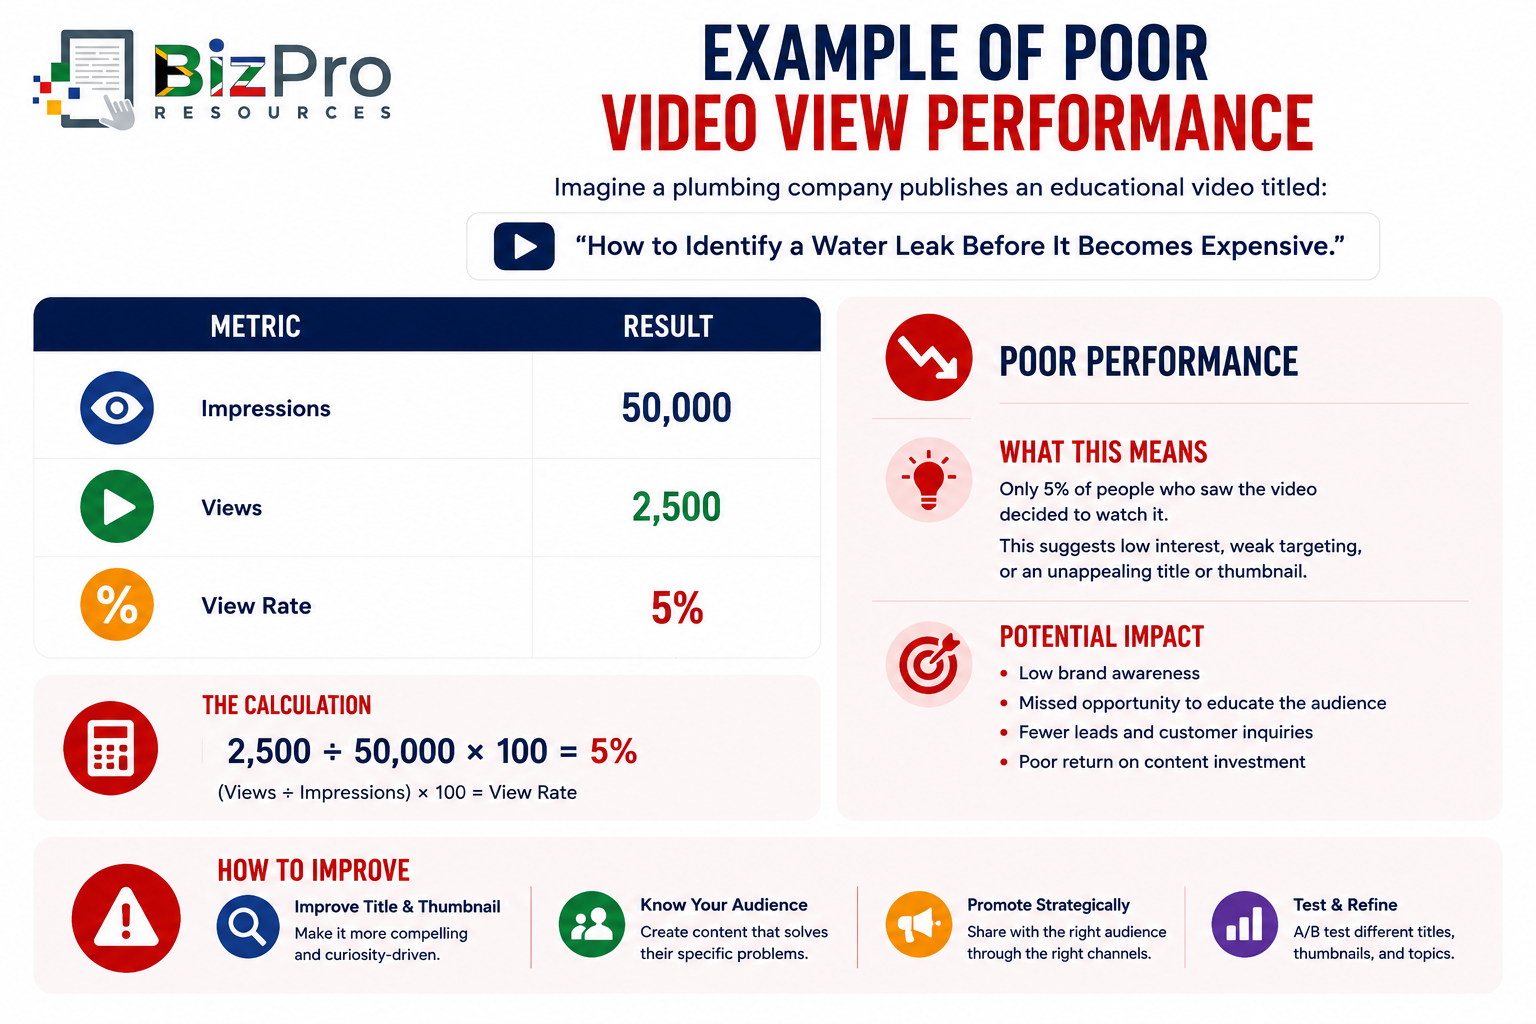
The View Rate calculation is: 2,500 ÷ 50,000 × 100 = 5%
Assume similar videos from the company normally generate view rates around 20%.
The result is therefore poor relative to the company's normal performance.
What Does Poor Video View Performance Mean for the Company?
Low views or a low view rate may indicate:
The opening seconds are weak.
The thumbnail is unattractive.
The title is unclear.
The topic is not relevant.
The video is too long.
The content takes too long to get to the point.
The wrong audience is being reached.
The video format does not suit the platform.
The content quality is poor.
The company should not automatically conclude: “Video marketing does not work.”
Perhaps the problem is the individual video rather than the channel.
Example of Good Video View Performance
The plumbing company produces another video.
This one begins immediately with a visible leaking pipe and the headline: “Your Water Bill Suddenly Increased? Check These Three Places.”
The video is shorter, visually clearer, and immediately explains the customer problem.
Results:
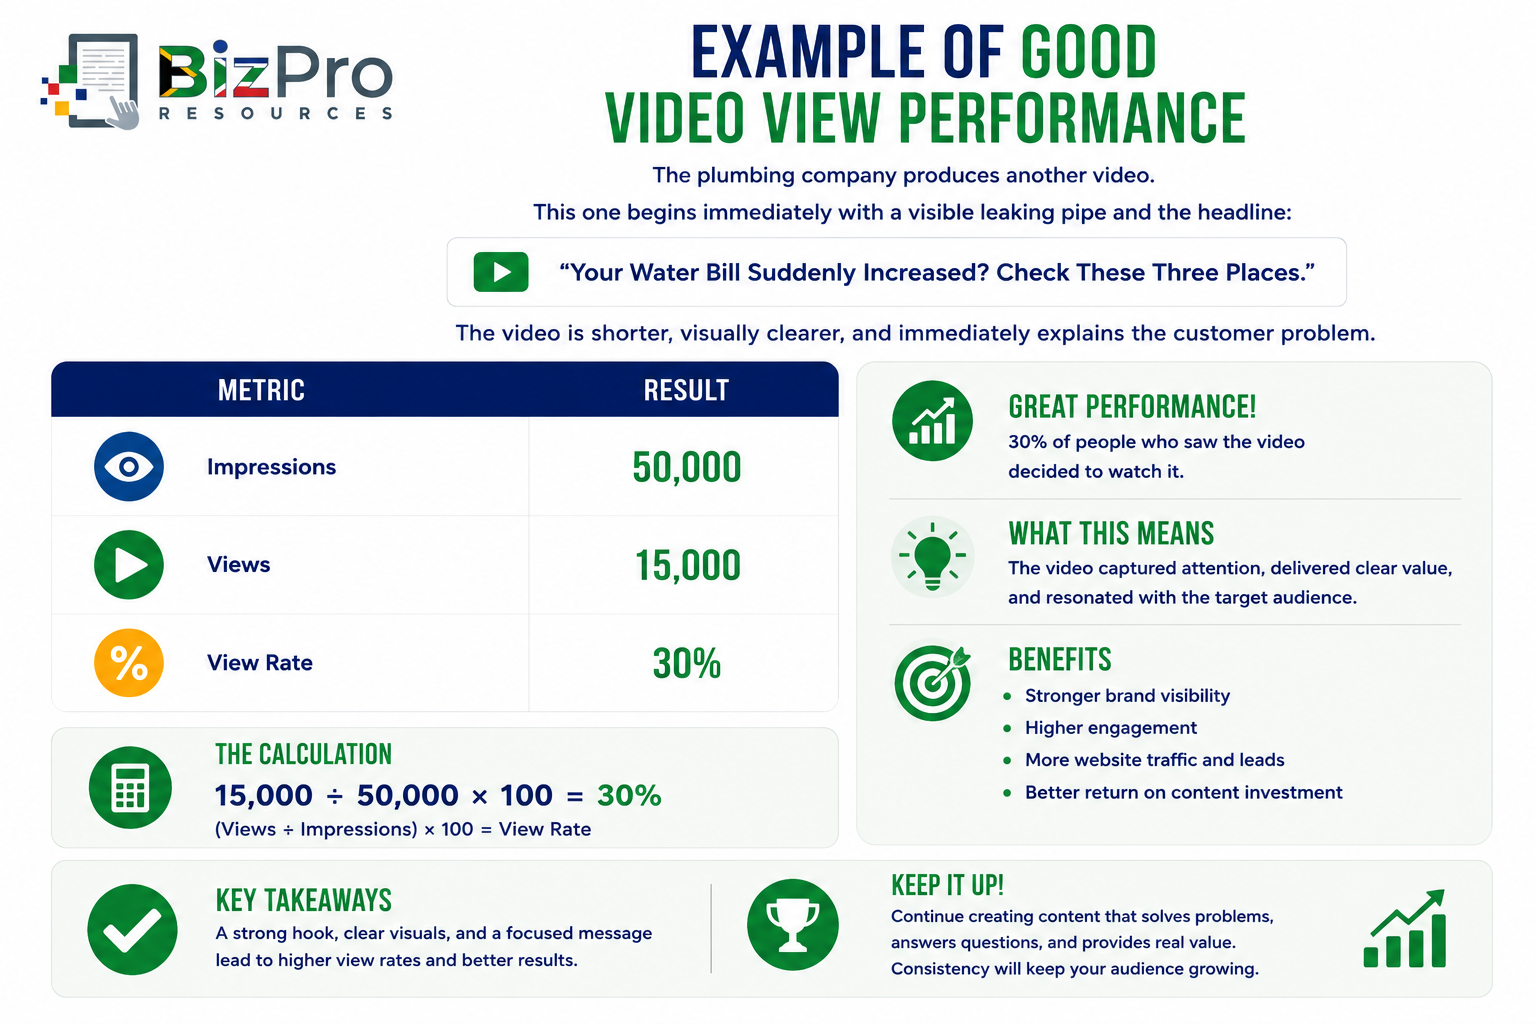
The View Rate calculation is: 15,000 ÷ 50,000 × 100 = 30%
What Does Good Video View Performance Mean for the Company?
The new video is attracting significantly more viewing activity from the audience exposed to it. Management should investigate why.
Possible reasons include:
Stronger opening.
Better topic.
Better title.
More relevant audience.
Shorter format.
Better thumbnail.
More useful information.
These lessons can then be applied to future videos.
A Video View Does Not Mean the Whole Video Was Watched
This is one of the most important warnings when using video metrics.
A platform may record a view even when someone watches only a relatively small portion of the video.
Therefore: 100,000 views does not necessarily mean 100,000 people watched the entire video.
Where possible, businesses should combine views with additional video metrics such as:
Average watch time.
Audience retention.
Completion rate.
Percentage watched.
Clicks after viewing.
Enquiries generated.
Imagine two videos.
Video A:
Views = 100,000
Average Watch Time = 5 seconds
Video B:
Views = 20,000
Average Watch Time = 60 seconds
Which is better?
There is not enough information to answer without knowing the video's objective and length. But Video B may be generating much deeper attention despite having fewer views.
This is another example of why a single metric rarely tells the complete story.
How the Four Social Media Metrics Work Together
Followers, Comments, Post Engagement Rate, and Video Views measure different aspects of social media performance:
Followers measure audience size and growth.
Comments measure conversation and written interaction.
Post Engagement Rate measures interaction relative to exposure.
Video Views measure viewing activity for video content.
Consider two social media accounts:
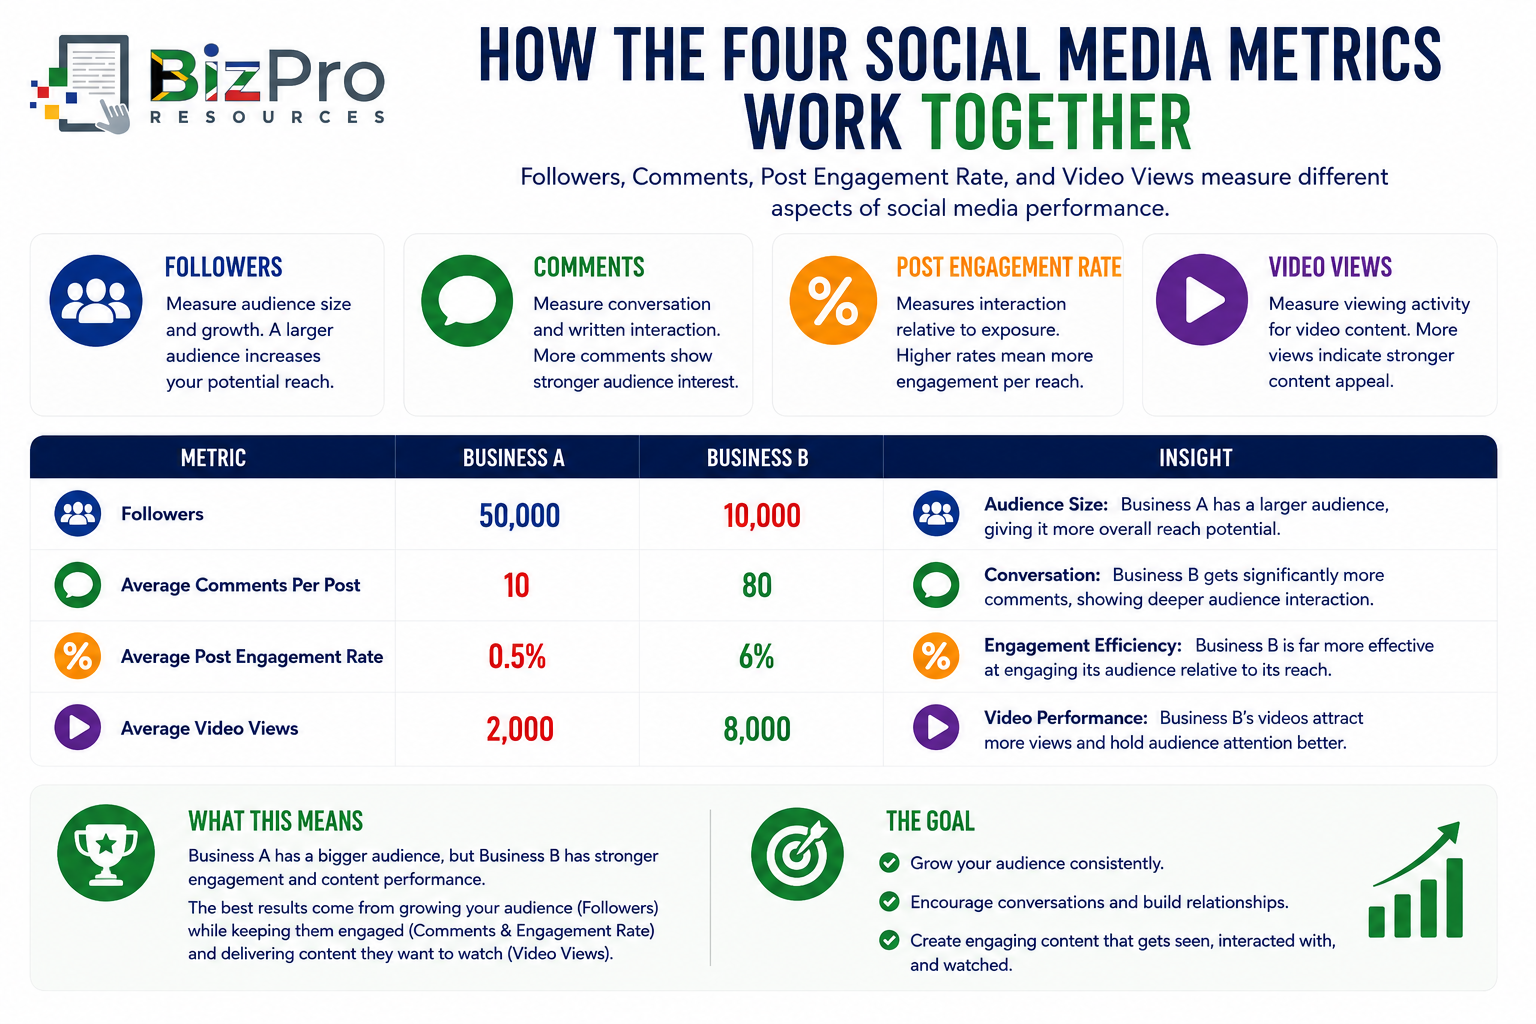
Business A has five times more followers.
If management looks only at audience size, Business A appears much stronger.
But Business B:
Generates more comments.
Has a much stronger engagement rate.
Produces more video views.
Its smaller audience appears significantly more active.
This demonstrates an important principle: Audience size and audience quality are not the same thing.
Connect Social Media Metrics to Business Outcomes
Social media performance should eventually connect to broader marketing objectives.
A useful journey might look like:
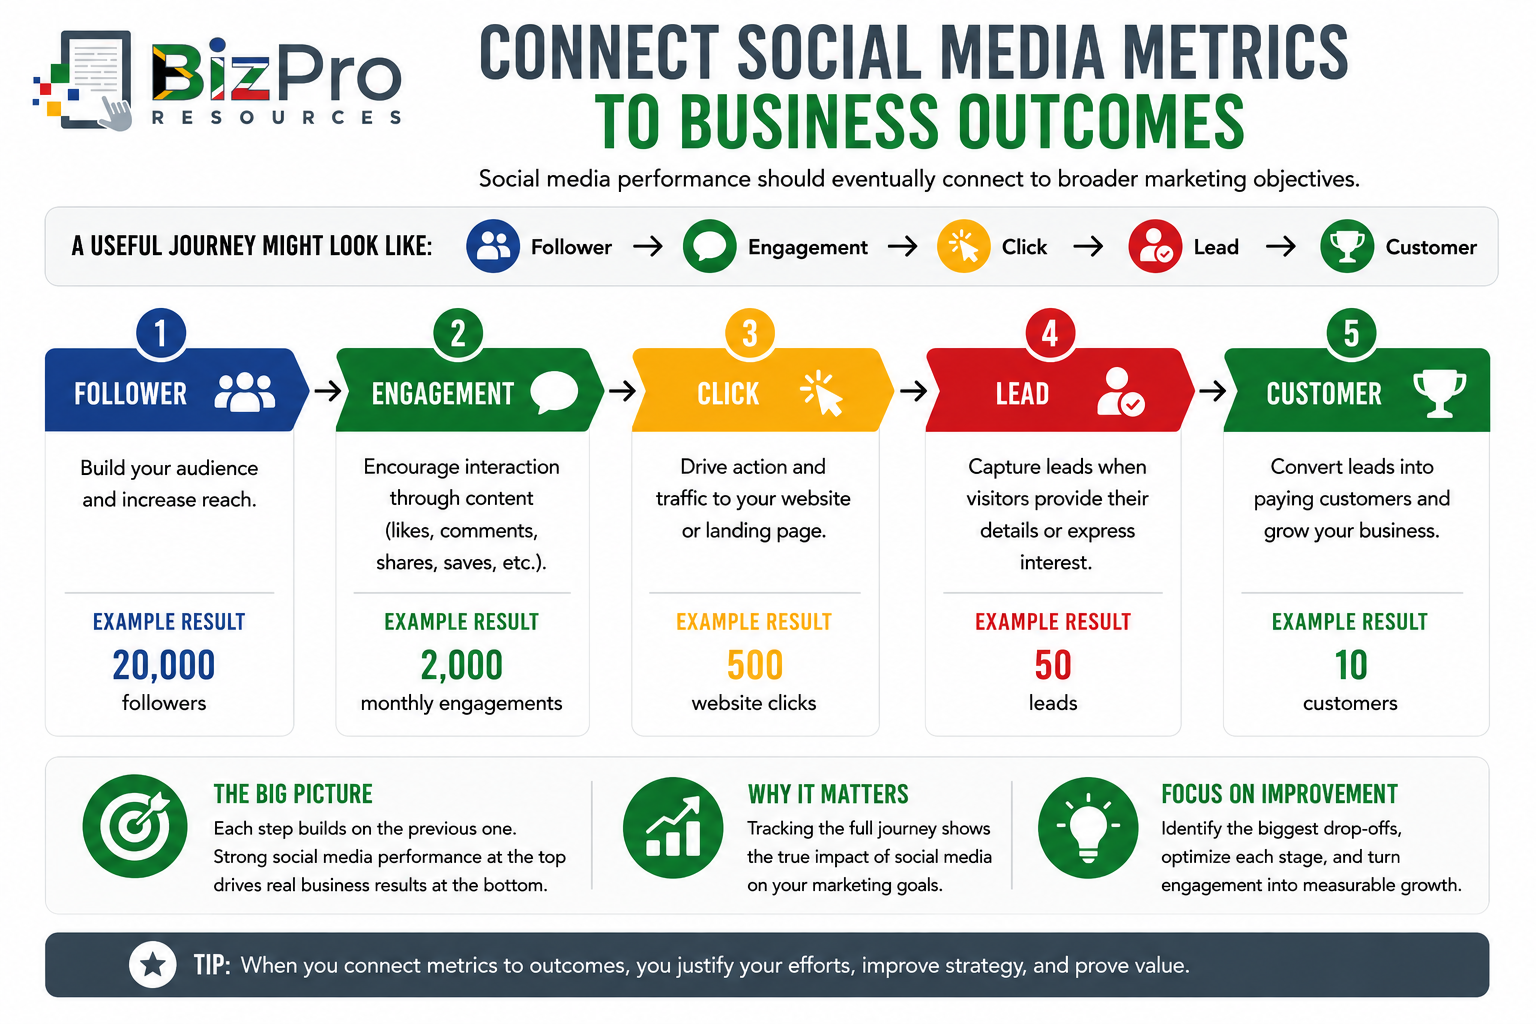
Now management can begin connecting social media activity to commercial outcomes.
Without this connection, a business may spend enormous amounts of time creating content while having little understanding of whether the activity contributes to business growth.
Do Not Treat Every Social Media Platform the Same
Different platforms encourage different behaviours.
For example:
LinkedIn may be particularly useful for professional and B2B content.
Instagram may perform strongly for visual products and services.
Facebook may support community interaction, advertising, and broad consumer audiences.
TikTok may favour short-form video discovery.
YouTube can support longer educational and searchable video content.
The same business may therefore see very different:
Follower growth.
Comment behaviour.
Engagement rates.
Video views.
Management should avoid blindly comparing numbers across platforms.
Instead ask: Is this platform helping us reach the audience and achieve the objective we selected it for?
Segment Social Media Performance by Content Type
One of the most useful analyses is comparing different types of content.
For example:
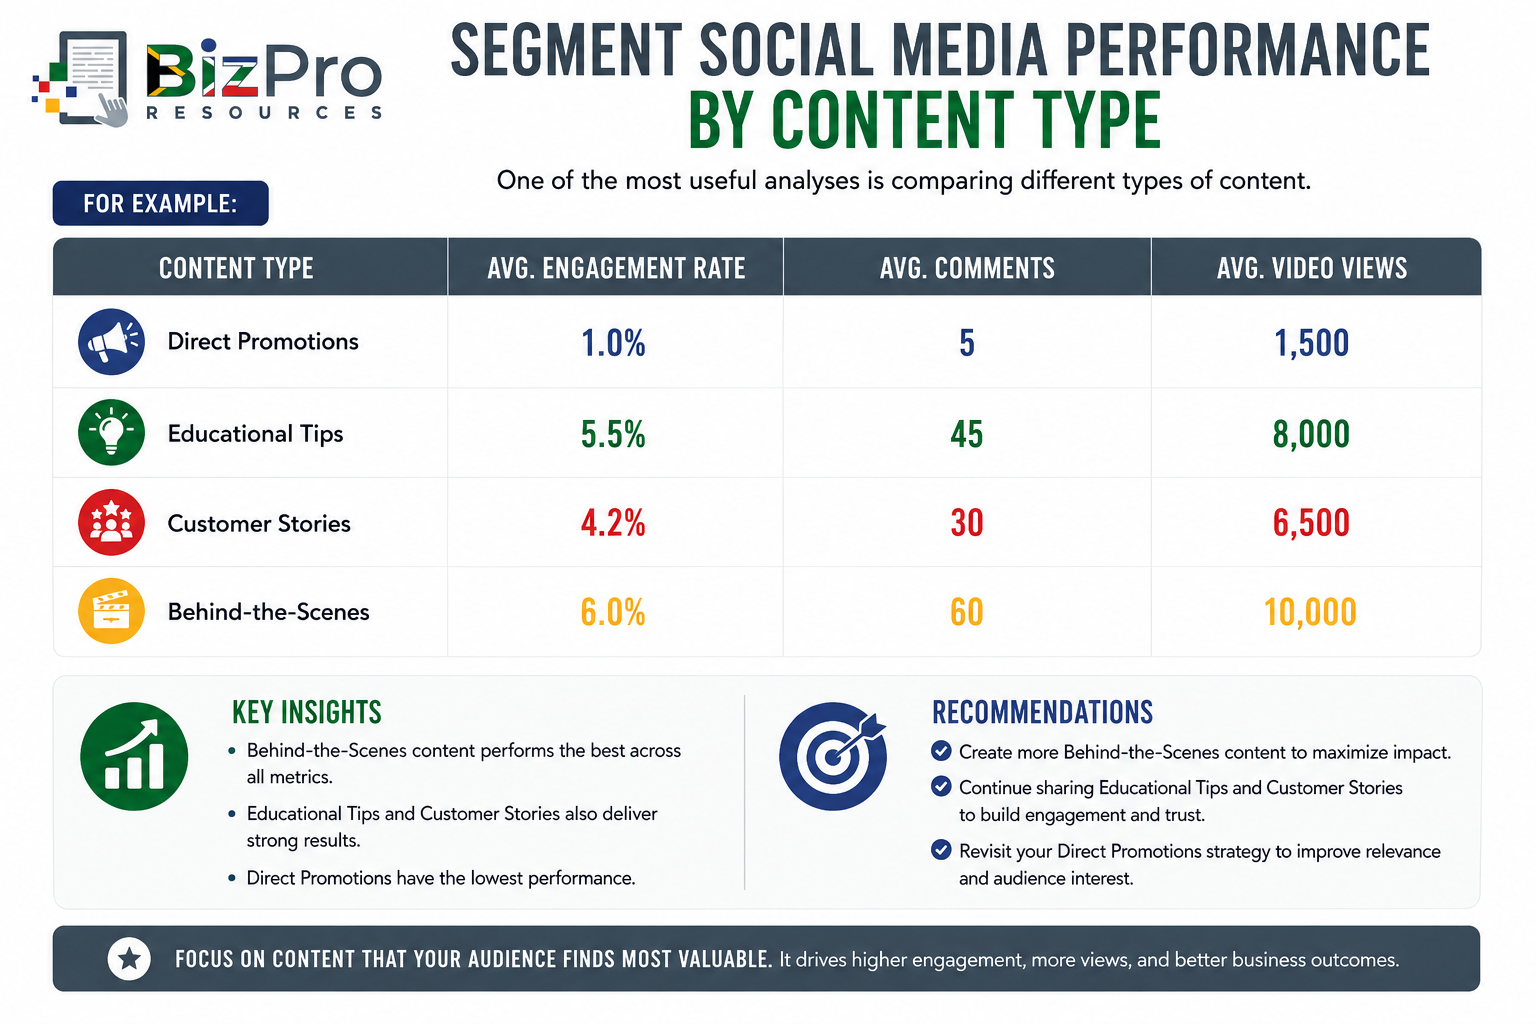
This immediately tells management something important.
Perhaps the audience responds much more strongly to useful and human content than direct advertising.
The company can use this information to improve its content strategy.
Build a Simple Social Media Dashboard
A small business can track these metrics in a monthly dashboard.
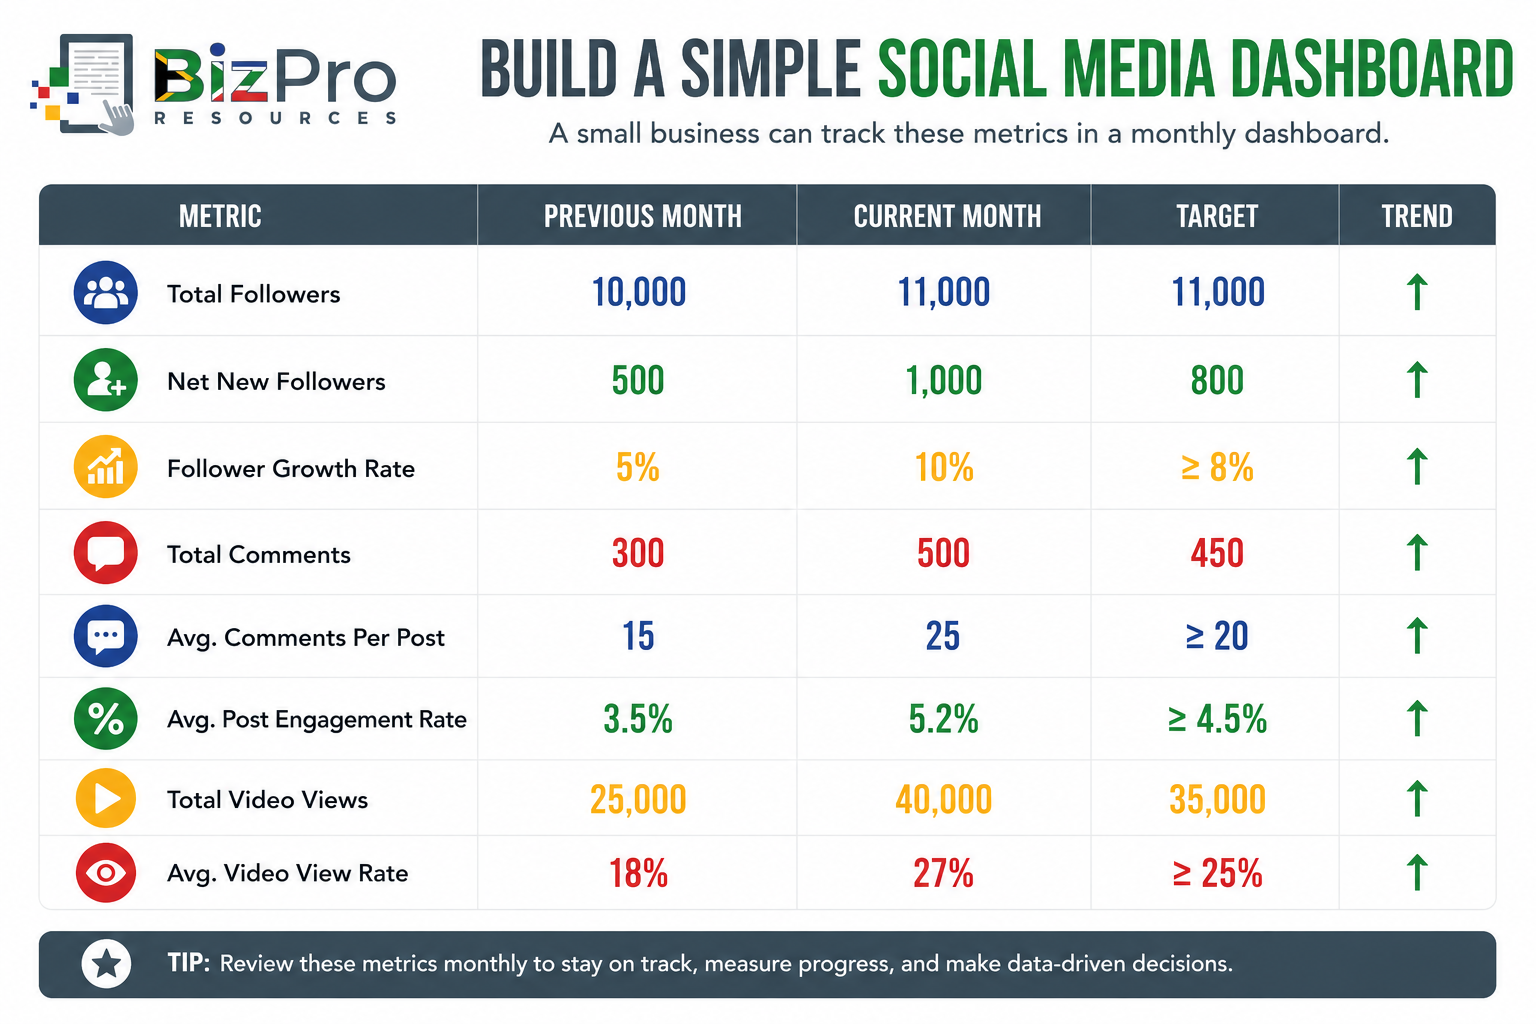
The exact targets should be based on the company's objectives and historical performance rather than arbitrary universal benchmarks.
Watch the Trend, Not Just the Number
One month of data rarely tells the complete story.
Suppose Post Engagement Rate is:
January: 6.0%
February: 5.5%
March: 4.8%
April: 3.9%
May: 3.1%
Each individual number might still look acceptable.
But the trend is clearly downward.
Management should investigate before performance deteriorates further.
The same applies to:
Follower growth.
Comments.
Video views.
Engagement.
Trends often reveal problems earlier than isolated numbers.
Avoid Vanity Metric Management
Social media creates many opportunities for vanity metrics.
It feels good to say:
“We reached 500,000 people.”
“We gained 10,000 followers.”
“Our video got 100,000 views.”
Those achievements may be valuable.
But management should keep asking:
Did we reach the right people?
Did they engage?
Did they visit our website?
Did they enquire?
Did they become customers?
Did they create financial value?
A metric becomes useful when it helps management make a better decision.
What Does Good Social Media Performance Look Like?
There is no single follower count, comment number, engagement rate, or video view target that applies to every small business:
A successful local accounting practice does not need millions of followers.
A plumbing business does not need to become a TikTok celebrity.
A security company does not need every video to go viral.
The business needs a relevant audience that supports its marketing and commercial objectives.
Healthy social media performance generally means:
Followers are growing in quality as well as quantity - The audience increasingly includes people relevant to the business.
Comments show meaningful interaction - People ask questions, discuss topics, and provide useful feedback.
Post Engagement Rate shows that content is relevant - A reasonable proportion of the audience interacts with posts.
Video Views show that useful video content is attracting attention - And most importantly:
Social media activity contributes to broader marketing and business objectives.
Turning Social Media Metrics into Action
Metrics should lead to decisions.
If Follower Growth is poor, investigate:
Content quality.
Posting frequency.
Audience relevance.
Content topics.
Platform suitability.
If Comments are poor, investigate:
Whether posts encourage conversation.
Whether topics are relevant.
Whether content is too promotional.
Whether the business responds to its audience.
If Post Engagement Rate is poor, investigate:
Content format.
Visual quality.
Headlines.
Audience targeting.
Calls-to-action.
Topic relevance.
If Video Views are poor, investigate:
Opening seconds.
Video length.
Thumbnail.
Topic.
Format.
Audience targeting.
Platform suitability.
Then:
Test something different.
Measure the result.
Compare it with previous performance.
Keep improving.
The process should remain:
Measure → Investigate → Act → Measure Again
Final Thoughts
Social media can create powerful opportunities for small businesses, but only if management looks beyond impressive-looking numbers:
A large follower count does not automatically mean a valuable audience.
Many comments do not automatically mean customers are happy.
A high engagement rate does not automatically mean the business is profitable.
Thousands of video views do not automatically mean people watched the whole video.
Each metric tells only part of the story:
Social Media Followers tell you about the size and growth of your potential audience.
Comments tell you how much written conversation your content generates and what people are saying.
Post Engagement Rate tells you how strongly people interact with individual posts relative to their exposure.
Video Views tell you how much viewing activity your video content generates.
Used together, these metrics help a business understand whether its social media audience is simply getting bigger or actually becoming more active, relevant, and valuable.
The objective should not be to win a popularity contest.
The objective should be to build a social media presence that attracts the right people, earns attention, encourages meaningful interaction, builds trust, and ultimately supports the growth of the business.
Related Articles in the Marketing Performance Metrics Series
Marketing Financial Metrics: ROI, CAC, CLV, and ROAS Explained
Marketing Conversion and Lead Metrics: CVR, CPL, and MQL Explained
Marketing Traffic and Engagement Metrics: CTR, Bounce Rate, and Engagement Rate Explained
Social Media Metrics: Followers, Comments, Engagement Rate, and Video Views Explained
SEO Metrics: Page Views, CTR, Domain AUthority, Organic Traffic, and Keyword Rankings Explained
Email Marketing Metrics: CTOR, Engagement, Website Traffic, Bounce Rate, and CTR Explained
AI Disclaimer
AI Tools were used to assist with research. Remember to always cross-check everything that you read.


