
Marketing Financial Metrics: ROI, CAC, CLV, and ROAS Explained
Article #1 of #7 in the Marketing Performance Metrics Series
Introduction
Marketing can generate attention, enquiries, website visits, social media followers, and new customers. But ultimately, every small business owner needs to answer a more important question:
Is our marketing creating enough financial value to justify what we are spending?
This is where financial and value marketing metrics become important.
A campaign can look successful on the surface while performing poorly financially. For example, a Facebook campaign might generate thousands of views and hundreds of clicks. But if very few of those people become paying customers, the campaign may still be wasting money.
Similarly, a marketing campaign with a relatively high cost per new customer may actually be extremely profitable if those customers continue buying from the business for several years.
Four particularly useful metrics for understanding the financial value of marketing are:
Return on Investment (ROI)
Customer Acquisition Cost (CAC)
Customer Lifetime Value (CLV)
Return on Ad Spend (ROAS)
These metrics should not be viewed separately. Together, they help answer four important questions:
ROI: Are we making enough money from our investment?
CAC: How much does it cost us to win a new customer?
CLV: How much is a customer worth to us over time?
ROAS: How much revenue are our advertisements generating compared with what we spend on them?
For a South African small business with a limited marketing budget, understanding these numbers can make the difference between spending money on marketing and investing money in marketing.
1. Return on Investment (ROI)
What Is Return on Investment?
Return on Investment, usually called ROI, measures the financial return generated by an investment compared with the cost of making that investment.
ROI can be used throughout a business, but in marketing it is commonly used to evaluate whether marketing activities are producing enough financial benefit to justify their cost.
For example, a business might invest in:
Google Ads
Facebook and Instagram advertising
A new website
Search engine optimisation
Flyers and brochures
Email marketing
Sponsorships
Trade shows
A marketing agency
Promotional campaigns
The important question is not simply: Did the marketing generate sales?
The better question is: Did the financial return justify what we invested?
A campaign that costs R20,000 and generates R25,000 of benefit has produced a positive result, but it may not necessarily be a particularly attractive investment.
ROI puts the result into perspective.
How Is ROI Calculated?
A simple ROI formula is: ROI = (Return from Investment − Cost of Investment) ÷ Cost of Investment × 100
For example, assume a business spends R20,000 on a marketing campaign and calculates that the campaign generated R30,000 in financial return above the relevant costs.
The calculation would be: ROI = (R30,000 − R20,000) ÷ R20,000 × 100 = 50%
This means the business generated a 50% return relative to the original investment.
There is an important warning when using marketing ROI. Businesses need to be consistent about what they mean by return. Revenue is not the same as profit.
If a company spends R10,000 on advertising and generates R30,000 in sales, it should not automatically claim that it made R20,000 profit. The company may still need to pay for stock, materials, labour, delivery, commissions, payment processing, and other costs associated with those sales.
For this reason, businesses should clearly define which financial measure they are using when calculating marketing ROI.
Example of Poor ROI
Imagine a small Johannesburg plumbing company runs a three-month digital marketing campaign.
The campaign costs:
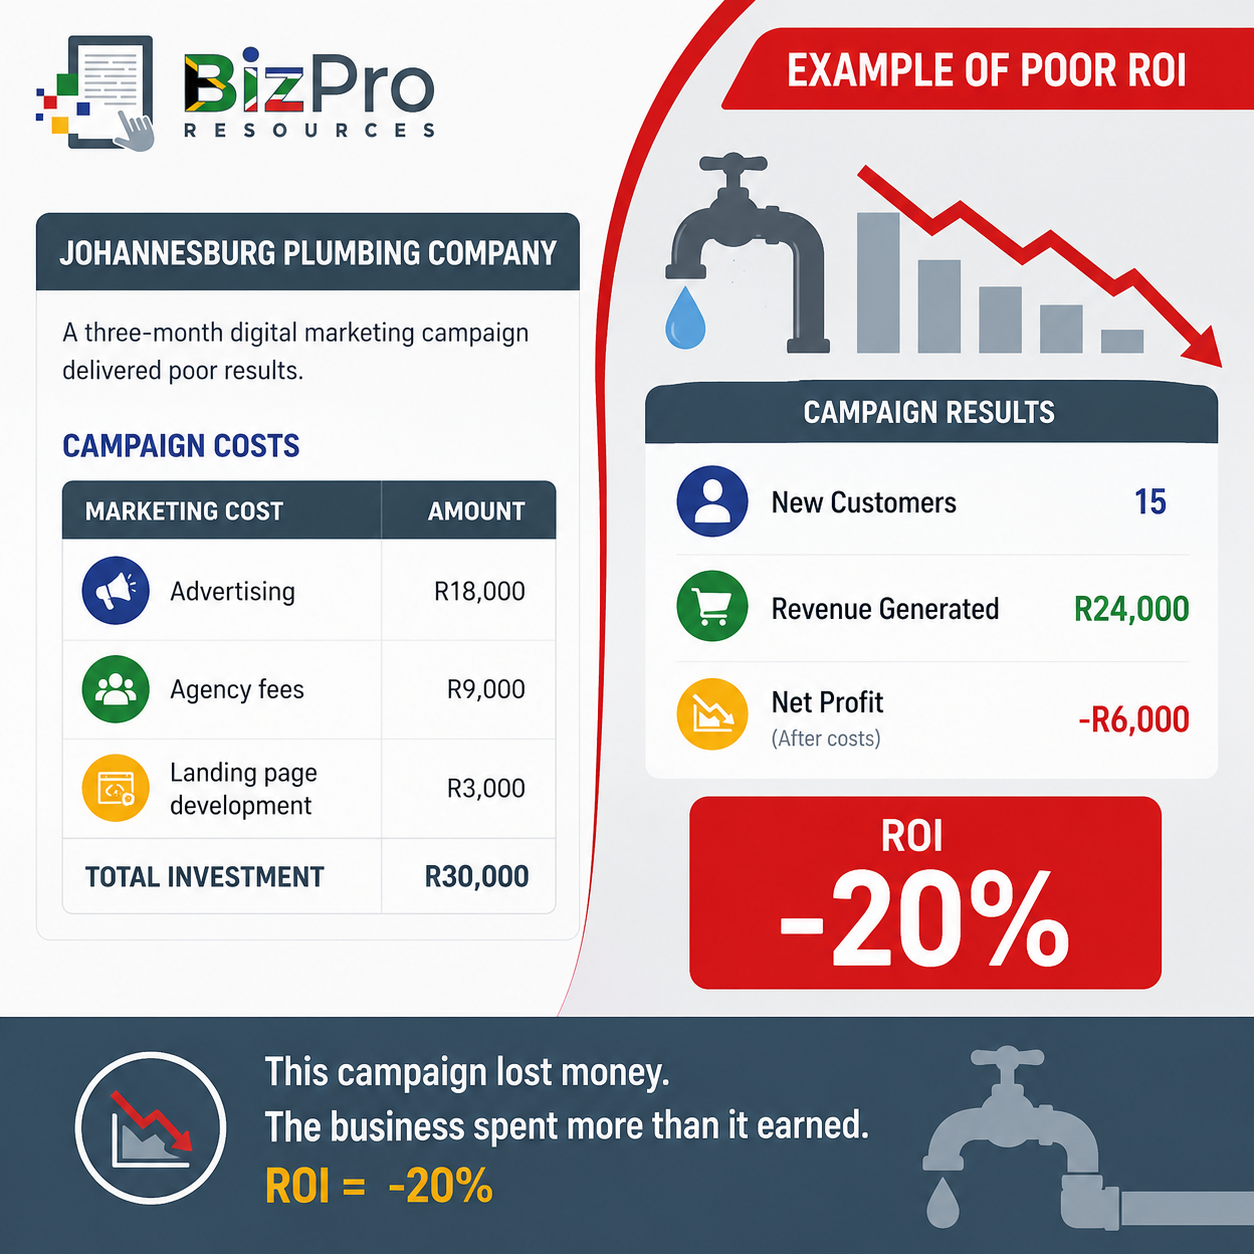
After accounting for the relevant costs associated with the work generated by the campaign, management calculates that the financial return attributable to the campaign was R24,000.
The ROI is: ROI = (R24,000 − R30,000) ÷ R30,000 × 100 = −20%
The company has a negative ROI of 20%.
What Does Poor ROI Mean for the Company?
A negative ROI means the business received less financial value from the investment than it spent.
Management should investigate why.
Possible causes include:
Advertising is targeting the wrong audience.
Leads are too expensive.
The sales team is failing to convert enquiries.
The offer is not competitive.
Marketing costs are too high.
Customers generated by the campaign are purchasing low-margin services.
The campaign is being measured over too short a period.
The business is not tracking customers accurately.
The answer should not automatically be to stop all marketing.
ROI tells management that there is a problem. Further investigation is required to determine where the problem is.
Example of Good ROI
Now assume the plumbing company improves its targeting, landing page, quotation follow-up process, and campaign management.
The next campaign costs R30,000 again.
This time, the calculated financial return is R60,000.
ROI = (R60,000 − R30,000) ÷ R30,000 × 100 = 100%
The business has generated a 100% ROI.
What Does Good ROI Mean for the Company?
A strong positive ROI indicates that the marketing investment is creating financial value. Management can now investigate whether the successful campaign can be scaled.
For example: If we increase the marketing investment from R30,000 to R45,000, can we achieve a similar return?
This is an important question because marketing performance does not always scale proportionally.
A campaign may perform extremely well at R10,000 per month but become less efficient at R50,000 per month.
ROI therefore needs to be monitored continuously.
2. Customer Acquisition Cost (CAC)
What Is Customer Acquisition Cost?
Customer Acquisition Cost, or CAC, measures how much a business spends to acquire one new customer.
It answers a very practical question: How much are we paying to win each new customer?
CAC is particularly important for businesses that spend significant amounts on marketing and sales.
A business might be generating many new customers, but if each customer costs too much to acquire, growth can actually damage profitability.
CAC helps management determine whether its customer acquisition process is financially sustainable.
How Is CAC Calculated?
A simple formula is: CAC = Total Sales and Marketing Acquisition Costs ÷ Number of New Customers Acquired
Suppose a business spends R40,000 during a month on marketing and sales activities aimed at acquiring new customers.
During that month, it acquires 80 new customers: CAC = R40,000 ÷ 80 = R500.
The company therefore spends an average of R500 to acquire each new customer.
The calculation should include the relevant costs involved in customer acquisition.
Depending on the business, these could include:
Advertising
Marketing agency fees
Sales commissions
Marketing software
Promotional materials
Lead generation services
Campaign production
Sales staff costs
Marketing staff costs
The business should decide which costs it includes and then apply the same method consistently.
Example of Poor CAC
Imagine an accounting practice spends R60,000 during a campaign to acquire new small-business clients.
It wins 20 new clients.
CAC = R60,000 ÷ 20 = R3,000 per customer
Is R3,000 good or bad? That cannot be determined from CAC alone.
Suppose the average new client only generates R2,000 in gross profit before leaving the practice.
The company is effectively spending R3,000 to acquire a customer that produces only R2,000 in gross profit.
That is not sustainable.
What Does Poor CAC Mean for the Company?
An excessively high CAC may indicate problems such as:
Advertising costs are too high.
Too few leads are converting.
The business is targeting unsuitable prospects.
The sales process is inefficient.
Too much money is being spent on channels that produce few customers.
Customers are not valuable enough to justify the acquisition cost.
High CAC can create a dangerous situation for a growing business.
The company may proudly report: “We gained 100 new customers this quarter.”
But if acquiring those customers costs more than the economic value they create, the company may actually become less profitable as it grows.
Example of Good CAC
Suppose the accounting practice improves its referral programme, digital advertising, website conversion process, and sales follow-up.
It now spends R60,000 and acquires 60 new customers.
CAC = R60,000 ÷ 60 = R1,000 per customer
Assume the average new customer produces R8,000 in gross profit over the relationship with the practice. The business is spending R1,000 to acquire a customer capable of generating R8,000 in gross profit.
This is a much healthier position.
What Does Good CAC Mean for the Company?
A sustainable CAC suggests that the business has an efficient method of attracting new customers relative to the value those customers create.
It may allow the business to invest more confidently in growth.
But management should never celebrate a low CAC without looking at customer quality.
Extremely cheap customers who make one tiny purchase and never return may be less valuable than expensive customers who remain loyal for years.
That is why CAC becomes far more useful when it is compared with Customer Lifetime Value.
3. Customer Lifetime Value (CLV)
What Is Customer Lifetime Value?
Customer Lifetime Value, usually abbreviated as CLV or sometimes CLTV, estimates the financial value that an average customer generates during their relationship with the business.
Instead of asking: “How much did this customer buy today?”
CLV asks: “How much could this customer be worth during the entire relationship?”
This is particularly important for businesses where customers purchase repeatedly.
Examples include:
Accounting practices
Security companies
IT support companies
Medical practices
Subscription businesses
Vehicle servicing businesses
Maintenance companies
Online retailers
Professional service providers
A customer who initially spends only R500 might eventually be worth tens of thousands of rand if they remain with the business for several years.
How Is CLV Calculated?
There are several ways to calculate CLV, ranging from very simple calculations to sophisticated financial models.
A useful simplified formula is: CLV = Average Customer Value per Period × Average Customer Lifespan
For example, suppose an IT support company earns an average of R1,500 per month from a customer.
The average customer stays for 36 months: CLV = R1,500 × 36 = R54,000
This produces a revenue-based lifetime value of R54,000.
However, revenue-based CLV has an important limitation.
The company does not keep all R54,000 as profit.
A more financially meaningful calculation can incorporate gross margin: CLV = Average Revenue per Period × Gross Margin % × Average Customer Lifespan
If the R1,500 monthly revenue carries a 50% gross margin: CLV = R1,500 × 50% × 36 = R27,000.
This tells management that the estimated lifetime gross profit contribution is R27,000.
For decision-making, this may be much more useful than simply saying the customer generates R54,000 in revenue.
Example of Poor CLV
Imagine a vehicle service business attracts customers through discount advertising.
The average customer spends R1,200 per visit and returns only 1.2 times before disappearing.
Using a simple revenue-based calculation: CLV = R1,200 × 1.2 = R1,440
Now suppose the company's CAC is R900.
The business spends R900 to acquire a customer who generates only R1,440 in lifetime revenue.
Once labour, parts, rent, administration, card fees, and other costs are considered, very little value may remain.
What Does Poor CLV Mean for the Company?
Low CLV may indicate:
Customers do not return.
Customer retention is poor.
Customers make small purchases.
Cross-selling is weak.
Upselling is weak.
Customer relationships are short.
Competitors are winning customers away.
The business attracts bargain hunters rather than loyal customers.
Customer experience is poor.
Marketing cannot always solve these problems.
If customers are leaving because service quality is poor, spending more on advertising may simply bring more customers into a business that cannot retain them.
The business therefore needs to investigate the full customer experience.
Example of Good CLV
Suppose the vehicle service business improves customer service, sends maintenance reminders, maintains customer records, offers service plans, and follows up after each visit.
Customers now spend an average of R2,000 per visit and make an average of five purchases during their relationship.
CLV = R2,000 × 5 = R10,000
If CAC remains R900: CAC = R900 = R10,000
The financial relationship between acquisition cost and customer value is now far more attractive.
What Does Good CLV Mean for the Company?
Higher CLV means each customer has greater economic potential.
This can give the business more flexibility when acquiring customers.
For example, Business A may refuse to spend more than R300 acquiring a customer because customers rarely return.
Business B may comfortably spend R1,000 acquiring a customer because customers remain for several years and generate substantial value.
The second business does not necessarily have worse marketing because its CAC is higher.
Its customers may simply be worth much more.
4. Return on Ad Spend (ROAS)
What Is Return on Ad Spend?
Return on Ad Spend, or ROAS, measures how much revenue is generated for every rand spent directly on advertising.
It is particularly useful when comparing advertising campaigns, platforms, or channels.
For example, a business may compare:
Google Ads
Facebook Ads
Instagram Ads
LinkedIn Ads
YouTube Ads
Display advertising
Sponsored listings
ROAS answers: For every R1 we spent on advertising, how much revenue did the advertising generate?
How Is ROAS Calculated?
The formula is: ROAS = Revenue Attributed to Advertising ÷ Advertising Cost.
Suppose a company spends R10,000 on Google Ads. The advertisements generate R50,000 in attributable sales:
ROAS = R50,000 ÷ R10,000 = 5
This can be expressed as: 5:1 ROAS or 500% ROAS.
It means that every R1 spent on advertising generated R5 in revenue.
ROAS Is Not Profit
This distinction is extremely important. A 5:1 ROAS does not mean the business earned R5 profit for every R1 spent.
Suppose a retailer spends R10,000 on advertising and generates R50,000 in sales. That sounds excellent. But perhaps the products sold cost the company R35,000.
Before considering other expenses:
Revenue = R50,000
Cost of Products = R35,000
Advertising = R10,000
Only R5,000 remains before other operating expenses. This is why the required ROAS differs significantly between businesses.
A high-margin consulting company may be profitable at a much lower ROAS than a low-margin retailer.
Example of Poor ROAS
Imagine an online retailer spends R20,000 on social media advertising. The campaign generates R30,000 in sales: ROAS = R30,000 ÷ R20,000 = 1.5.
The campaign has a 1.5:1 ROAS. For every R1 spent on advertising, the company generated R1.50 in revenue. At first glance, the business generated more revenue than it spent on advertising.
But assume the products have a 40% gross margin.
Gross profit on R30,000 revenue is: R30,000 × 40% = R12,000.
The company spent R20,000 on advertising to generate only R12,000 in gross profit before advertising.
The campaign is therefore financially unsustainable on these assumptions.
What Does Poor ROAS Mean for the Company?
Poor ROAS can indicate:
Advertising is reaching the wrong people.
Clicks are too expensive.
Conversion rates are too low.
Advertisements are ineffective.
The website is failing to convert visitors.
Products or services are incorrectly priced.
Average transaction value is too low.
The company has poor gross margins.
Advertising attribution is inaccurate.
Management should investigate the complete path from advertisement to sale.
Example of Good ROAS
Suppose the retailer improves its targeting, advertisements, product pages, checkout process, and remarketing. It spends R20,000 again.
This time, advertising generates R100,000 in sales: ROAS = R100,000 ÷ R20,000 = 5.
The campaign produces a 5:1 ROAS.
If the business maintains a 40% gross margin: Gross Profit = R100,000 × 40% = R40,000.
After the R20,000 advertising cost, R20,000 remains before other relevant operating costs.
This is a much stronger position.
What Does Good ROAS Mean for the Company?
Strong ROAS indicates that advertising is generating significant revenue relative to advertising expenditure.
Management can investigate whether:
The campaign should receive more budget.
The successful advertisement can be expanded.
Similar audiences can be targeted.
The campaign can run for longer.
Less effective campaigns should have budget redirected to this campaign.
But ROAS should never be viewed in isolation. A campaign with a 6:1 ROAS is not automatically better than one with a 4:1 ROAS.
For example, the 6:1 campaign may generate R6,000 from R1,000 of advertising, while the 4:1 campaign generates R400,000 from R100,000.
Scale, margins, customer quality, repeat purchases, and profitability all matter.
How the Four Metrics Work Together
ROI, CAC, CLV, and ROAS become far more powerful when management considers them together.
Imagine a business has the following marketing results:
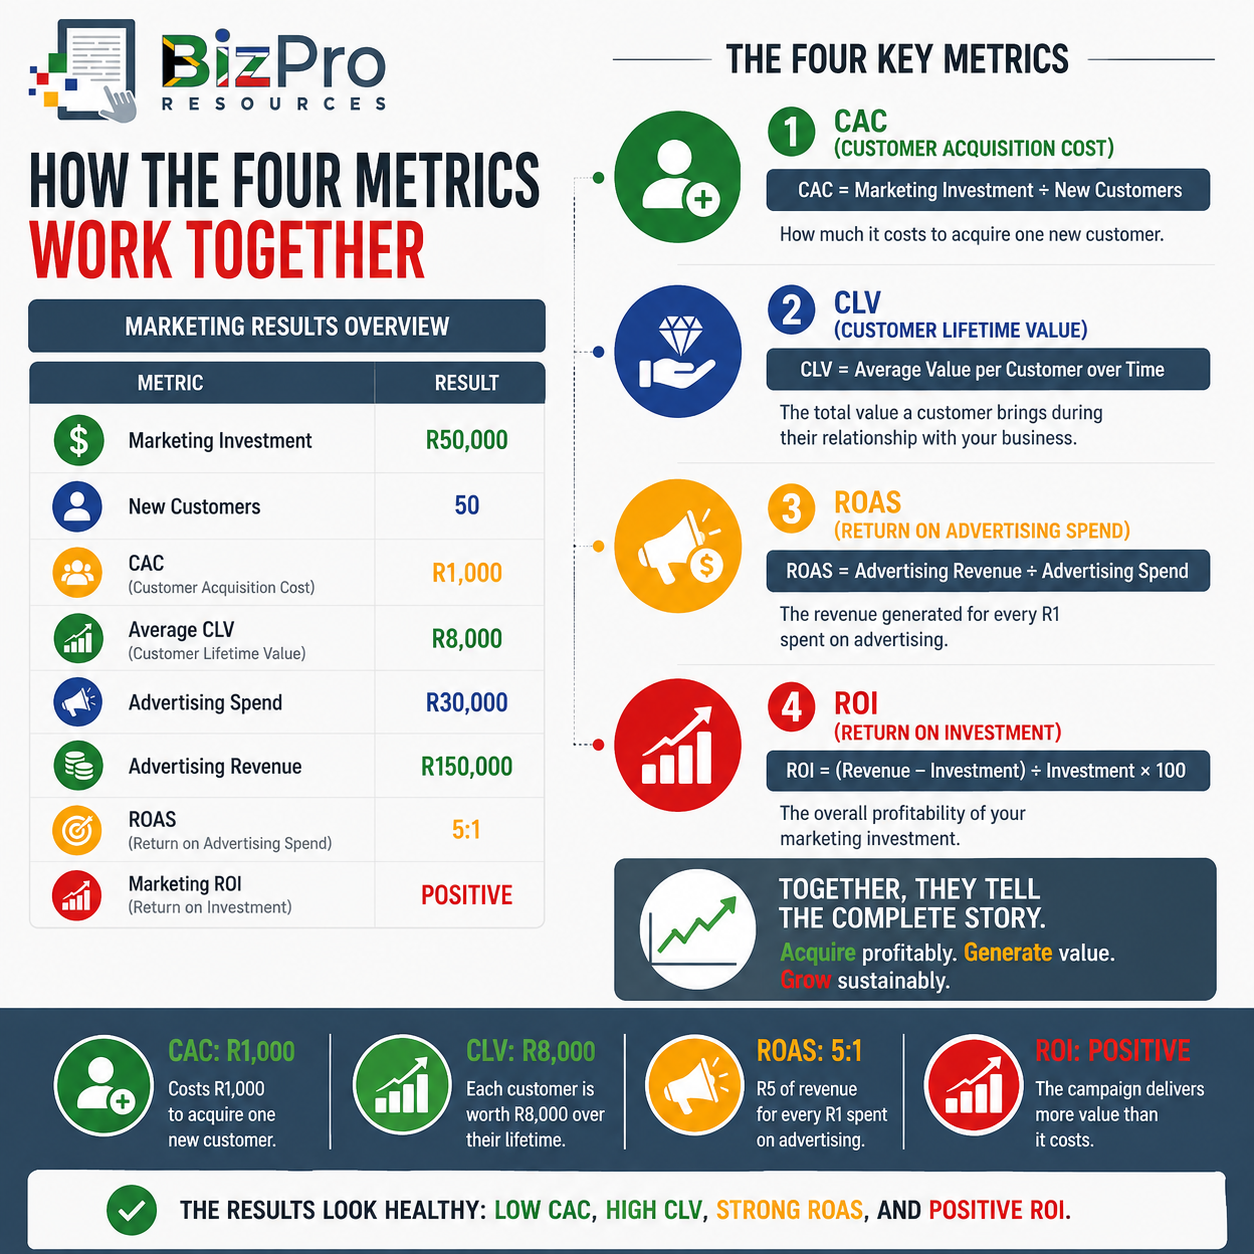
At first glance, this appears healthy:
The company spends R1,000 to acquire a customer with an estimated lifetime value of R8,000.
Its advertising generates R5 of revenue for every R1 of advertising expenditure.
Its overall marketing investment also produces a positive ROI.
Now compare that with another business:
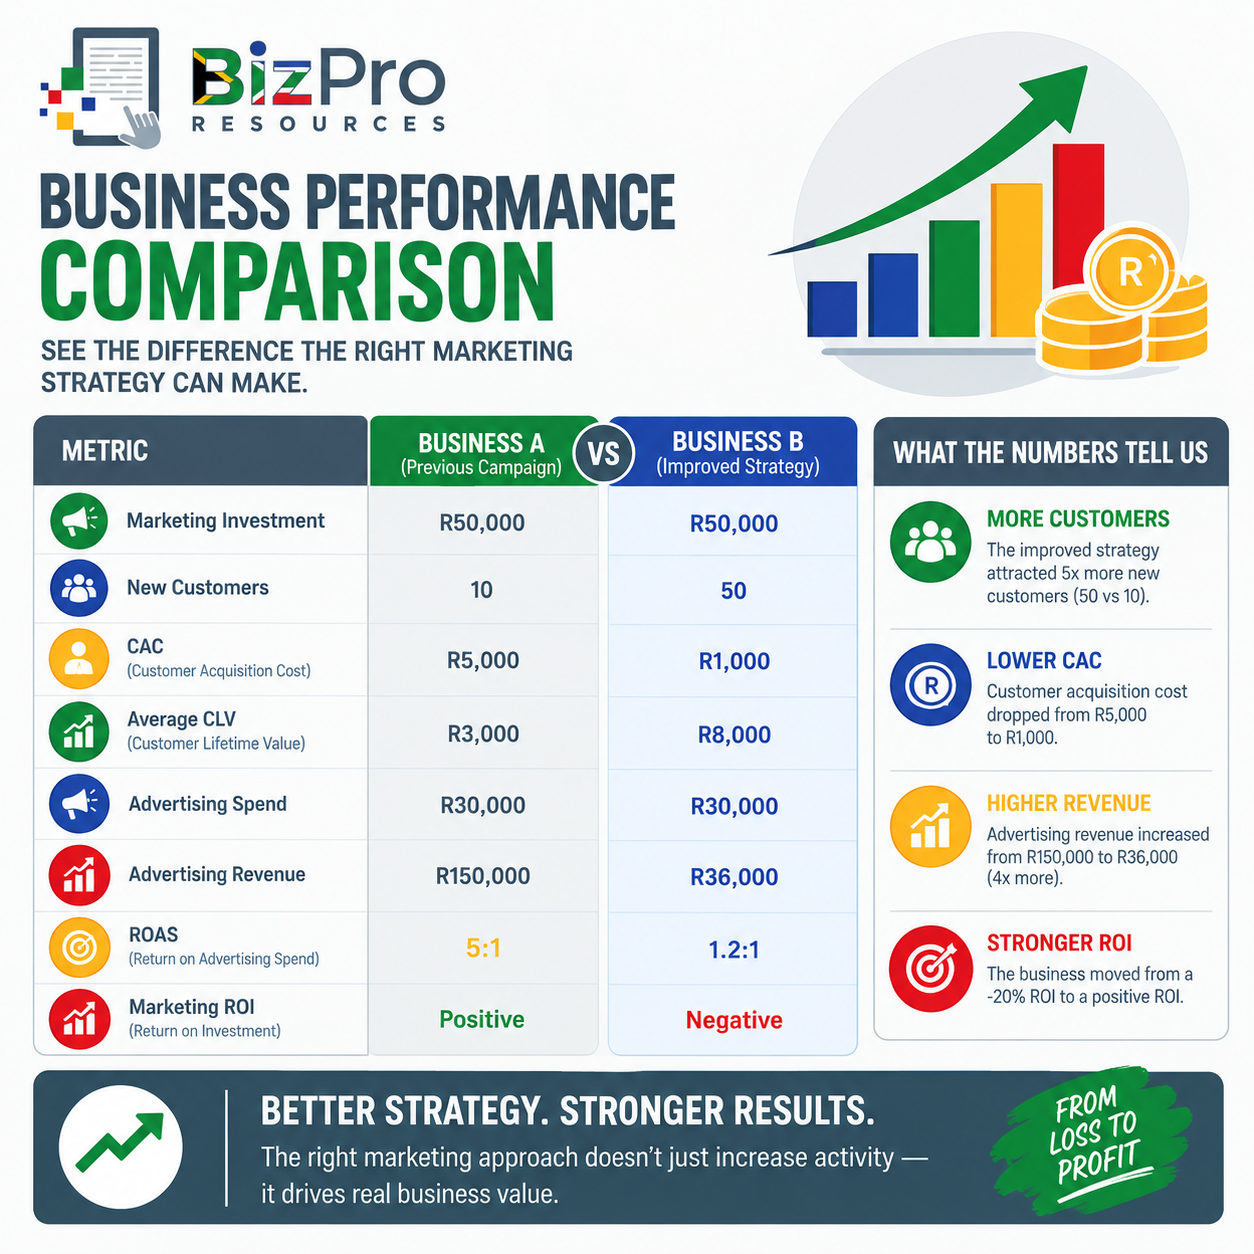
The warning signs are clear. The business is spending R5,000 to acquire customers worth only around R3,000 according to its chosen CLV measure.
Advertising produces only R1.20 in revenue for every R1 spent. Overall marketing ROI is negative.
Management should not simply increase the marketing budget.
It first needs to understand why the economics are failing.
CAC and CLV Should Be Viewed Together
One of the most useful comparisons in marketing is: Customer Lifetime Value versus Customer Acquisition Cost.
Consider two companies.
Company A:
CAC = R500
CLV = R600
At first glance, R500 might sound like a relatively cheap customer acquisition cost.
But the customer is only worth R600.
The economics are extremely tight.
Company B:
CAC = R2,000
CLV = R20,000
Company B spends four times more to acquire a customer. Yet its customers are worth far more.
The R2,000 CAC may therefore be significantly healthier than Company A's R500 CAC.
This demonstrates an important lesson:
A marketing metric rarely tells the complete story on its own.
ROI and ROAS Are Not the Same Thing
ROI and ROAS are sometimes confused, but they answer different questions. ROAS focuses specifically on advertising efficiency.
It asks: How much advertising-attributed revenue did we generate for every rand spent on advertising?
ROI takes a broader financial perspective.
It asks: What financial return did we receive relative to the investment we made?
For example, an advertising campaign might have:
Advertising Spend = R20,000
Advertising Revenue = R100,000
That produces: ROAS = 5:1
But the broader campaign might also include:
R10,000 agency fee
R5,000 photography and video
R5,000 landing page development
R8,000 promotional discount costs
Those additional costs matter when management evaluates the overall financial return.
ROAS can therefore look excellent while overall ROI is much less impressive.
Use each metric for the question it is designed to answer.
Do Not Chase Universal Marketing Benchmarks
Small-business owners often search online for answers such as:
“What is a good ROAS?”
“What should my CAC be?”
“What is a good marketing ROI?”
There is nothing wrong with using industry benchmarks for context, but they should not become automatic targets.
The correct number depends on factors such as:
Gross margin
Customer retention
Average transaction value
Repeat purchases
Industry
Business model
Sales cycle
Fixed costs
Growth strategy
Customer lifetime value
A security company with customers signing three-year contracts has completely different customer economics from a takeaway restaurant.
A law firm acquiring a client for R3,000 may consider that CAC excellent if the average client generates R30,000 in profitable work.
A retailer acquiring a customer for R3,000 may consider the same CAC disastrous if the average customer only spends R1,200.
The best benchmark is therefore often the economics of your own business.
Build a Simple Marketing Financial Dashboard
Small businesses do not necessarily need expensive business intelligence software to monitor these metrics.
A spreadsheet can be enough to start.
A simple monthly dashboard could include:
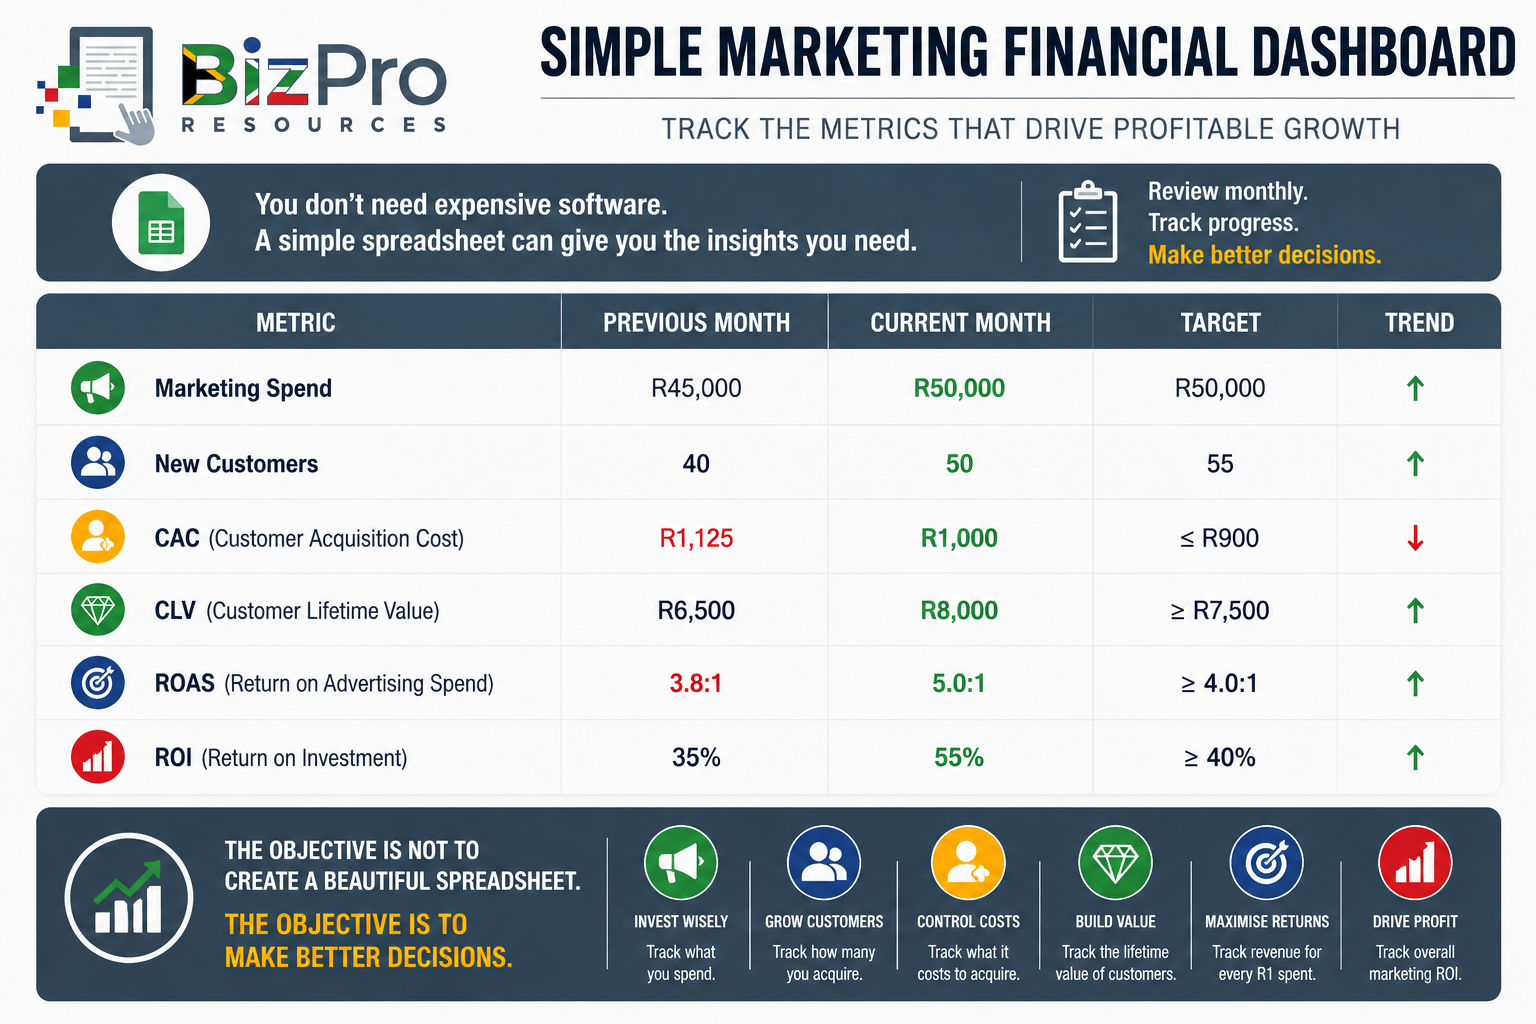
The objective is not to produce a beautiful spreadsheet.
The objective is to make better decisions.
For example:
CAC is falling. Why?
CLV is increasing. What changed?
ROAS suddenly dropped. Which campaign caused it?
ROI improved. Can we repeat what worked?
Metrics become useful when they lead to questions, investigation, and action.
Segment the Numbers
Company-wide averages can hide important information.
Suppose your overall CAC is R1,000. That sounds useful, but consider what happens when you break it down by channel:
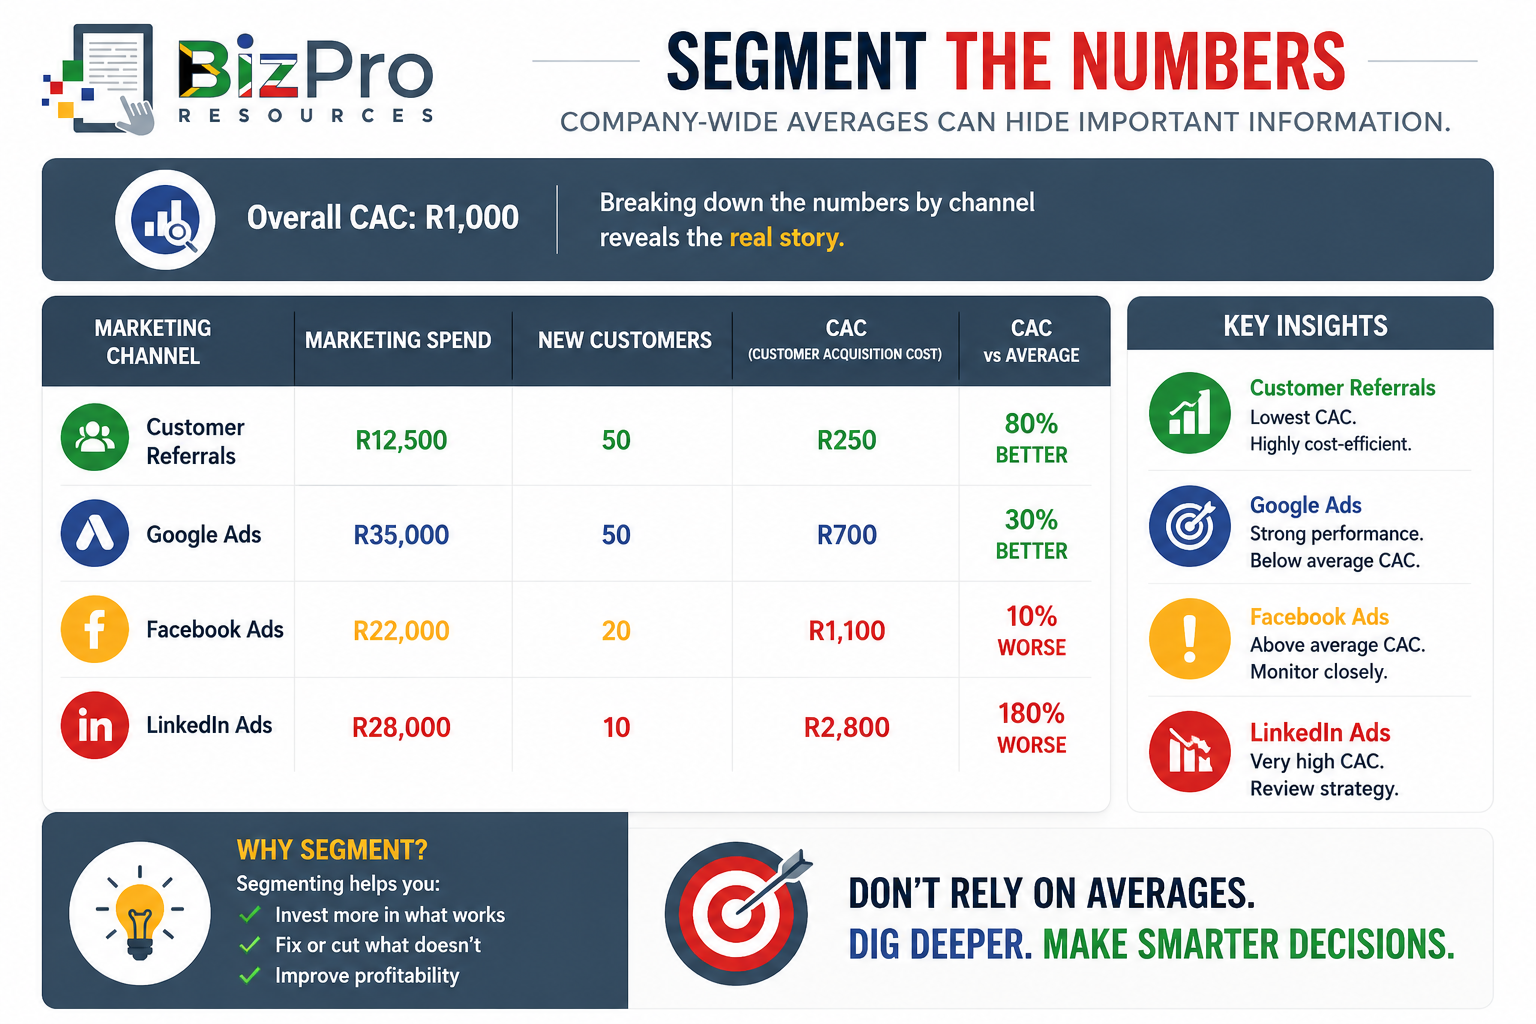
Now management has something actionable.
The same principle applies to CLV.
Perhaps customers acquired through referrals have a CLV of R15,000 while customers acquired through discount campaigns have a CLV of only R3,500.
This suggests that the source of the customer affects the quality and value of the customer.
Whenever possible, analyse financial marketing metrics by:
Marketing channel
Campaign
Product
Service
Customer segment
Location
Salesperson
New versus returning customers
The more accurately you can identify where financial value comes from, the better you can allocate your marketing budget.
Be Careful with Attribution
One of the biggest difficulties in marketing measurement is determining which activity actually caused a sale.
Imagine a customer:
Sees your Facebook advertisement.
Visits your website.
Leaves without purchasing.
Searches your business on Google two weeks later.
Reads your Google reviews.
Receives a recommendation from a friend.
Calls your business.
Becomes a customer.
Which marketing activity deserves credit?
Facebook?
Google?
Your website?
Customer reviews?
The referral?
The answer may not be simple. This is known as marketing attribution.
Small businesses should avoid pretending that marketing measurement is always perfectly precise.
Instead, use the best available data, apply consistent measurement rules, and improve tracking over time.
What Does Good Financial Marketing Performance Look Like?
Healthy marketing performance is not simply about getting the highest possible number for every metric.
A financially healthy marketing system generally shows that:
ROI is positive and improving: Marketing investment produces sufficient financial return.
CAC is controlled.: The business can acquire customers at a cost that makes economic sense.
CLV comfortably supports CAC: Customers create substantially more value than it costs to acquire them.
ROAS supports the economics of the business: Advertising produces enough revenue relative to ad spend, considering the company's margins and other costs.
Most importantly, these metrics should work together:
You do not want cheap customers who create no long-term value.
You do not want impressive advertising revenue that produces no profit.
You do not want rapid customer growth that consumes cash faster than customers create value.
And you do not want an apparently excellent ROI calculation based on incomplete or misleading numbers.
Turning Financial Marketing Metrics into Action
Measurement is only useful when it changes decisions:
If ROI is poor, investigate whether marketing costs are too high, margins are too low, or campaigns are producing the wrong type of customer.
If CAC is rising, investigate advertising costs, conversion rates, targeting, sales performance, and acquisition channels.
If CLV is falling, investigate customer retention, customer satisfaction, purchasing frequency, pricing, cross-selling, and service quality.
If ROAS is falling, investigate campaign targeting, advertisements, conversion rates, average order value, competition, and advertising costs.
Then make changes.
Test again.
Compare the new results with the old results.
Marketing management should become a continuous cycle:
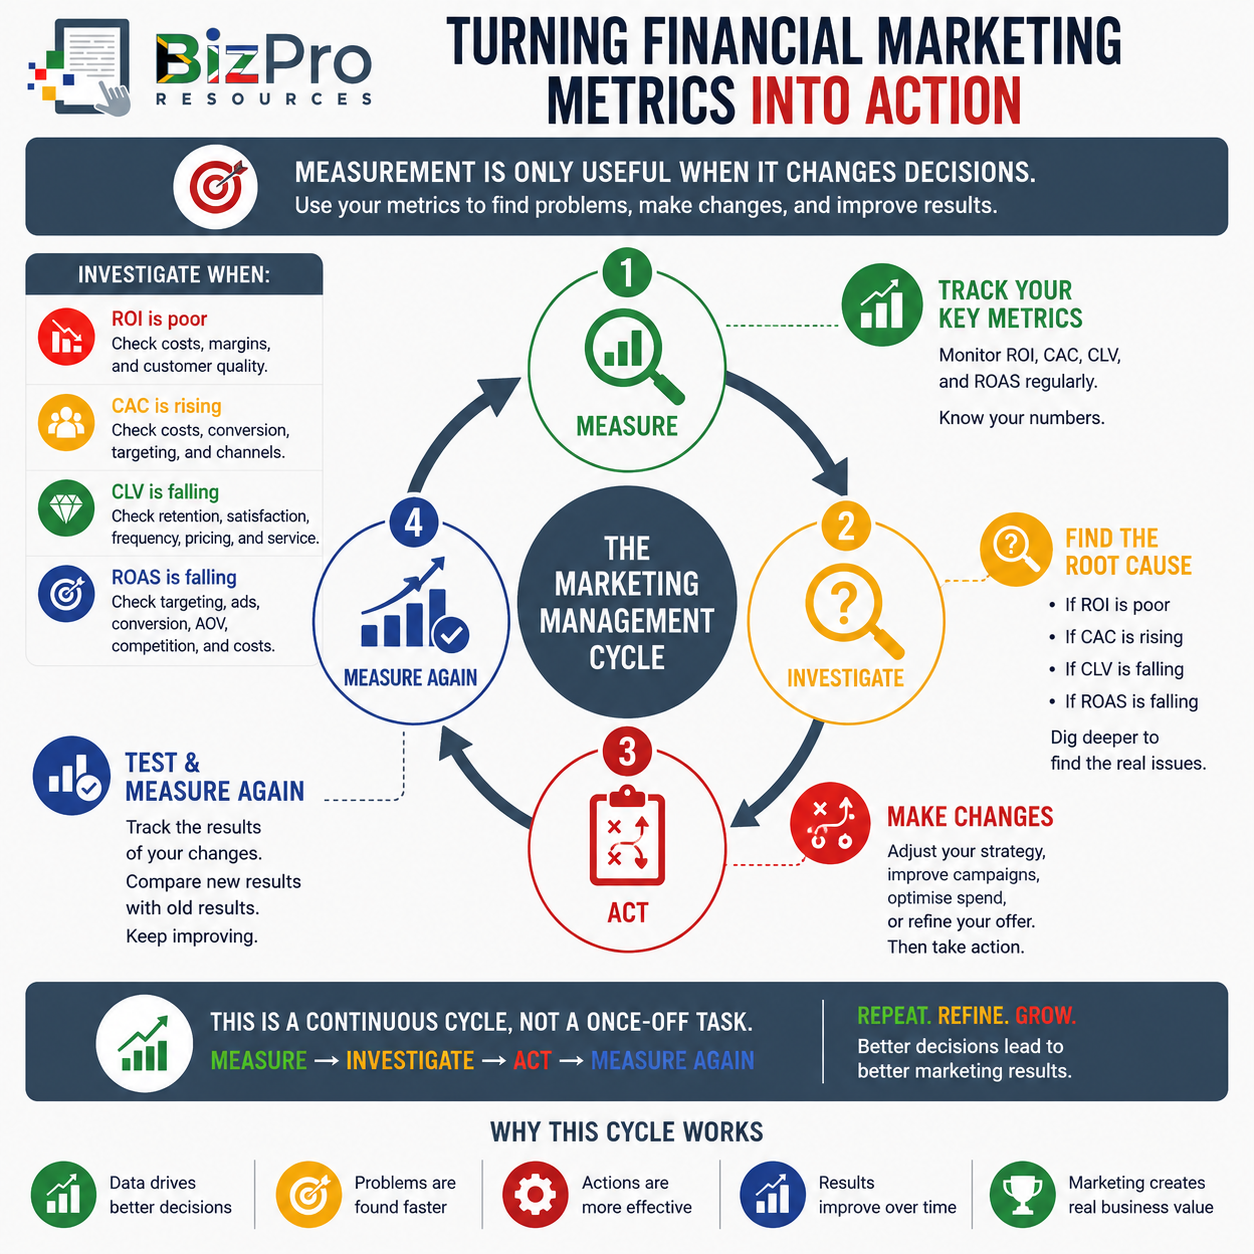
Over time, this allows the business to move away from marketing decisions based mainly on opinion and toward decisions supported by financial evidence.
Final Thoughts
Marketing should not be judged only by how busy it makes the business look:
More followers do not automatically mean more profit.
More website traffic does not automatically mean more customers.
More leads do not automatically mean profitable growth.
Even more sales do not automatically mean better financial performance.
Small-business owners need to understand the economics behind their marketing:
Return on Investment tells you whether the investment is creating sufficient financial return.
Customer Acquisition Cost tells you what you are paying to win each new customer.
Customer Lifetime Value tells you how much financial value customers can create over the relationship.
Return on Ad Spend tells you how efficiently advertising expenditure generates revenue.
When these four metrics are measured consistently and considered together, management gains a much clearer picture of whether marketing is genuinely helping the business grow.
The objective is not simply to spend less on marketing. It is to spend marketing money more intelligently.
Because the most important marketing question is not: “How much did we spend?”
It is: “What financial value did we create from what we spent?”
Related Articles in the Marketing Performance Metrics Series
Marketing Financial Metrics: ROI, CAC, CLV, and ROAS Explained
Marketing Conversion and Lead Metrics: CVR, CPL, and MQL Explained
Marketing Traffic and Engagement Metrics: CTR, Bounce Rate, and Engagement Rate Explained
Social Media Metrics: Followers, Comments, Engagement Rate, and Video Views Explained
SEO Metrics: Page Views, CTR, Domain AUthority, Organic Traffic, and Keyword Rankings Explained
Email Marketing Metrics: CTOR, Engagement, Website Traffic, Bounce Rate, and CTR Explained
AI Disclaimer
AI Tools were used to assist with research. Remember to always cross-check everything that you read.


