

Retention and Workforce Health Metrics: Measuring Employee Stability, Attendance, and Satisfaction
Article #2 of #4 in the HR Performance Metrics Series
Introduction
Recruiting good employees is only the beginning.
Once employees join a business, the next challenge is keeping good people, maintaining reliable attendance, and creating a workplace where employees can perform effectively.
A small business may appear to have a staffing problem without understanding exactly what is happening.
A manager may say:
"People don't stay here very long."
"We are constantly replacing employees."
"Too many people are absent."
"Morale seems low."
"Employees don't seem happy."
"Our best people are starting to leave."
These observations can be important warning signs, but management needs more than impressions.
It needs information.
This is where retention and workforce health metrics become valuable.
Five particularly useful metrics are:
Early Employee Turnover — Less than 12 Months
Employee Turnover Rate
Absenteeism Rate
Employee Net Promoter Score (eNPS)
Employee Satisfaction
Together, these metrics help answer five important questions:
Are new employees staying?
How many employees are leaving overall?
Are employees regularly attending work?
Would employees recommend the business as a place to work?
Are employees satisfied with their working experience?
For a small business, these questions matter because workforce problems quickly become business problems.
High employee turnover increases recruitment and training costs.
Poor attendance disrupts operations.
Low satisfaction can reduce productivity and customer service.
When experienced employees leave, valuable knowledge may leave with them.
Measuring workforce health allows management to identify these problems before they become more serious.
Why Employee Retention Matters
Employees represent a major investment.
Every new employee requires some combination of:
recruitment;
interviewing;
administration;
induction;
training;
supervision;
equipment;
uniforms or PPE;
system access;
management time; and
time to become fully productive.
If the employee leaves shortly afterwards, much of this investment may be lost. The company then has to recruit someone else and start again.
Consider a small plumbing business with 20 employees:
During the year, eight employees leave.
Management may initially think: "People come and go. That's normal."
But eight departures from a workforce of 20 can create significant disruption:
Supervisors spend time training replacements.
Experienced plumbers work with inexperienced assistants.
Overtime increases.
Customers may receive inconsistent service.
Recruitment costs increase.
The remaining employees may become frustrated.
The business therefore needs to understand not only how many employees are leaving, but also when they leave, why they leave, and what the remaining employees think about the workplace.
1. Early Employee Turnover — Less Than 12 Months
What Is Early Employee Turnover?
Early Employee Turnover measures how many employees leave the business relatively soon after being hired.
For this article, we will define early turnover as an employee leaving within their first 12 months of employment.
Some businesses may prefer to measure:
turnover during probation;
turnover within three months;
turnover within six months; or
turnover within 12 months.
The exact period can vary.
What matters is defining the period clearly and measuring it consistently.
Early turnover deserves special attention because it can indicate that something is going wrong during recruitment, onboarding, training, supervision, or the employee's early experience with the company.
How Is Early Employee Turnover Calculated?
A practical formula is: Early Employee Turnover Rate = Number of Employees Who Leave Within 12 Months of Starting ÷ Number of Employees Hired × 100
Suppose a company hires 20 employees:
Within their first 12 months, six leave.
The calculation is: 6 ÷ 20 × 100 = 30%
The company's Early Employee Turnover Rate is therefore: 30%
This means that three out of every ten employees hired did not remain for 12 months.
Example of Poor Early Employee Turnover Performance
Imagine a small security company hires 30 security officers during the year:
Within 12 months of starting, 12 leave.
Early Employee Turnover Rate = 12 ÷ 30 × 100
Early Employee Turnover Rate = 40%
Management investigates further.
It discovers several recurring issues:
employees say working conditions were different from what they expected;
shifts were not clearly explained during recruitment;
induction was rushed;
new employees received inconsistent supervision;
some employees were placed at sites far from where they lived;
communication with supervisors was poor; and
several employees left for slightly higher salaries elsewhere.
What Does This Mean for the Company?
A 40% Early Employee Turnover Rate means that a large part of the company's recruitment effort is being lost.
Possible causes could include:
poor recruitment decisions;
unrealistic job descriptions;
misleading expectations during interviews;
weak onboarding;
inadequate training;
poor supervision;
unsuitable working conditions;
uncompetitive remuneration;
poor job fit; or
a difficult workplace culture.
Early turnover can be particularly expensive because the company may spend money recruiting and training employees who leave before producing enough value to recover that investment.
Example of Good Early Employee Turnover Performance
The security company improves its recruitment and onboarding process.
Candidates now receive clear information about:
shifts;
work locations;
responsibilities;
pay;
overtime arrangements;
uniform requirements; and
performance expectations.
New employees also receive structured induction and regular supervisor check-ins during their first three months.
The following year, 30 employees are hired and only three leave within 12 months:
Early Employee Turnover Rate = 3 ÷ 30 × 100
Early Employee Turnover Rate = 10%
What Does This Mean for the Company?
The improvement may indicate that:
recruitment is producing better matches;
employees understand what they are accepting;
onboarding is more effective;
supervisors are supporting new employees;
expectations are clearer; and
employees are adjusting successfully to the workplace.
The company should still investigate the three departures.
Even when the overall result is good, individual departures may reveal useful information.
2. Employee Turnover Rate
What Is Employee Turnover Rate?
Employee Turnover Rate measures the percentage of employees who leave the organisation during a particular period.
This can include employees who:
resign;
retire;
are dismissed;
reach the end of fixed-term arrangements; or
leave for other reasons.
However, businesses should be careful about combining every type of departure into one number:
A resignation by a high-performing employee is different from a planned retirement.
A dismissal for serious misconduct is different from an employee leaving for a better career opportunity.
Therefore, calculate the overall turnover rate first, but also record why employees leave.
How Is Employee Turnover Rate Calculated?
A common formula is: Employee Turnover Rate = Number of Employees Who Left During the Period ÷ Average Number of Employees During the Period × 100
Average employees can be calculated as: Average Employees = (Employees at Start of Period + Employees at End of Period) ÷ 2
Suppose a business starts the year with 40 employees and ends with 44:
Average workforce: (40 + 44) ÷ 2 = 42
During the year, eight employees leave.
Turnover Rate: 8 ÷ 42 × 100 = 19.05%
The annual Employee Turnover Rate is approximately: 19.1%
Example of Poor Employee Turnover Performance
Consider a small call centre:
Average workforce: 50 employees
Employees who leave during the year: 20 employees
Employee Turnover Rate: 20 ÷ 50 × 100 = 40%
Four out of every ten positions effectively experience a departure during the year.
Management investigates and finds that:
supervisors are inconsistent;
workloads are high;
employees see limited opportunities for development;
salary complaints are common;
employees feel that good performance is not recognised; and
several strong performers have moved to competitors.
What Does This Mean for the Company?
High turnover can create:
repeated recruitment costs;
repeated training costs;
loss of experience;
lower productivity;
additional pressure on remaining employees;
increased overtime;
inconsistent customer service;
management distraction; and
damage to team morale.
However, high turnover should not automatically be treated as proof of poor management.
Some industries and occupations naturally experience more employee movement than others.
The important questions are:
Who is leaving?
Why are they leaving?
Is turnover increasing?
Are we losing employees we wanted to keep?
Example of Good Employee Turnover Performance
The call centre introduces several improvements:
Supervisors receive management training.
Employees receive clearer performance feedback.
Career development opportunities are explained.
Recognition for strong performance improves.
Management also conducts exit interviews to understand why people leave.
During the following year:
Average workforce: 52 employees
Employees leaving: 6 employees
Employee Turnover Rate: 6 ÷ 52 × 100 = 11.5%
What Does This Mean for the Company?
The lower turnover rate may indicate improved workforce stability.
The company may benefit from:
more experienced employees;
lower recruitment costs;
lower training costs;
stronger teams;
better customer relationships; and
greater operational stability.
But the company should not try to achieve zero turnover.
Some turnover is normal.
Employees retire, relocate, change careers, pursue opportunities elsewhere, or may not be suitable for the organisation.
The objective is not necessarily zero turnover.
The objective is to understand turnover and prevent unnecessary or damaging turnover.
3. Absenteeism Rate
What Is Absenteeism Rate?
Absenteeism Rate measures how much scheduled working time is lost because employees are absent from work.
Employee absence can happen for legitimate reasons:
Employees become ill.
Family emergencies happen.
Employees may have authorised leave or other valid reasons for being away from work.
The purpose of an Absenteeism Rate is therefore not to assume that every absence represents misconduct.
Instead, it helps management identify patterns and understand the operational effect of absence.
For example:
Is absenteeism increasing?
Does one department have significantly higher absence than another?
Are Mondays or Fridays particularly problematic?
Are certain shifts experiencing repeated absence?
Is workload or workplace stress contributing?
Are there safety or working-condition problems?
The metric provides a starting point for investigation.
How Is Absenteeism Rate Calculated?
A simple formula is: Absenteeism Rate = Total Days Lost to Absence ÷ Total Available Workdays × 100
Suppose a company has 25 employees:
During a particular month, each employee is scheduled to work 20 days.
Total available workdays: 25 × 20 = 500 days
Employees are absent for a combined total of 25 days.
Absenteeism Rate: 25 ÷ 500 × 100 = 5%
The company's Absenteeism Rate for the month is: 5%
Example of Poor Absenteeism Performance
Imagine an automotive workshop with 15 employees.
During one month:
Total available employee workdays: 300 days
Days lost to absence: 30 days
Absenteeism Rate: 30 ÷ 300 × 100 = 10%
Management notices that several technicians are regularly absent.
This causes:
customer bookings to be moved;
overtime for other technicians;
slower repairs;
pressure on supervisors;
delayed vehicle deliveries; and
customer complaints.
What Does This Mean for the Company?
A high Absenteeism Rate may indicate:
employee health issues;
poor morale;
workplace stress;
burnout;
unsafe or unpleasant working conditions;
poor supervision;
attendance management problems;
employee disengagement; or
misuse of leave.
Management must investigate fairly.
The number tells you that a pattern exists. It does not automatically tell you why it exists.
That distinction is important.
Example of Good Absenteeism Performance
The workshop investigates the situation.
Management improves shift planning, addresses excessive overtime, communicates attendance procedures clearly, and works with employees to resolve recurring problems appropriately.
Several months later:
Total available workdays: 300 days
Days lost to absence: 9 days
Absenteeism Rate: 9 ÷ 300 × 100 = 3%
What Does This Mean for the Company?
A lower and stable Absenteeism Rate can contribute to:
better workforce planning;
fewer operational disruptions;
lower overtime;
more consistent customer service;
more predictable productivity; and
reduced pressure on other employees.
The business should still treat legitimate absence appropriately.
A low Absenteeism Rate should never be achieved by creating a workplace where employees feel pressured to work when they genuinely should not be at work.
4. Employee Net Promoter Score
What Is Employee Net Promoter Score?
Employee Net Promoter Score, usually shortened to eNPS, measures how willing employees are to recommend the organisation as a place to work.
It is based on a simple question such as: "On a scale from 0 to 10, how likely are you to recommend this company as a good place to work?"
Employees are then divided into three groups.
Promoters
Employees who score: 9 or 10
These employees are generally highly positive about the organisation.
Passives
Employees who score: 7 or 8
They may be reasonably satisfied but are not strongly enthusiastic.
Detractors
Employees who score: 0 to 6
These employees are less likely to recommend the organisation and may have significant concerns about their working experience.
How Is Employee Net Promoter Score Calculated?
The formula is: eNPS = Percentage of Promoters − Percentage of Detractors
Passives are included in the total number of responses but are not directly included in the subtraction.
Suppose 20 employees respond.
10 are Promoters
6 are Passives
4 are Detractors
Promoters: 10 ÷ 20 × 100 = 50%
Detractors: 4 ÷ 20 × 100 = 20%
eNPS: 50 − 20 = +30
The company's Employee Net Promoter Score is: +30
An eNPS can range from: -100 to +100
Example of Poor eNPS Performance
A small professional services firm surveys 30 employees.
Results:
Promoters: 5
Passives: 10
Detractors: 15
Promoters: 5 ÷ 30 × 100 = 16.7%
Detractors: 15 ÷ 30 × 100 = 50%
eNPS: 16.7 − 50 = -33.3
The company's eNPS is approximately: -33
What Does This Mean for the Company?
A negative score tells management that there are more Detractors than Promoters.
That deserves investigation.
Possible reasons might include:
poor management;
weak communication;
salary concerns;
limited recognition;
excessive workloads;
unfair treatment;
lack of development opportunities;
workplace conflict; or
dissatisfaction with working conditions.
The company should not immediately assume which issue is responsible.
It should ask employees.
Example of Good eNPS Performance
After reviewing employee feedback, management introduces several practical changes:
Managers hold regular team meetings.
Employees receive more frequent feedback.
Workload concerns are addressed.
Recognition improves.
The survey is repeated six months later.
Of 30 employees:
18 are Promoters;
8 are Passives; and
4 are Detractors.
Promoters: 18 ÷ 30 × 100 = 60%
Detractors: 4 ÷ 30 × 100 = 13.3%
eNPS: 60 − 13.3 = +46.7
The company's eNPS is approximately: +47
What Does This Mean for the Company?
The improvement suggests that employee sentiment has become more positive.
It may indicate stronger:
engagement;
trust;
communication;
management relationships;
workplace experience; and
willingness to recommend the company.
But eNPS should not be treated as a complete employee satisfaction measurement.
One question cannot explain everything employees experience.
This is why it should be used together with broader Employee Satisfaction measures.
5. Employee Satisfaction
What Is Employee Satisfaction?
Employee Satisfaction measures how employees feel about important aspects of their work and workplace.
Unlike eNPS, which is usually based on one recommendation question, an employee satisfaction survey can examine several areas.
These might include:
pay and benefits;
workload;
working conditions;
supervision;
communication;
recognition;
teamwork;
equipment and resources;
training;
development opportunities;
job security;
fairness;
leadership; and
overall job satisfaction.
Employee satisfaction matters because people do not experience a workplace through a single issue:
An employee may like their manager but dislike their workload.
Another may enjoy the work but feel that pay is unfair.
Another may be satisfied with salary but frustrated by poor communication.
A broader survey helps management identify these differences.
How Is Employee Satisfaction Calculated?
There are several ways to calculate employee satisfaction.
A small business can use a simple rating scale.
For example, ask employees to rate statements from 1 to 5:
1 = Very Dissatisfied
2 = Dissatisfied
3 = Neutral
4 = Satisfied
5 = Very Satisfied
Suppose employees answer five questions and the average result is: 3.9 out of 5
You can convert this to a percentage: Employee Satisfaction Score = Average Score ÷ Maximum Possible Score × 100
Therefore: 3.9 ÷ 5 × 100 = 78%
The overall Employee Satisfaction Score is: 78%
Another approach is to calculate the percentage of employees who select "Satisfied" or "Very Satisfied".
Whichever method you choose, use it consistently so that results can be compared over time.
Example of Poor Employee Satisfaction
A small distribution company conducts an anonymous employee survey.
Its overall Employee Satisfaction Score is: 52%
The detailed results show:
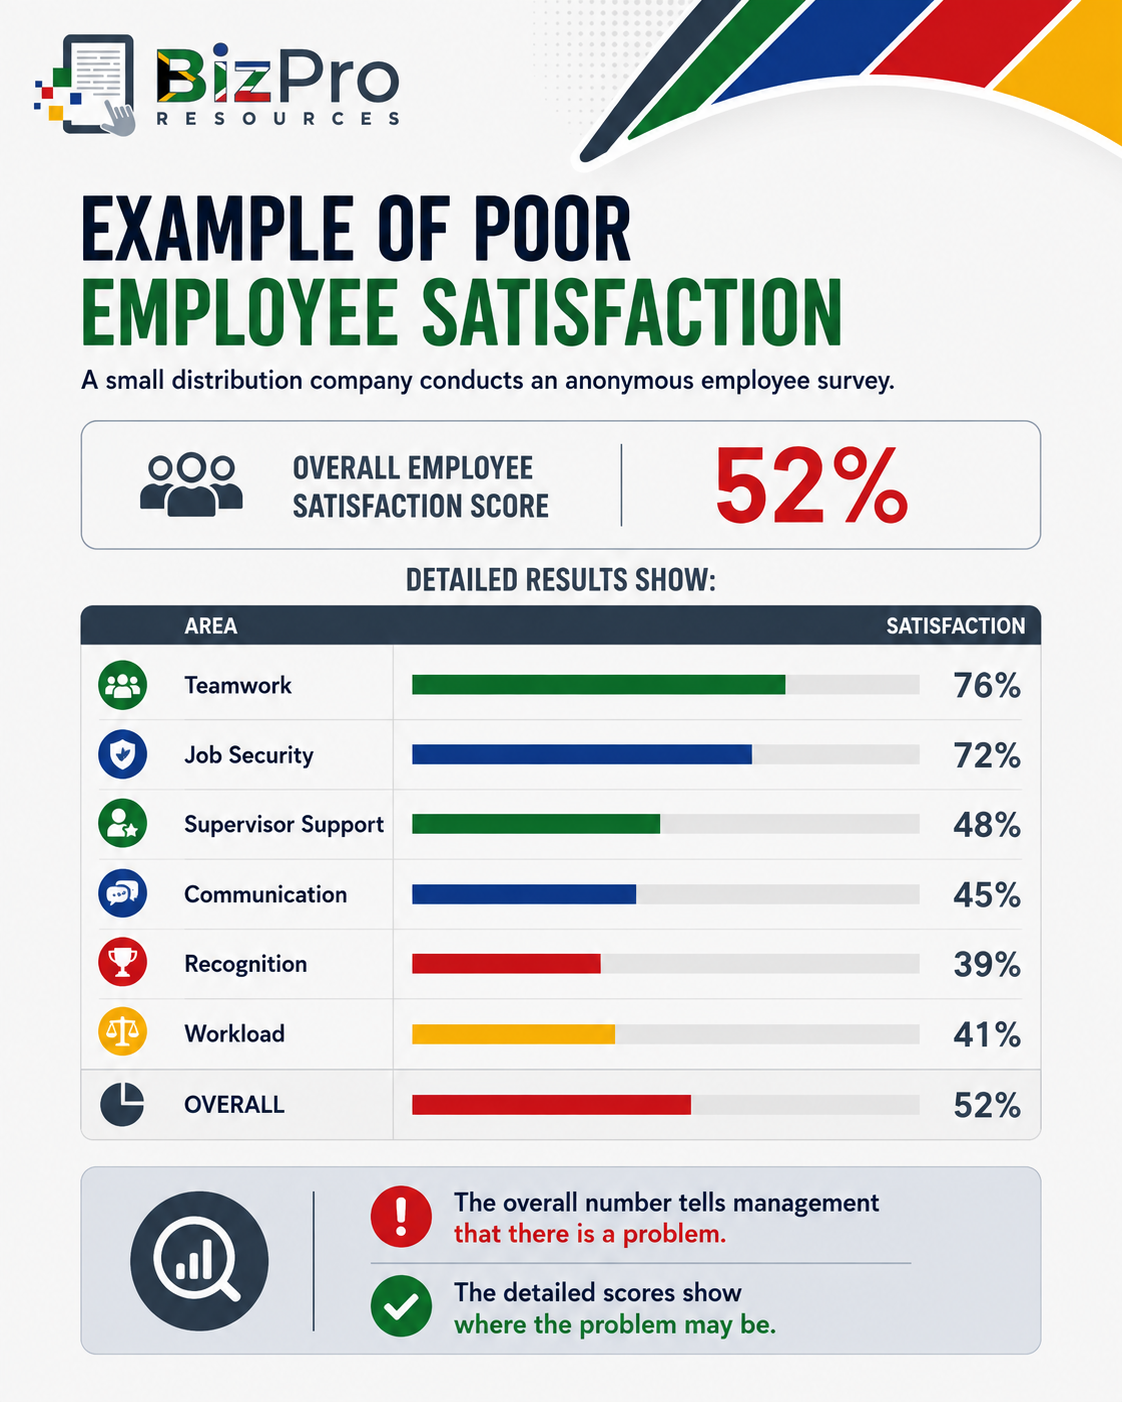
What Does This Mean for the Company?
Poor satisfaction can contribute to:
lower motivation;
weaker productivity;
absenteeism;
employee conflict;
poor customer service;
disengagement; and
higher employee turnover.
However, management should avoid treating every low survey score as a demand that must automatically be accepted.
Employee feedback is information.
Management must consider the feedback, investigate the causes, and decide what action is reasonable and practical.
Example of Good Employee Satisfaction
Management focuses on the weakest areas:
Supervisors receive training.
Monthly team meetings improve communication.
Employees receive clearer feedback about performance.
Recognition for good work becomes more consistent.
Workloads are reviewed.
Six months later, the survey is repeated.
The overall satisfaction result increases from: 52% to 81%
What Does This Mean for the Company?
The improved result suggests that employees have a more positive experience at work.
This can support:
stronger employee retention;
better teamwork;
improved morale;
greater engagement;
more consistent attendance;
improved customer service; and
stronger productivity.
However, management should still review individual survey areas.
An overall score of 81% could hide a specific problem. For example, employees may be very satisfied with teamwork but still unhappy with communication.
Always look behind the average.
How the Five Workforce Health Metrics Work Together
These metrics become more powerful when they are considered together.
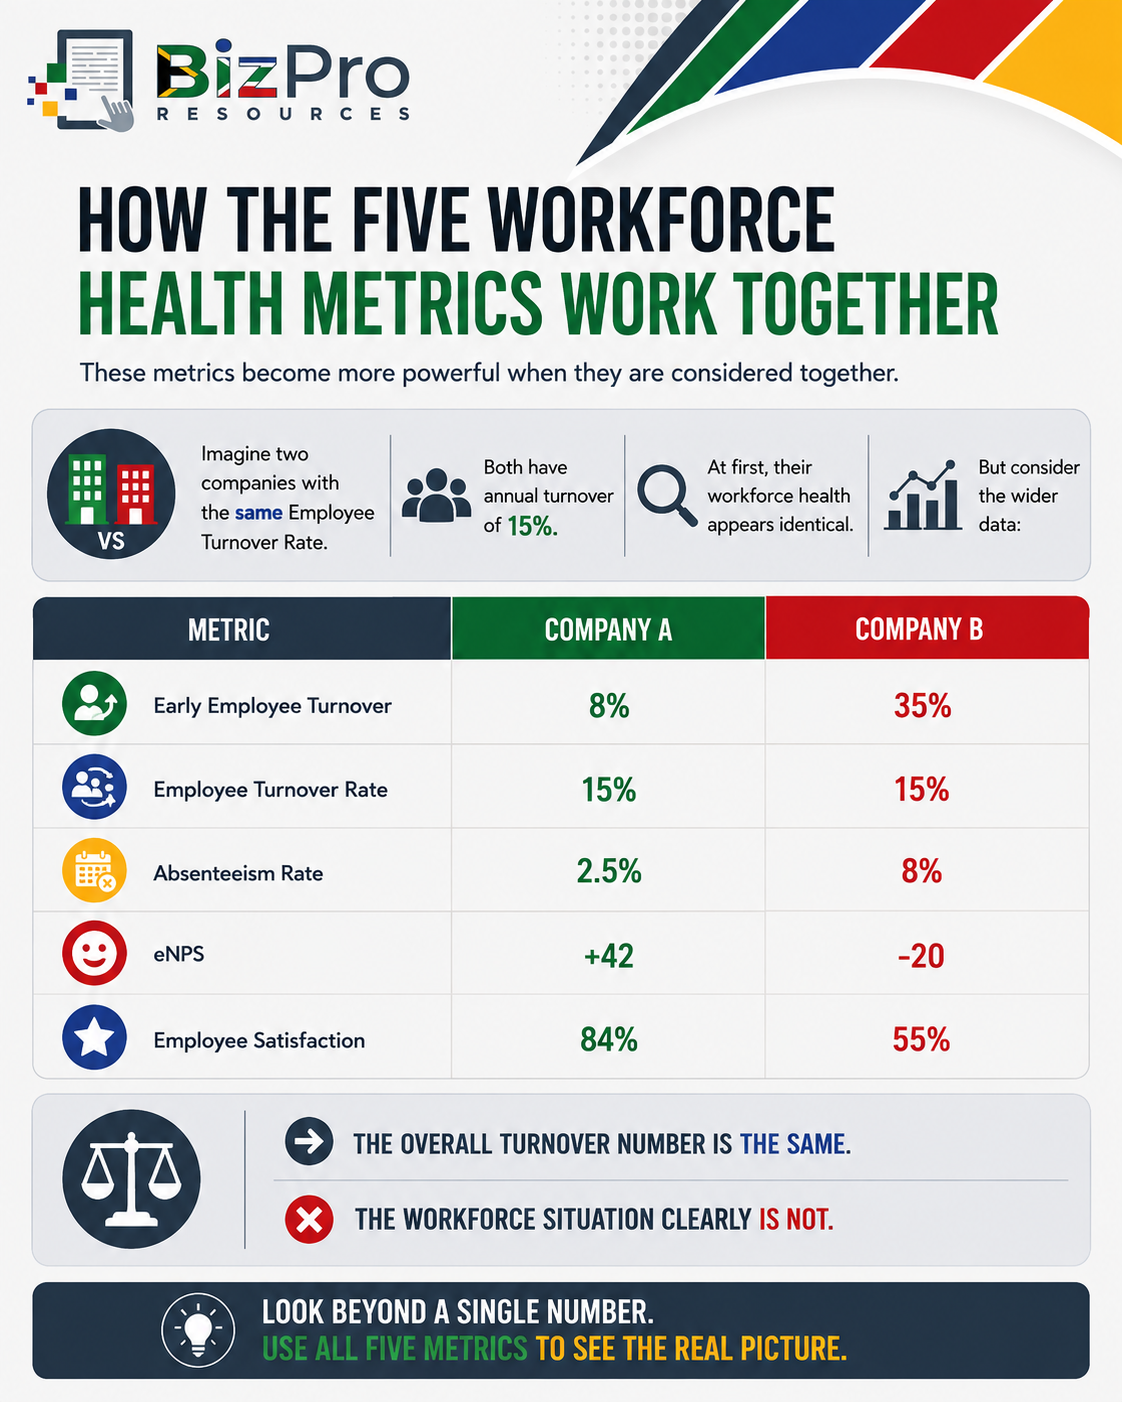
Company A appears to have relatively stable and positive workforce conditions.
Company B has several warning signs:
new employees are leaving quickly;
absenteeism is high;
eNPS is negative; and
satisfaction is low.
Its 15% overall turnover rate therefore tells only part of the story.
This demonstrates why businesses should avoid managing employees through one HR number.
Watch for Patterns Between the Metrics
Workforce metrics often influence each other.
For example:
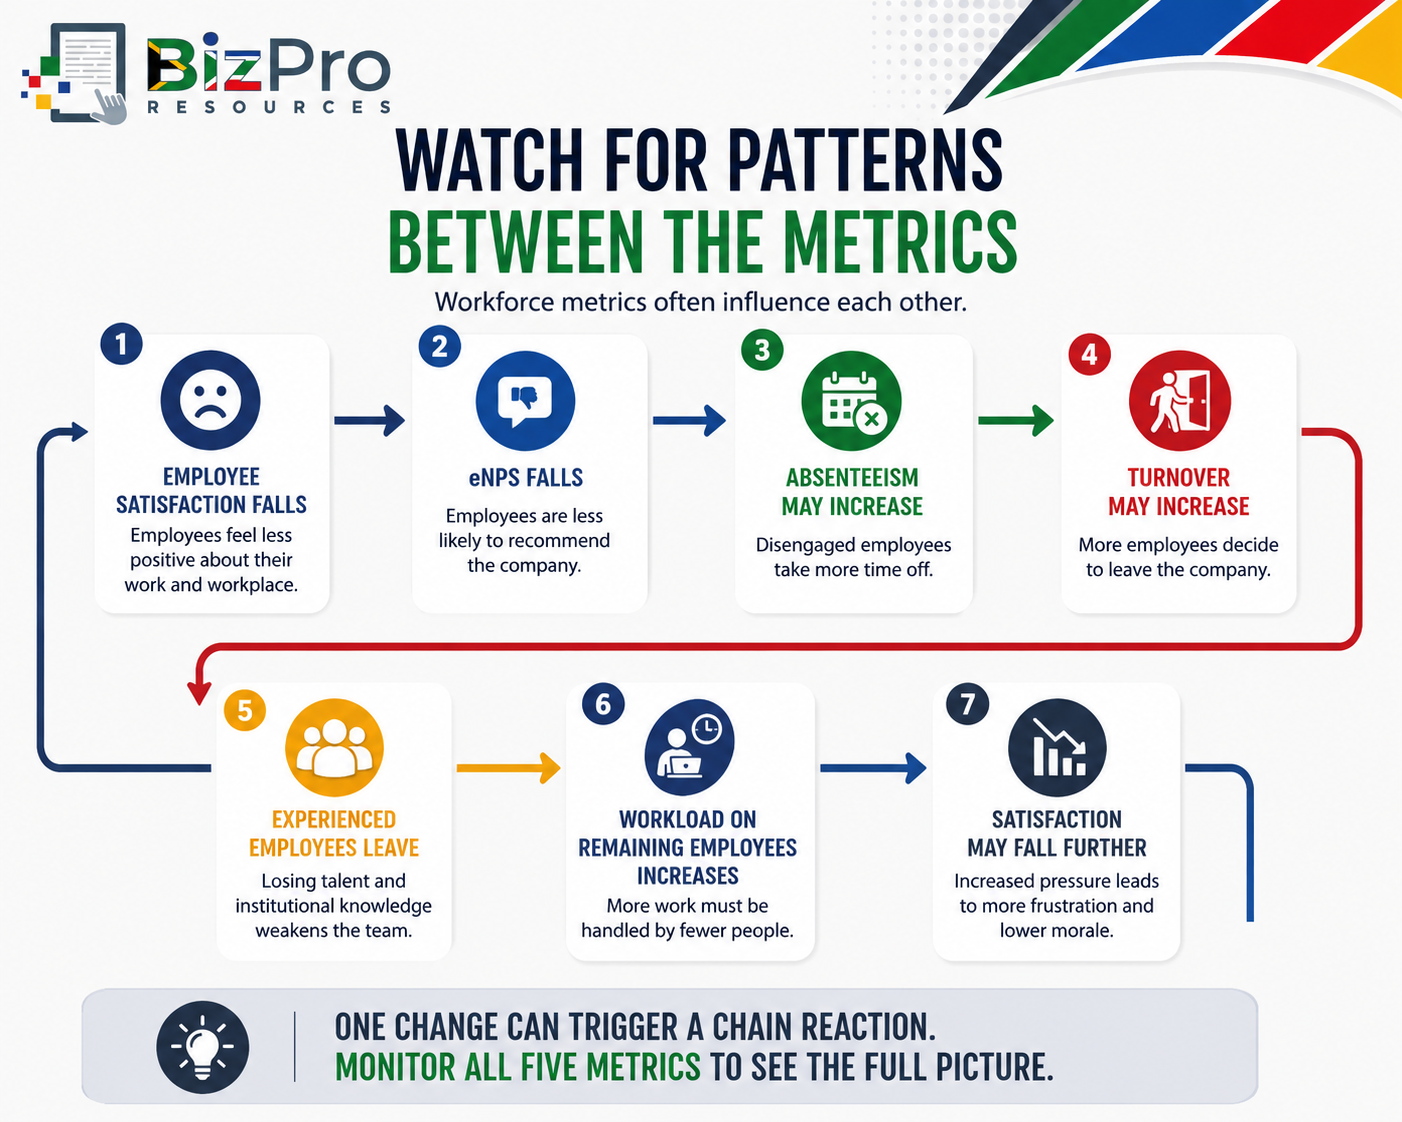
A negative cycle can develop.
The opposite can also happen.
Better supervision and communication can improve satisfaction.
Improved satisfaction may support attendance and retention.
Better retention creates more experienced teams.
Experienced teams may perform more efficiently.
The purpose of workforce metrics is to help management identify these relationships.
Build a Simple Retention and Workforce Health Dashboard
A small business does not need complicated HR software to begin. A spreadsheet can be enough.
A simple quarterly dashboard might look like this:
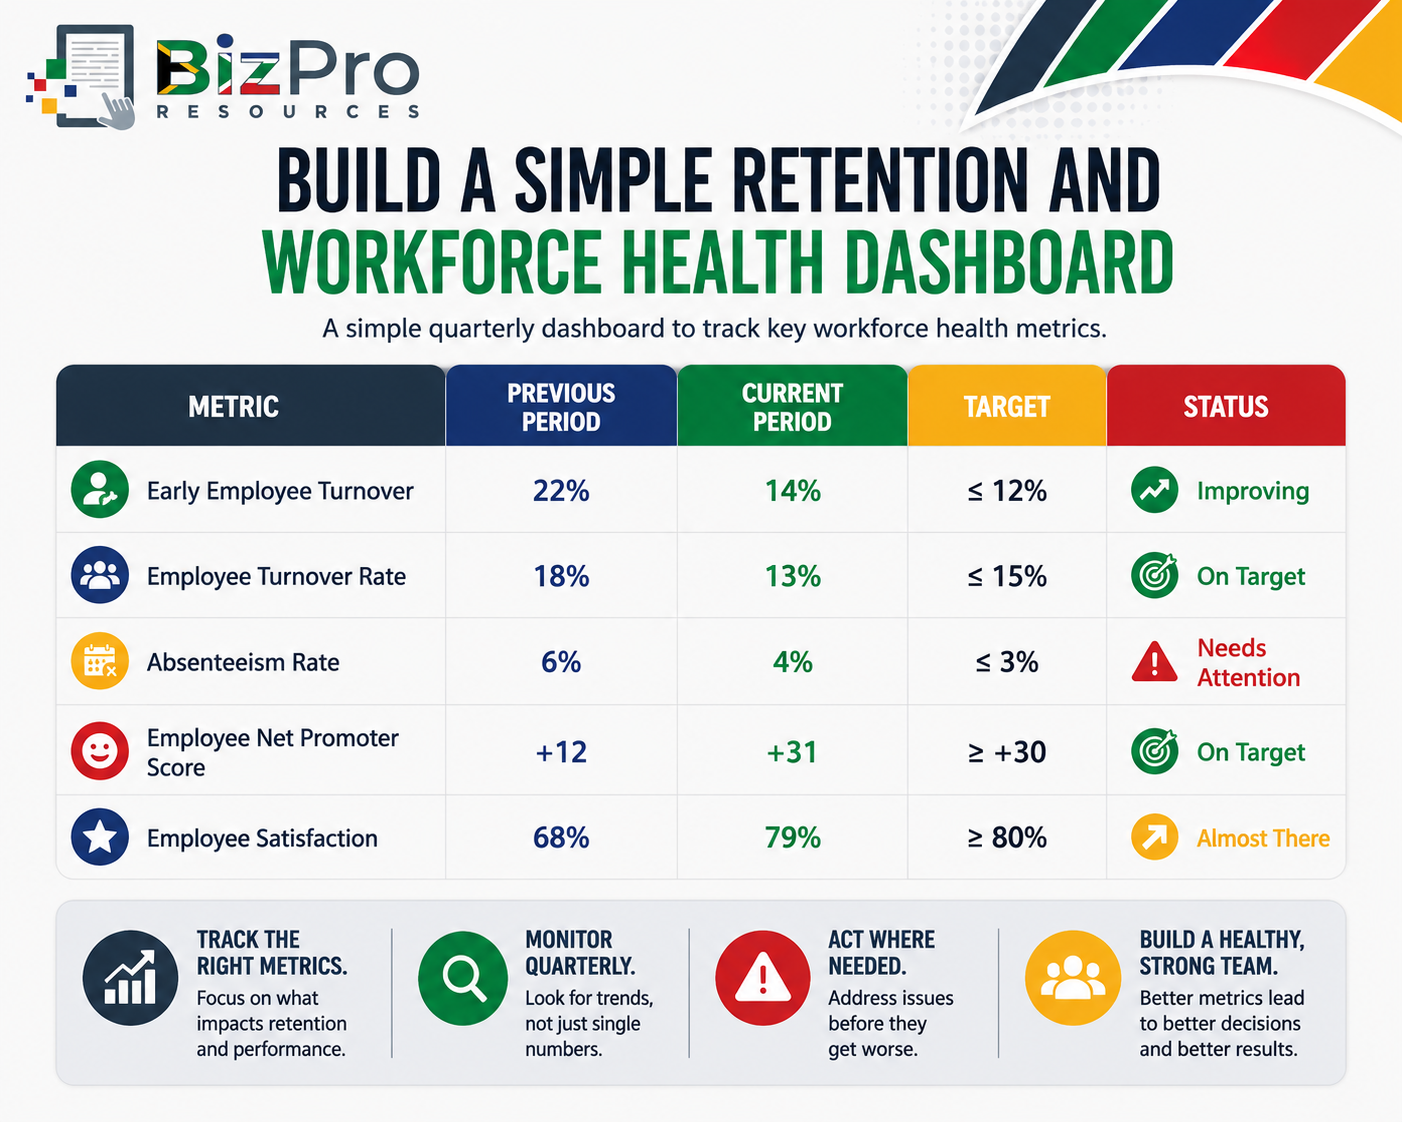
Management can immediately see where attention is required:
Employee retention is improving.
eNPS has reached target.
Employee Satisfaction is close to target.
But Absenteeism remains higher than desired.
Management now knows where to investigate.
Segment Your Workforce Data
Company-wide averages can hide important problems. Suppose a business has an overall Absenteeism Rate of 4%. That may appear reasonable.
But look at the departments:
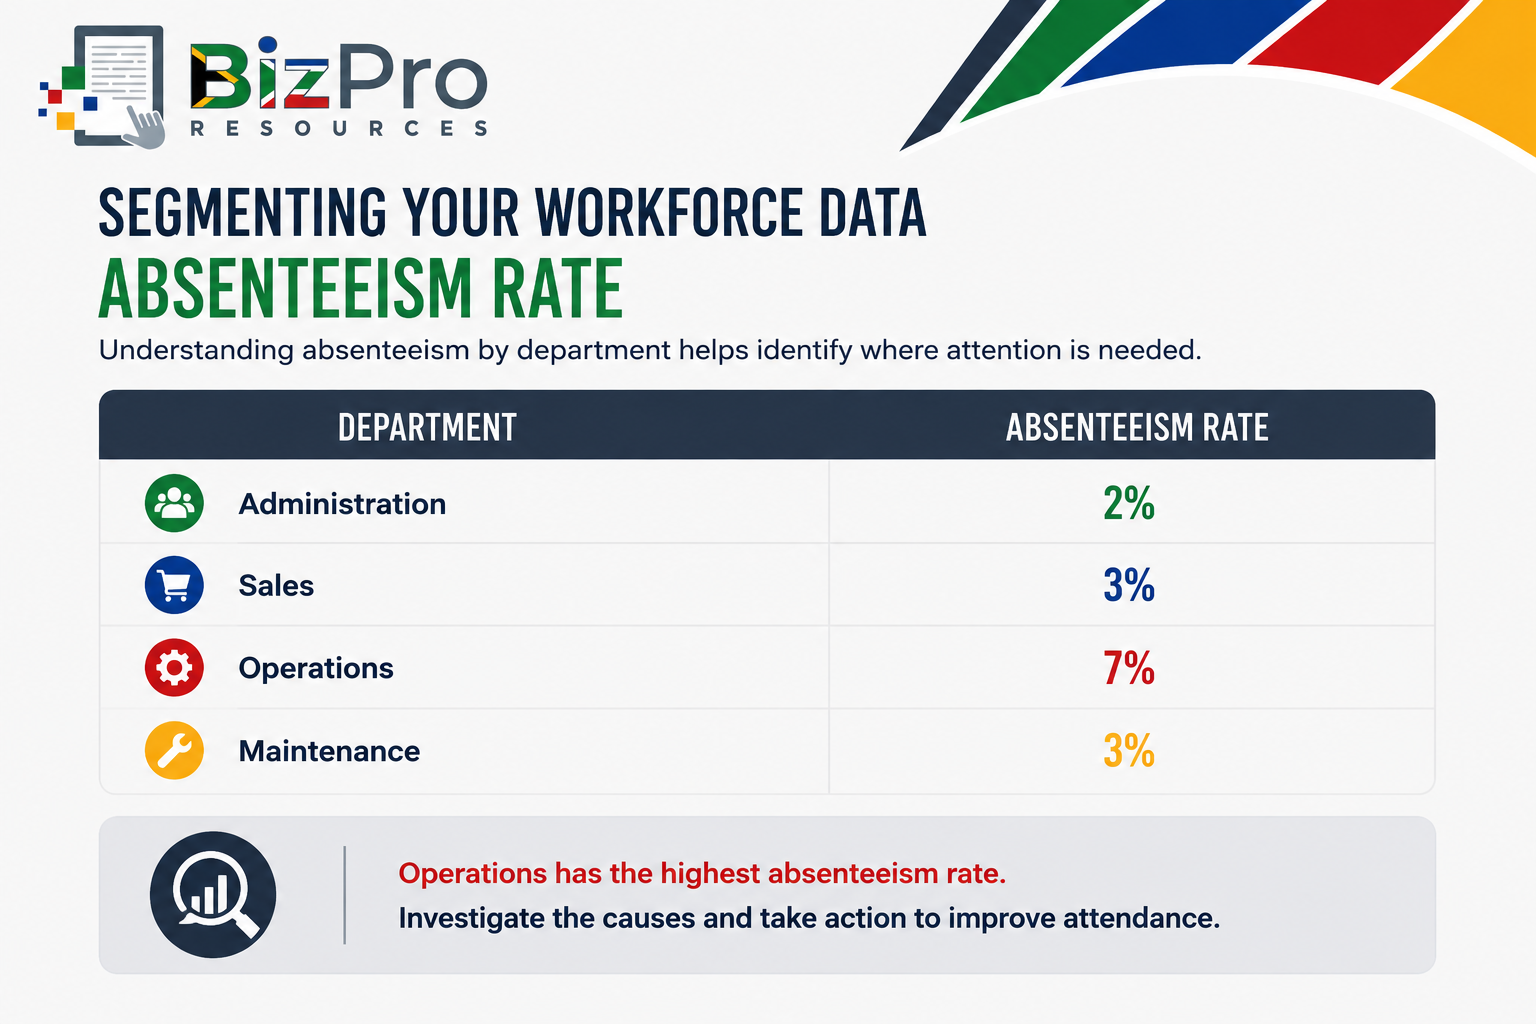
The company does not necessarily have a company-wide attendance problem. It may have a specific problem in Operations.
Management can now investigate:
working conditions;
shift patterns;
supervision;
overtime;
workload;
employee relations; and
other relevant factors within that department.
The same principle applies to turnover and satisfaction.
Where appropriate, analyse results by:
department;
branch;
team;
job category;
supervisor;
length of service; or
work location.
Be careful when groups are very small. Employees should not feel that supposedly anonymous feedback can easily be traced back to them.
Understand Why Employees Leave
Turnover calculations tell you how many people leave. They do not tell you why they leave. This is why exit information is useful.
Possible departure reasons might include:
better salary elsewhere;
career advancement;
relocation;
retirement;
family responsibilities;
dissatisfaction with management;
workload;
working hours;
workplace conflict;
poor job fit;
dismissal; or
end of contract.
Over time, patterns may appear.
For example:
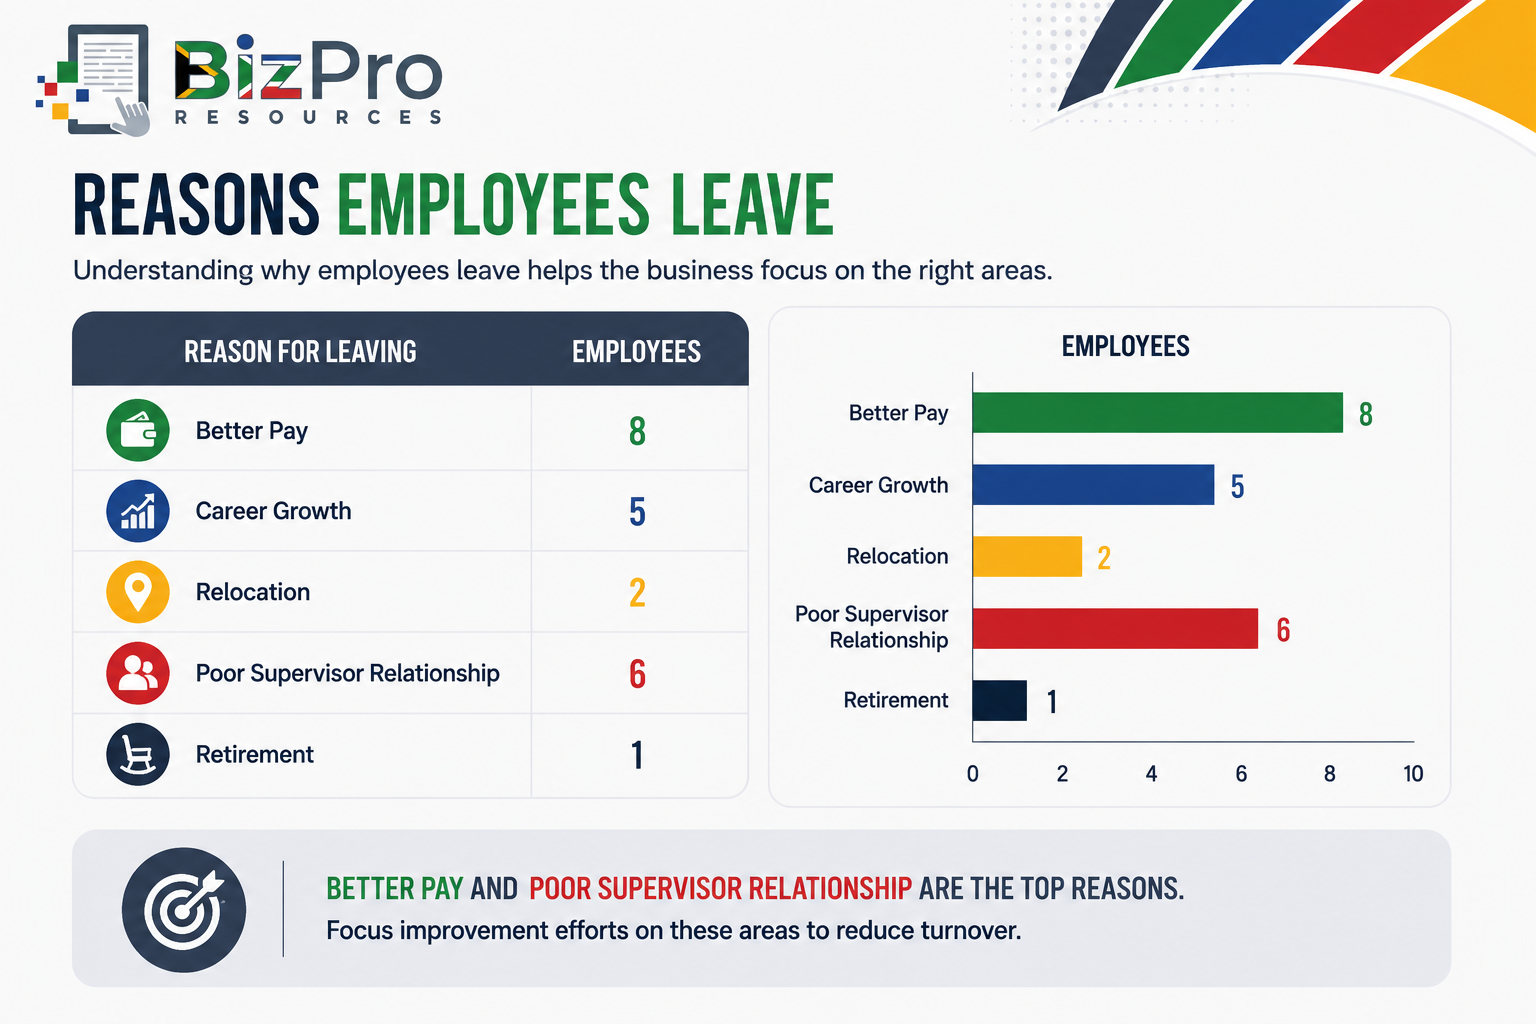
Management now has much more useful information.
"Turnover is high" is a problem statement.
"Fourteen employees left mainly because of better pay and supervisor relationships" provides a clearer direction for investigation.
Voluntary and Involuntary Turnover Are Different
Another important distinction is between voluntary turnover and involuntary turnover.
Voluntary Turnover
The employee chooses to leave.
Examples include:
resignation;
career change;
relocation; or
accepting another job.
Involuntary Turnover
The employment relationship ends through an employer decision or another non-voluntary reason, subject to applicable employment law and proper procedures.
The difference matters.
Suppose turnover increases because the business dismisses several employees after serious performance or misconduct problems.
That tells a different story from several high-performing employees voluntarily resigning to join competitors.
Do not simply count departures.
Understand them.
Be Careful with Employee Surveys
Employee surveys can provide valuable information, but only when employees trust the process.
If employees believe management will punish them for negative feedback, the results may be unreliable.
People may simply select positive answers.
Management then receives a beautiful survey score that tells it very little about the real workplace.
Good survey practice includes:
keeping surveys reasonably short;
explaining why the survey is being conducted;
protecting anonymity where appropriate;
asking clear questions;
avoiding leading questions;
sharing important findings with employees; and
taking reasonable action when genuine problems are identified.
One of the quickest ways to damage confidence in employee surveys is to repeatedly ask employees for feedback and then do nothing with the results.
Do Not Chase Perfect Numbers
Workforce metrics require context.
A company should not automatically assume: Low turnover = perfect workplace or High turnover = terrible workplace
Similarly: Low absenteeism = healthy employees is not necessarily true.
Employees might be coming to work when they are unwell because they are afraid of consequences.
A very high satisfaction score may also deserve investigation if employees do not trust the survey process.
Metrics should support management judgement, not replace it.
What Does Good Workforce Health Look Like?
There is no universal target that applies to every business.
Different industries, occupations, locations, workforce structures, and economic conditions produce different results.
Instead of searching for one "perfect" turnover or absenteeism percentage, begin with your own baseline.
For example:
Early Employee Turnover: 25%
Employee Turnover Rate: 22%
Absenteeism Rate: 7%
eNPS: +5
Employee Satisfaction: 63%
Then establish realistic improvement targets.
For example:
Early Employee Turnover: Below 18%
Employee Turnover Rate: Below 17%
Absenteeism Rate: Below 5%
eNPS: Above +20
Employee Satisfaction: Above 72%
Measure again.
The direction of movement can be as important as the number itself.
Turning Workforce Data into Action
Measurement only becomes valuable when it leads to better decisions.
A practical management cycle is:
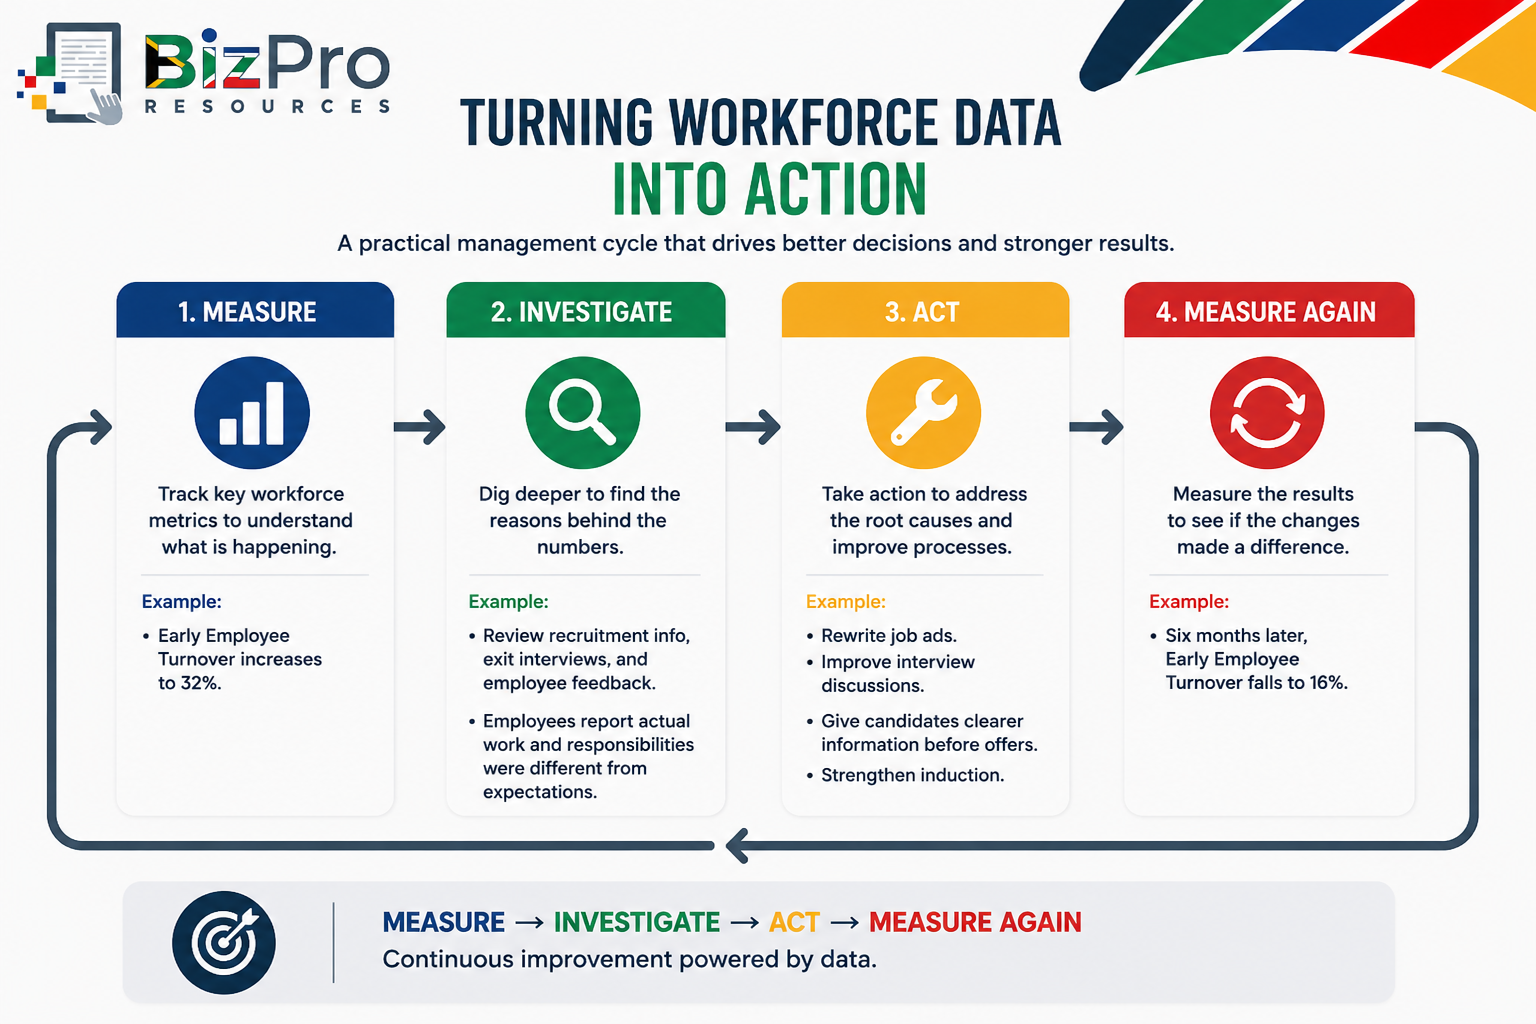
Measure
Early Employee Turnover increases to 32%.
Investigate
Management reviews recruitment information, exit interviews, and feedback from recent employees.
Many employees report that the actual working hours and job responsibilities were different from what they expected.
Act
Job advertisements are rewritten.
Interview discussions are improved.
Candidates receive clearer explanations about working conditions before accepting offers.
The induction process is strengthened.
Measure Again
Six months later, Early Employee Turnover falls to 16%.
That is the purpose of HR metrics. Not simply collecting numbers. Improving the business.
Questions to Ask Every Quarter
When reviewing retention and workforce health, management should ask:
Are new employees staying beyond their first year?
At what point are new employees most likely to leave?
Is our overall Employee Turnover Rate increasing or decreasing?
Which departments have the highest turnover?
Are we losing employees we wanted to keep?
Why are employees leaving?
Is absenteeism increasing?
Are there patterns in absence by team, shift, department, or day?
What are employees telling us through satisfaction surveys?
Is our eNPS improving or declining?
Which areas of employee satisfaction are weakest?
Do employees trust management enough to provide honest feedback?
Are supervisors contributing to retention problems?
Are workloads sustainable?
Are our recruitment promises matching the real job?
Are we acting on employee feedback?
What has changed since the previous measurement period?
These questions move the discussion from: "Do we have happy employees?"
to: "What is the data telling us about the health and stability of our workforce?"
Final Thoughts
A healthy workforce does not mean that nobody ever leaves, nobody is ever absent, and every employee is completely satisfied.
That is unrealistic.
Employees are people:
They become ill.
Their circumstances change.
They pursue new opportunities.
They experience good and difficult periods at work.
The purpose of retention and workforce health metrics is not to eliminate normal human behaviour.
The purpose is to identify patterns that could affect the business:
Early Employee Turnover tells you whether new employees are staying.
Employee Turnover Rate tells you how much movement is occurring across the workforce.
Absenteeism Rate tells you how much scheduled working time is being lost.
Employee Net Promoter Score provides a simple indication of whether employees would recommend the organisation as a place to work.
Employee Satisfaction provides a broader view of how employees experience important parts of their workplace.
Together, these five metrics can help a small business identify workforce problems earlier:
Start simply.
Measure consistently.
Look behind the averages.
Ask employees.
Investigate unusual patterns.
Take reasonable action.
Then measure again.
Because the objective is not simply to employ people.
It is to build a stable, reliable, productive workforce that supports the long-term success of the business.
Related Articles in the HR Performance Metrics Series
Rentention and Workforce Health Metrics
Productivity and Value Metrics
Disciplinary Procedure Metrics
AI Disclaimer
AI Tools were used to assist with research. Remember to always cross-check everything that you read.


