

Disciplinary Procedure Metrics: Measuring Fairness, Effectiveness, and Resolution in the Workplace
Article #4 of #4 in the HR Performance Metrics Series
Introduction
Discipline is one of the more difficult responsibilities of managing employees.
Small business owners and managers need employees to follow workplace rules, meet reasonable standards, perform their jobs properly, and behave appropriately.
When problems occur, management may need to take corrective or disciplinary action. But disciplinary procedures should not simply be about punishment.
A good disciplinary system should help the business:
identify problems;
correct inappropriate behaviour;
improve performance where reasonably possible;
apply workplace rules consistently;
resolve problems efficiently;
protect employees from unfair treatment;
maintain appropriate records; and
create a fair and orderly workplace.
For South African employers, discipline also needs to be handled within the country's employment law framework and principles of procedural and substantive fairness.
This means management should be careful about treating disciplinary metrics as targets.
A company should not aim to issue more warnings simply because its Disciplinary Action Rate appears low.
Similarly, management should not avoid necessary disciplinary action simply because it wants a lower number.
The purpose of disciplinary metrics is to identify patterns and improve management decisions.
Five useful metrics are:
Disciplinary Action Rate
Repeat Offense Rate
Grievance-to-Discipline Ratio
PIP Success Rate
Time-to-Resolve
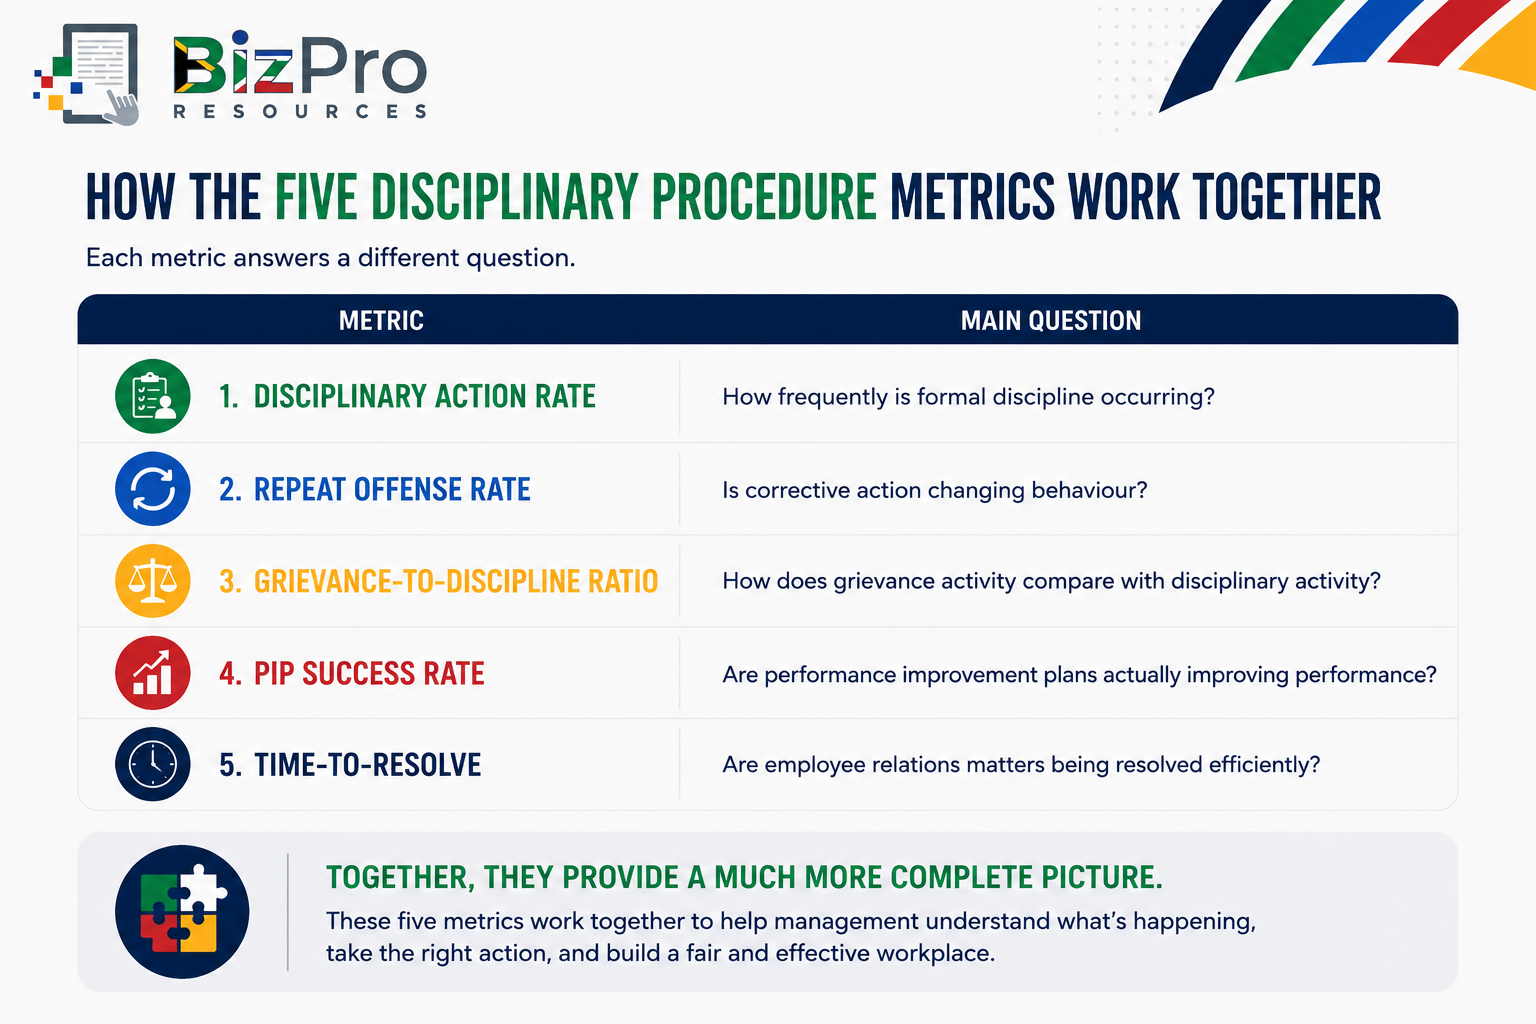
Together, these metrics can help answer five important questions:
How frequently are formal disciplinary actions occurring?
Are employees repeating the same problems after corrective action?
How does employee grievance activity compare with disciplinary activity?
Are Performance Improvement Plans actually helping employees improve?
How long does it take us to resolve disciplinary matters?
These numbers do not replace good HR judgement, proper procedures, or legal compliance.
They provide management with another way to understand what is happening in the workplace.
Why Measure Disciplinary Procedures?
Imagine a business with 50 employees.
During one year, management issues:
35 written warnings;
12 final written warnings;
several Performance Improvement Plans;
and conducts numerous disciplinary hearings.
The owner may conclude: "We have an employee discipline problem."
Perhaps. But that is only one possibility:
Management should investigate further.
Are the same employees repeatedly receiving warnings?
Is one department responsible for most disciplinary cases?
Is one supervisor issuing significantly more warnings than other supervisors?
Are employees receiving proper training?
Are workplace rules clear?
Are grievances increasing at the same time?
Are performance problems improving after Performance Improvement Plans?
Are disciplinary matters taking weeks or months to resolve?
Without measurement, disciplinary management can become reactive:
A problem occurs.
Management responds.
Another problem occurs.
Management responds again.
Metrics allow the business to step back and look for patterns.
1. Disciplinary Action Rate
What Is Disciplinary Action Rate?
Disciplinary Action Rate measures how frequently formal disciplinary actions occur within the workforce during a particular period.
Depending on the company's policies, formal disciplinary action might include:
written warnings;
final written warnings;
formal disciplinary hearings; or
other formally recorded disciplinary measures.
The company should clearly define what it includes.
For example, an informal coaching conversation may not be counted as formal disciplinary action.
Consistency is important.
How Is Disciplinary Action Rate Calculated?
A practical formula is: Disciplinary Action Rate = Number of Formal Disciplinary Actions ÷ Average Number of Employees × 100
Suppose a company has an average workforce of: 60 employees:
During the year, there are: 12 formal disciplinary actions
The calculation is: 12 ÷ 60 × 100 = 20%
The Disciplinary Action Rate is: 20 disciplinary actions per 100 employees for the period
Be careful with the interpretation.
This does not necessarily mean that 20% of employees were disciplined.
One employee may have received more than one disciplinary action.
If you want to measure the percentage of employees affected, calculate a separate metric using the number of unique employees disciplined.
Example of Poor Disciplinary Action Rate Performance
Consider a small distribution company with 40 employees:
During the year: 24 formal disciplinary actions are recorded.
Disciplinary Action Rate: 24 ÷ 40 × 100 = 60%
Management investigates further.
It discovers that:
15 actions came from one department;
several involved the same workplace rule;
employees say the rule was poorly explained;
one supervisor uses formal warnings much more frequently than other supervisors; and
new employees receive very little induction regarding workplace rules.
What Does This Mean for the Company?
The high rate may indicate:
widespread misconduct;
unclear workplace rules;
inconsistent supervision;
inadequate induction;
poor communication;
weak management;
inappropriate use of disciplinary procedures;
workplace conflict; or
repeated problems that are not being properly corrected.
But a high Disciplinary Action Rate is not automatically proof of a bad workplace.
Perhaps the company previously ignored serious problems and has recently started applying its rules more consistently.
Context matters.
The metric tells management:
Something deserves investigation.
Example of Good Disciplinary Action Rate Performance
The distribution company improves employee induction.
Supervisors receive training on:
workplace rules;
performance management;
communication;
coaching; and
appropriate disciplinary procedures.
The company also rewrites several unclear workplace rules.
During the following year:
Average workforce: 42 employees
Formal disciplinary actions: 8
Disciplinary Action Rate: 8 ÷ 42 × 100 = approximately 19%
What Does This Mean for the Company?
The decrease may indicate:
employees understand workplace rules better;
supervisors are managing problems earlier;
communication has improved;
repeated problems have decreased; and
formal discipline is needed less frequently.
But management should not automatically celebrate simply because the number fell.
A very low rate could also occur because managers are ignoring problems.
The objective is appropriate and fair discipline, not simply fewer disciplinary actions.
2. Repeat Offense Rate
What Is Repeat Offense Rate?
A disciplinary process should ideally help correct behaviour.
If an employee receives appropriate corrective or disciplinary action for a particular problem, management would normally hope that the same problem does not continue.
The Repeat Offense Rate measures how often employees repeat the same or a sufficiently comparable problem after previous corrective or disciplinary action.
Examples might include repeated:
lateness;
unauthorised absence;
failure to follow procedures;
inappropriate behaviour;
safety violations; or
other workplace misconduct.
The company should define carefully what it considers a repeat offense.
How Is Repeat Offense Rate Calculated?
A simple formula is: Repeat Offense Rate = Number of Employees with Repeat Offenses ÷ Number of Employees Previously Disciplined for Those Offenses × 100
Suppose:
20 employees received disciplinary action for specific issues.
Within the defined monitoring period, five repeat the same or comparable issue.
Repeat Offense Rate = 5 ÷ 20 × 100
Repeat Offense Rate = 25%
One in four affected employees repeated the problem.
Example of Poor Repeat Offense Performance
A security company disciplines 16 employees for repeated lateness.
During the next six months, eight of those employees again experience the same problem:
Repeat Offense Rate = 8 ÷ 16 × 100
Repeat Offense Rate = 50%
What Does This Mean for the Company?
Half of the employees affected repeated the behaviour.
This may indicate that:
corrective action is ineffective;
expectations are unclear;
supervisors are inconsistent;
the underlying cause has not been addressed;
consequences are poorly understood;
employees do not take the process seriously; or
management is treating a symptom rather than the real problem.
Management should investigate.
For example, if many employees on one shift are repeatedly late, there may be a scheduling or transport-related issue worth understanding.
That does not necessarily excuse inappropriate attendance.
But understanding the cause can help management decide how best to address the problem.
Example of Good Repeat Offense Performance
The company improves its approach.
Employees receive clear explanations of:
the attendance requirement;
why punctuality matters;
the consequences of continued problems; and
the expected improvement.
Supervisors also manage attendance consistently.
During the following six months:
18 employees receive corrective or disciplinary action for relevant attendance problems.
Only two repeat the same problem.
Repeat Offense Rate = 2 ÷ 18 × 100
Repeat Offense Rate = 11.1%
What Does This Mean for the Company?
The lower rate suggests that corrective action is more effective. Most affected employees changed their behaviour.
That is an important outcome.
A disciplinary system should not be judged only by how many warnings are issued.
A better question is: Did the intervention help correct the problem?
3. Grievance-to-Discipline Ratio
What Is the Grievance-to-Discipline Ratio?
Employees may raise formal grievances about workplace concerns.
Depending on the circumstances and company procedures, grievances might involve issues such as:
treatment by supervisors;
working conditions;
workplace conflict;
inconsistent application of rules;
communication;
unfair treatment;
harassment allegations; or
other employment-related concerns.
The Grievance-to-Discipline Ratio compares the number of formal employee grievances with the number of formal disciplinary actions during the same period.
It can provide useful context about employee relations. However, this metric must be interpreted very carefully.
A grievance is not automatically proof that management acted incorrectly.
Similarly, a low number of grievances does not automatically mean employees are happy.
Employees may simply not trust the grievance process.
How Is the Grievance-to-Discipline Ratio Calculated?
A simple formula is: Grievance-to-Discipline Ratio = Number of Formal Grievances ÷ Number of Formal Disciplinary Actions
Suppose a company records: 10 formal grievances and 20 formal disciplinary actions:
The ratio is: 10 ÷ 20 = 0.5
This can be expressed as: 0.5 grievances for every disciplinary action
or: 1 grievance for every 2 disciplinary actions
Example of Poor Grievance-to-Discipline Performance
A business records: 18 formal grievances and 20 disciplinary actions.
Grievance-to-Discipline Ratio: 18 ÷ 20 = 0.9.
Management investigates the grievances.
Many relate to:
inconsistent treatment;
supervisor behaviour;
disciplinary procedures;
unclear workplace rules; and
employees believing that similar cases are handled differently.
What Does This Mean for the Company?
The high ratio does not automatically prove that the disciplinary actions were unfair.
But the pattern deserves serious attention.
It may indicate:
employee relations problems;
inconsistent management;
poor communication;
lack of trust;
unclear procedures;
inadequate supervisor training; or
perceived unfairness.
The business should investigate both the grievances and its disciplinary practices.
Example of Good Grievance-to-Discipline Performance
After reviewing its processes, the company:
clarifies workplace rules;
trains supervisors;
improves documentation;
communicates grievance procedures;
improves disciplinary consistency; and
gives employees appropriate opportunities to raise concerns.
During the next period:
Formal grievances: 5
Formal disciplinary actions: 18
Ratio: 5 ÷ 18 = 0.28
Approximately: 0.28 grievances per disciplinary action
What Does This Mean for the Company?
The lower ratio, together with other positive employee relations indicators, may suggest:
greater confidence in management;
more consistent discipline;
clearer procedures;
fewer workplace disputes; and
better supervisor behaviour.
But management must avoid treating a low grievance number as a target.
Employees should feel able to raise legitimate concerns.
A company where nobody complains is not automatically a company where nothing is wrong.
4. PIP Success Rate
What Is a PIP Success Rate?
A Performance Improvement Plan, commonly called a PIP, is a structured process intended to help address identified employee performance problems.
A PIP may include:
the performance problem;
the required standard;
specific improvement goals;
support or training;
measurement criteria;
responsibilities;
review dates; and
a defined review period.
The PIP Success Rate measures how many employees placed on formal Performance Improvement Plans successfully achieve the required improvement.
This is valuable because a business should not simply count how many PIPs it issues.
It should determine whether they actually work.
How Is PIP Success Rate Calculated?
A simple formula is: PIP Success Rate = Number of Successfully Completed PIPs ÷ Total Completed PIPs × 100
Suppose: 10 employees complete PIPs:
Seven successfully meet the required performance standards.
PIP Success Rate = 7 ÷ 10 × 100
PIP Success Rate = 70%
The company should define what "successful" means before the PIP begins.
Example of Poor PIP Success Rate
A small professional services company completes PIPs for 12 employees:
Only three achieve the required performance improvement.
PIP Success Rate = 3 ÷ 12 × 100
PIP Success Rate = 25%
What Does This Mean for the Company?
A 25% success rate may indicate problems such as:
unrealistic improvement targets;
poor performance management;
inadequate employee support;
insufficient training;
vague PIP requirements;
inadequate supervision;
PIPs being introduced too late; or
PIPs being treated mainly as paperwork before further action rather than genuine improvement tools.
Management should review the process:
Were employees clearly told what needed to improve?
Was the required standard reasonable?
Did managers provide the support promised?
Was progress reviewed regularly?
Were performance problems properly identified?
These questions matter.
Example of Good PIP Success Rate
The company redesigns its PIP process.
Every PIP now includes:
clearly defined performance gaps;
measurable targets;
realistic deadlines;
regular supervisor meetings;
training where appropriate; and
documented progress reviews.
During the next year:
10 PIPs are completed.
Eight employees successfully achieve the required standard.
PIP Success Rate = 8 ÷ 10 × 100
PIP Success Rate = 80%
What Does This Mean for the Company?
The higher success rate suggests that the PIP process is helping more employees improve.
The business may benefit from:
stronger employee performance;
fewer ongoing performance problems;
lower replacement costs;
improved management capability; and
better employee retention.
A successful PIP is valuable because the company may retain an employee who already understands the business instead of recruiting and training a replacement.
5. Time-to-Resolve
What Is Time-to-Resolve?
Time-to-Resolve measures how long it takes the business to bring a disciplinary or related employee relations matter to an appropriate conclusion.
The starting point must be clearly defined.
For example: Date Formal Matter Is Opened → Date Matter Is Formally Concluded
The company might separately measure:
disciplinary cases;
grievances;
performance processes; or
investigations.
Keeping these categories separate can make the data more useful because different types of cases may reasonably require different amounts of time.
How Is Time-to-Resolve Calculated?
For one case: Time-to-Resolve = Resolution Date − Case Opening Date.
Suppose a disciplinary matter is formally opened on: 4 August and concluded on 14 August.
Time-to-Resolve: 10 days.
To calculate an average: Average Time-to-Resolve = Total Resolution Days for All Cases ÷ Number of Resolved Cases
Suppose five cases take:
8 days;
12 days;
10 days;
15 days; and
5 days.
Total: 50 days
Average: 50 ÷ 5 = 10 days
Average Time-to-Resolve: 10 days
Example of Poor Time-to-Resolve Performance
A company reviews 12 completed disciplinary matters.
Average Time-to-Resolve: 42 days
Several relatively straightforward cases have remained open for more than two months.
Management discovers:
meetings are repeatedly postponed;
managers submit documentation late;
responsibilities are unclear;
investigations start slowly;
witnesses are contacted late; and
case administration is poorly controlled.
What Does This Mean for the Company?
Unnecessary delays can create:
uncertainty;
management distraction;
workplace tension;
deteriorating relationships;
lost productivity;
poor employee confidence in procedures; and
increased risk of inconsistent handling.
However, management should never attempt to improve Time-to-Resolve by rushing cases that require proper investigation and fair procedure.
The objective is: Efficient resolution without sacrificing fairness.
Example of Good Time-to-Resolve Performance
The company introduces a simple case-management process.
Every formal matter receives:
an opening date;
responsible manager;
required next action;
target dates;
documentation checklist; and
resolution date.
The following year:
Average Time-to-Resolve decreases from: 42 days to 14 days
What Does This Mean for the Company?
The improvement may indicate:
better case administration;
clearer responsibilities;
faster investigations;
fewer unnecessary delays;
improved documentation; and
stronger management discipline.
Cases are being addressed more efficiently while still following appropriate procedures.
How the Five Disciplinary Procedure Metrics Work Together
Each metric answers a different question.
Consider two businesses:
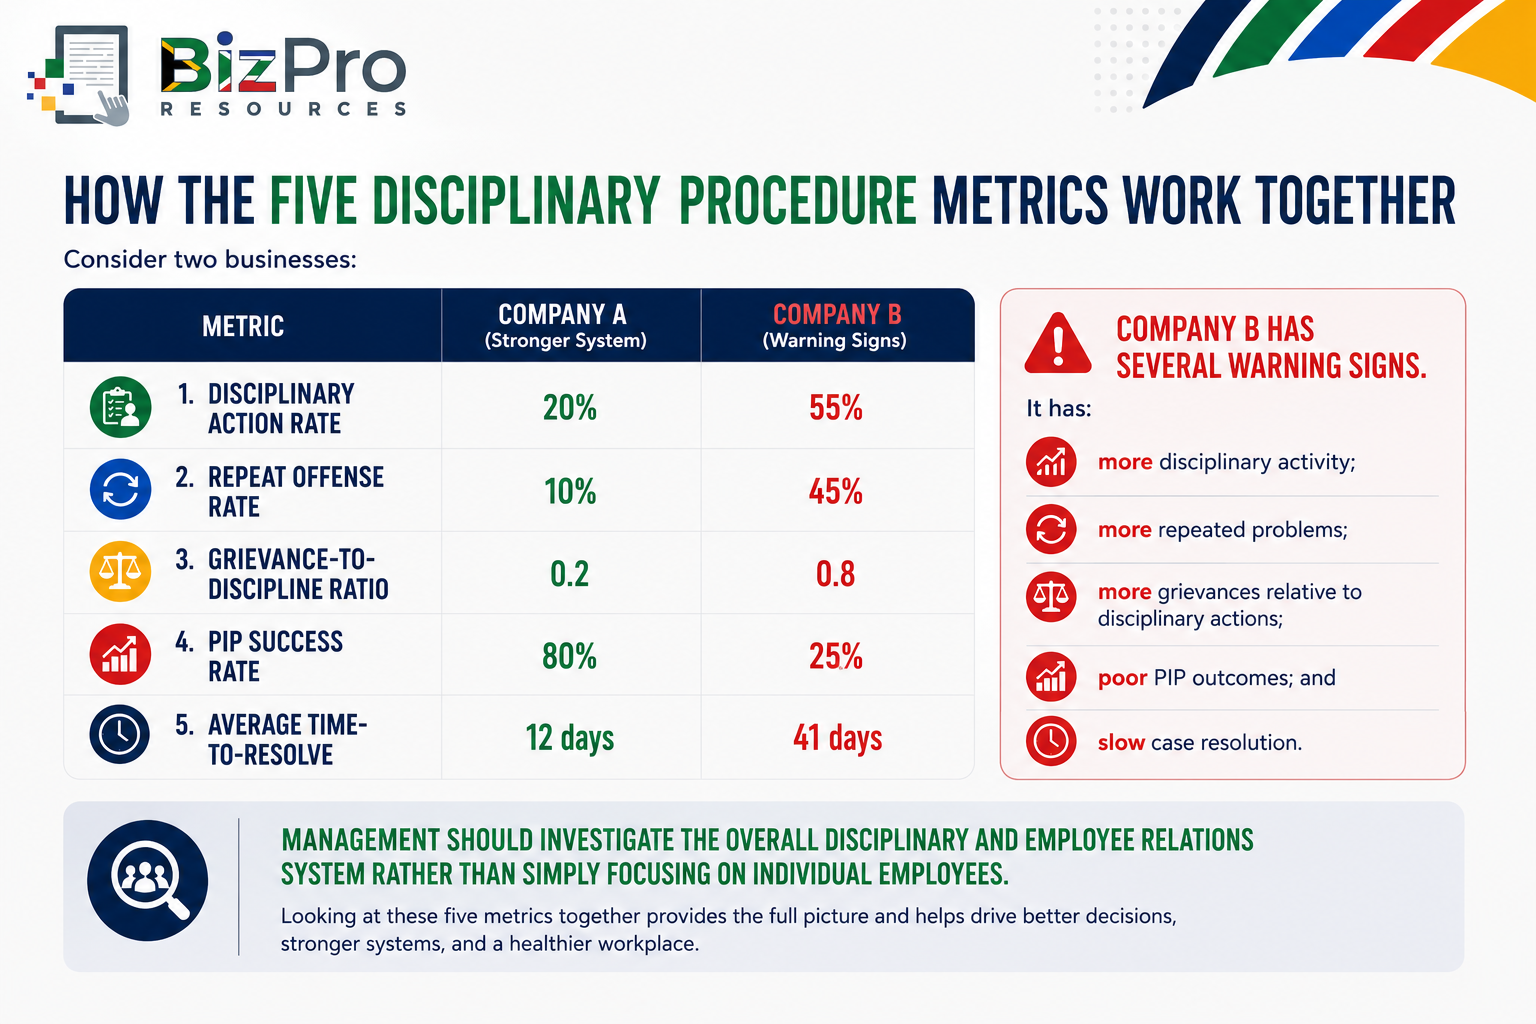
Management should investigate the overall disciplinary and employee relations system rather than simply focusing on individual employees.
Look for Patterns by Department and Supervisor
Company-wide averages can hide important information.
Suppose a business records 30 disciplinary actions.
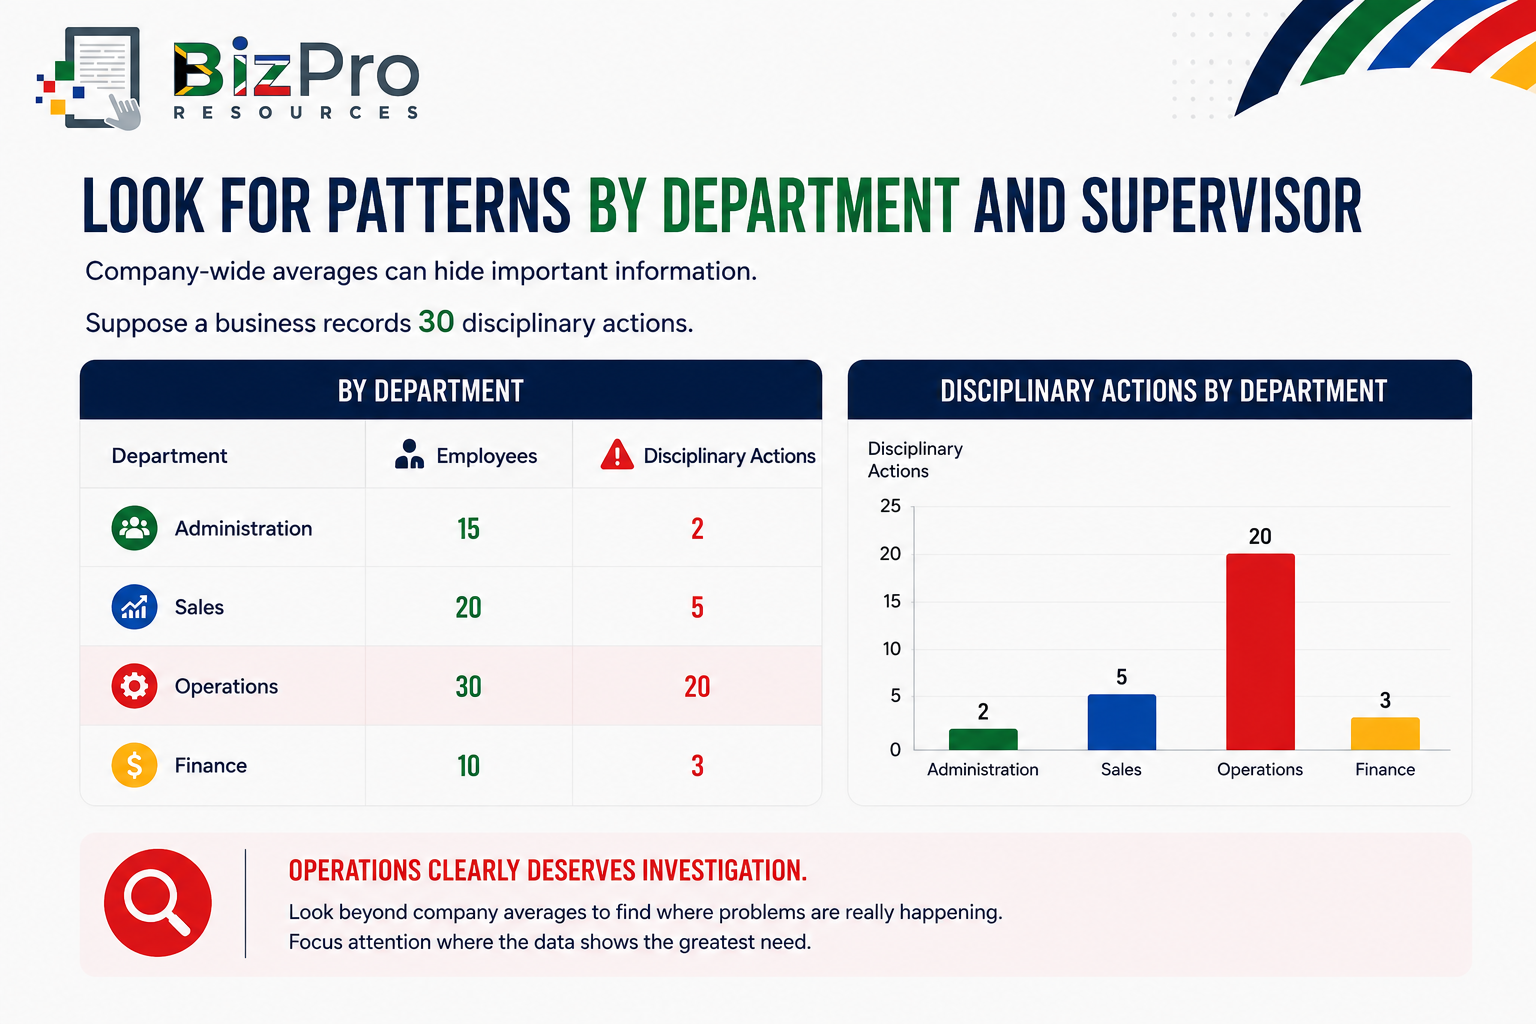
Operations clearly deserves investigation.
But management should go further.
Perhaps most of the 20 actions come from one supervisor's team.
That could indicate:
a genuine discipline problem within that team;
unclear expectations;
poor employee selection;
weak training;
difficult working conditions;
inconsistent supervision; or
inappropriate management practices.
The data tells management where to look.
Investigation helps determine why the pattern exists.
Track the Type of Disciplinary Problem
Do not only count disciplinary actions.
Record their causes.
For example:
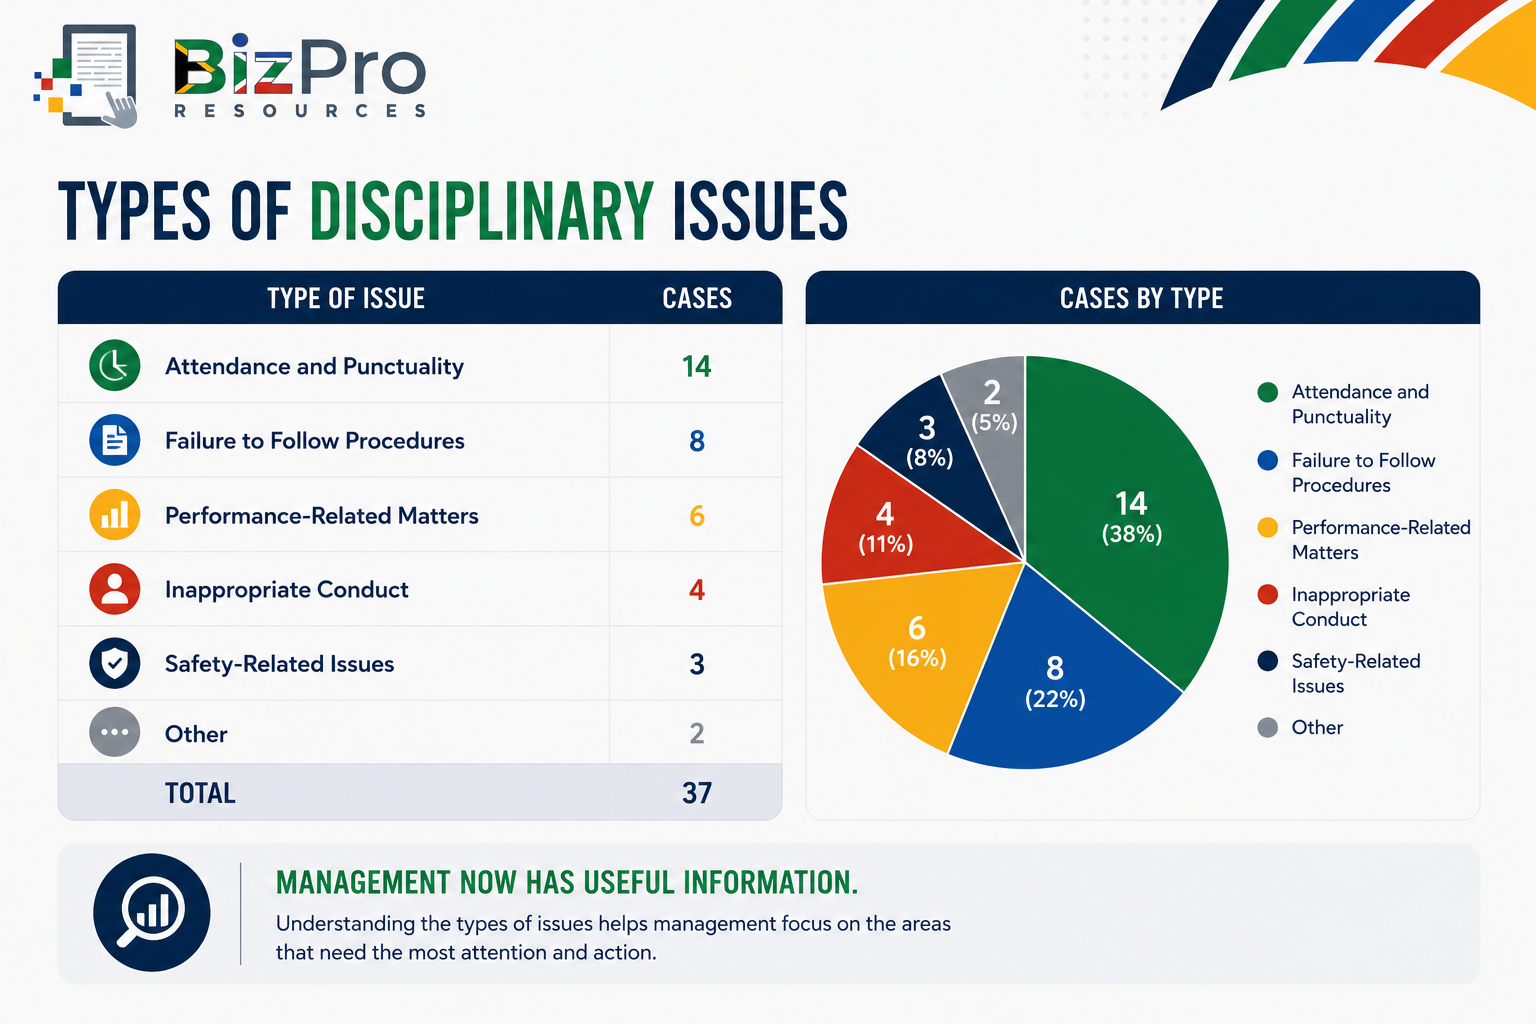
Management now has useful information.
If attendance represents the largest category, the business can investigate attendance specifically.
If safety-related disciplinary issues suddenly increase, management can review:
safety training;
supervision;
procedures;
equipment; and
workplace conditions.
This is much more useful than simply reporting:
"We had 37 disciplinary cases."
Distinguish Misconduct from Poor Performance
This distinction is particularly important:
Misconduct generally concerns behaviour or a breach of workplace rules.
Poor performance concerns an employee's ability or failure to meet required performance standards.
They should not automatically be managed in exactly the same way.
For example:
An employee deliberately ignoring a reasonable workplace rule may involve misconduct.
An employee who is trying to perform but lacks the required skill may involve poor performance and may require:
guidance;
training;
counselling;
clearer standards; or
a Performance Improvement Plan.
Good HR metrics should therefore classify cases properly.
Otherwise, management may combine very different problems into one number.
Be Careful with Targets
Some business metrics have obvious directions. Higher sales may generally be desirable. Lower costs may generally be desirable.
Disciplinary metrics are more complicated.
For example:
Is a Low Disciplinary Action Rate Good?
Possibly.
It may indicate a well-managed workforce.
But it could also indicate managers are ignoring misconduct.
Is a High PIP Success Rate Good?
Generally, yes.
But a 100% result might deserve investigation if managers only put employees on PIPs when success is virtually guaranteed.
Is a Low Grievance-to-Discipline Ratio Good?
Possibly.
But it could also mean employees are afraid to raise grievances.
Is a Very Short Time-to-Resolve Good?
It may indicate efficiency.
Or it may indicate cases are being rushed.
Metrics require judgement.
Build a Simple Disciplinary Procedures Dashboard
A small business can begin with a spreadsheet.
A quarterly dashboard might look like this:
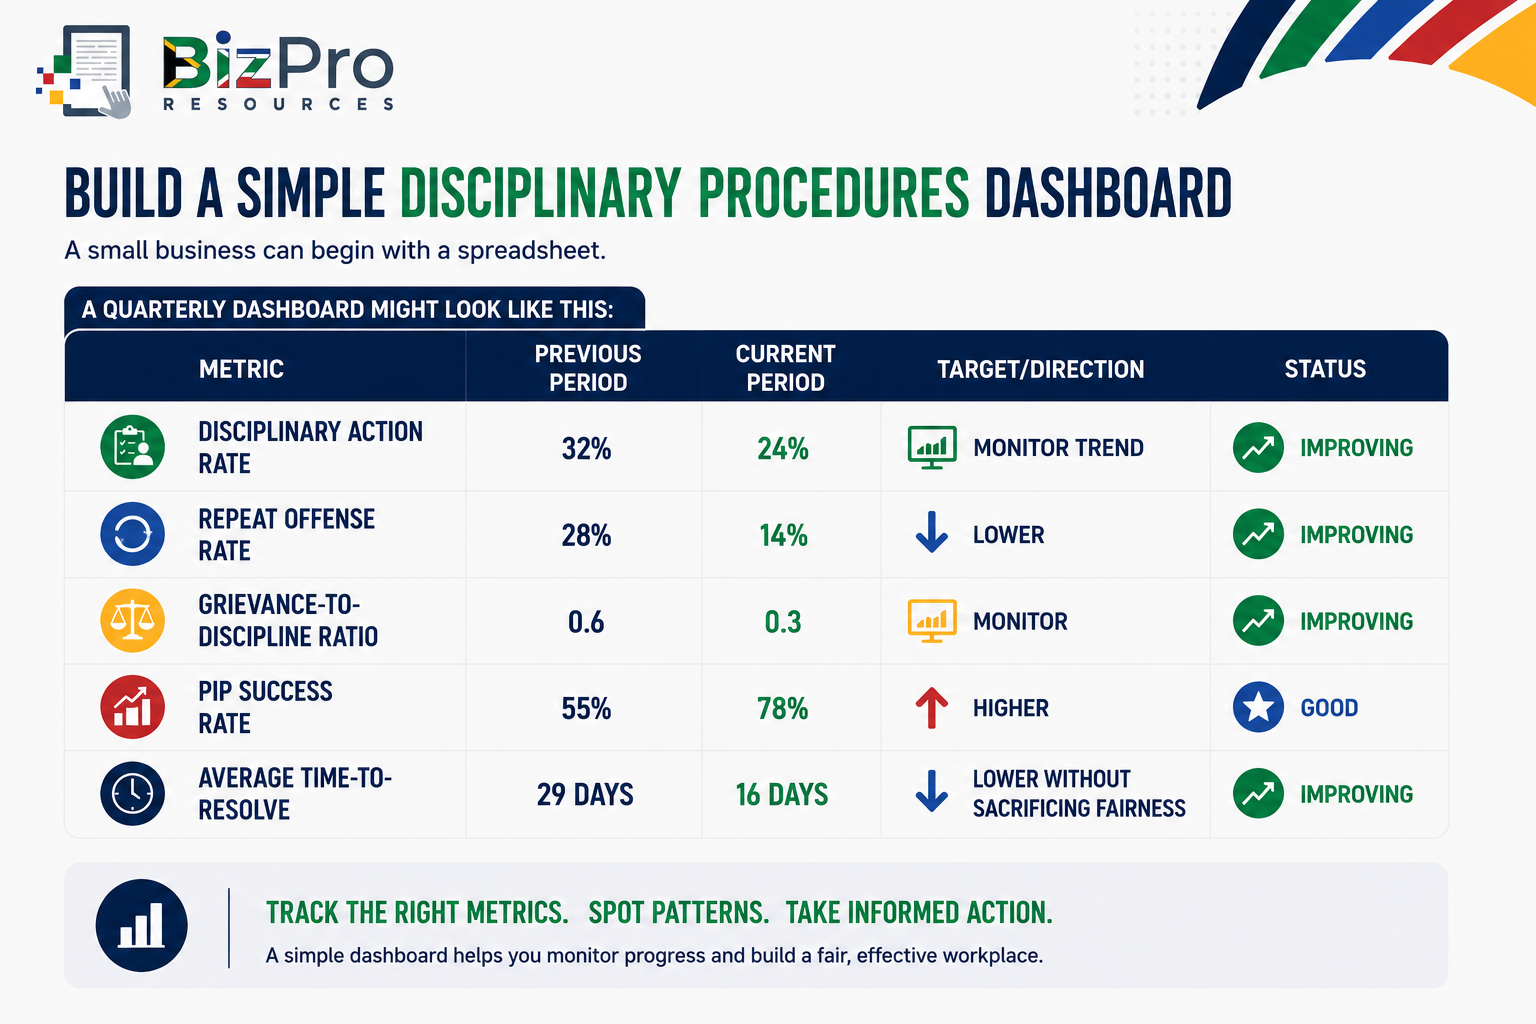
The dashboard provides management with a quick overview.
But every number should still be supported by case information.
Connect Disciplinary Metrics to Other HR Metrics
Disciplinary data becomes even more useful when compared with other Human Resource metrics.
For example:
High Disciplinary Action Rate + High Employee Turnover -may indicate broader workforce problems.
High Repeat Offense Rate + Low Employee Satisfaction -may indicate ineffective management or poor employee relations.
High Absenteeism + Many Attendance Disciplinary Cases -may identify a specific attendance problem that deserves deeper investigation.
Low PIP Success Rate + Poor Training ROI - may indicate weaknesses in employee development.
High Grievance Activity + Falling eNPS - may indicate deteriorating employee sentiment.
This is why HR metrics should eventually be viewed as a connected system rather than separate numbers.
Documentation Matters
Disciplinary metrics depend on accurate records.
If one supervisor records every formal action and another records almost nothing, the data becomes unreliable.
A practical disciplinary record might include:
employee or anonymous reference number;
department;
supervisor;
date opened;
type of matter;
category of issue;
previous related action where relevant;
outcome;
date resolved;
resolution time; and
whether the problem later repeated.
Sensitive employee information should be handled appropriately and access should be controlled.
The purpose of the dashboard is to understand patterns, not to create a public list of employees who have been disciplined.
Fairness Comes Before the Metric
Disciplinary metrics should never replace fair procedures.
Managers should not think: "Our average resolution time is 10 days, so this case must be finished within 10 days."
Some matters are simple. Others are complicated.
A serious allegation may require:
investigation;
documentation;
witnesses;
appropriate notice;
a formal process; and
careful consideration of evidence.
The business should always prioritise appropriate procedures and applicable South African employment law.
The metric is there to identify unnecessary delays and patterns.
It is not a deadline that overrides fairness.
Turning Disciplinary Data into Action
A useful management cycle remains:
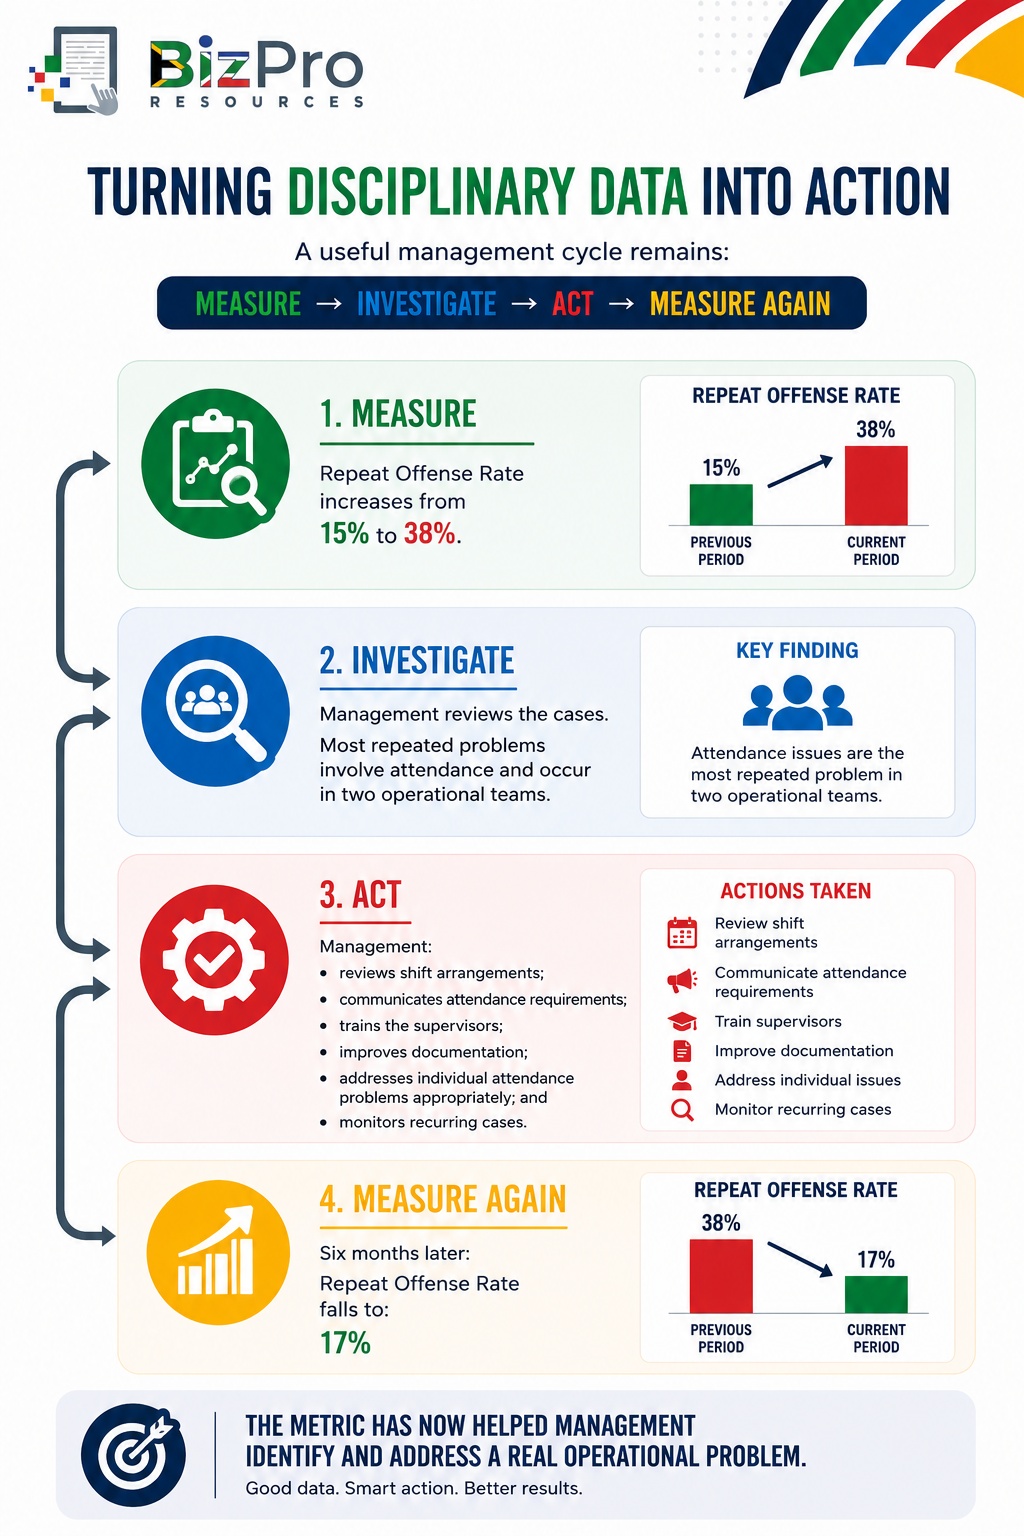
The metric has now helped management identify and address a real operational problem.
Questions to Ask Every Quarter
When reviewing disciplinary procedure metrics, management should ask:
Is disciplinary activity increasing or decreasing?
Which types of disciplinary issues occur most often?
Are particular departments experiencing more problems?
Are particular supervisors responsible for unusually high disciplinary activity?
Are workplace rules clear?
Are rules being applied consistently?
Are employees repeating the same problems after corrective action?
Are disciplinary interventions actually changing behaviour?
Are grievances increasing?
What are employees complaining about?
Do grievance patterns relate to particular managers or procedures?
Are Performance Improvement Plans producing genuine improvement?
Are PIP targets clear and reasonable?
Are employees receiving appropriate support?
How long are disciplinary matters taking to resolve?
Where are delays occurring?
Are cases being handled efficiently without being rushed?
Are misconduct and poor performance being treated appropriately as different issues?
Are managers keeping proper records?
What patterns require further investigation?
These questions turn disciplinary information into management information.
What Does Good Disciplinary Management Look Like?
Good disciplinary management is not a workplace where the company issues hundreds of warnings.
It is also not a workplace where nobody is ever disciplined.
A healthy system should aim for:
clear workplace rules;
reasonable expectations;
consistent management;
proper employee communication;
appropriate corrective action;
fair procedures;
effective performance improvement;
reasonable resolution times;
good documentation; and
fewer repeated problems.
The objective is not punishment.
The objective is a workplace where employees understand what is expected and where problems are addressed appropriately when they occur.
Final Thoughts
Disciplinary procedures are an important part of workforce management, but they should never operate only as a reaction to individual incidents.
Businesses should also look for patterns.
Disciplinary Action Rate shows how frequently formal disciplinary action is occurring.
Repeat Offense Rate helps determine whether corrective action is actually changing behaviour.
Grievance-to-Discipline Ratio provides another perspective on employee relations and how grievance activity compares with disciplinary activity.
PIP Success Rate shows whether formal performance improvement efforts are helping employees reach required standards.
Time-to-Resolve measures whether cases are being managed efficiently.
No single number tells management whether its disciplinary system is good or bad.
The numbers must be interpreted together with:
the circumstances;
the type of cases;
employee feedback;
management behaviour;
workplace conditions;
proper documentation; and
applicable employment law.
The most useful approach is simple:
Measure.
Investigate.
Act fairly.
Measure again.
When disciplinary metrics are used correctly, they are not tools for finding more reasons to punish employees.
They are tools for understanding workplace problems, improving management, strengthening fairness, correcting behaviour, and creating a more stable and professionally managed business.
Related Articles in the HR Performance Metrics Series
Rentention and Workforce Health Metrics
Productivity and Value Metrics
Disciplinary Procedure Metrics
AI Disclaimer
AI Tools were used to assist with research. Remember to always cross-check everything that you read.


