

Recruiting and Hiring Metrics: How to Measure and Improve Your Hiring Process
Article #1 of #4 in the HR Performance Metrics Series
Introduction
Hiring the right employee can make a major difference to a small business.
A good employee can improve productivity, strengthen customer service, reduce pressure on other employees, and help the business grow. A poor hiring decision can have the opposite effect. It can lead to additional recruitment costs, lower productivity, employee conflict, customer complaints, and the need to start the recruitment process again.
For many small businesses, however, recruitment is managed mainly through instinct.
A manager may say:
"It took us too long to fill that position."
"Recruitment is getting expensive."
"We are struggling to find good people."
"Candidates keep rejecting our offers."
"The new employee looked good during the interview, but is not performing."
These observations may be correct, but they do not tell you exactly where the problem is.
This is where recruiting and hiring metrics become useful.
Recruiting metrics allow you to measure different parts of the hiring process so that you can identify problems, compare results, and improve future recruitment decisions.
Four particularly useful metrics for small businesses are:
Time to Hire
Cost per Hire
Quality per Hire
Acceptance Rate
These metrics answer four important questions:
How quickly are we hiring?
How much is hiring costing us?
Are we hiring good employees?
Are the people we want to hire accepting our offers?
Used together, these metrics provide a practical picture of how well your recruitment process is working.
Why Recruiting and Hiring Metrics Matter
Recruitment can easily become an expensive business activity without the owner or manager realising it.
Consider a small electrical contracting company that needs another qualified electrician.
The position remains vacant for six weeks.
During this period:
existing electricians work overtime;
some jobs are delayed;
the owner spends hours reviewing CVs;
supervisors conduct several interviews;
recruitment advertisements are paid for;
the business uses temporary workers;
employees become frustrated by the additional workload; and
the company may have to turn down work because it does not have enough capacity.
Eventually, someone is hired. Three months later, the employee leaves. The company now has to start again.
The real cost of this recruitment problem is therefore much greater than the cost of placing a job advertisement.
Recruitment metrics help management identify these problems earlier.
The objective is not necessarily to recruit as cheaply or as quickly as possible.
The objective is to create a recruitment process that is reasonably fast, cost-effective, and capable of consistently bringing suitable employees into the business.
1. Time to Hire
What Is Time to Hire?
Time to Hire measures how long it takes to move a candidate through the recruitment process until that candidate accepts the company's job offer.
It focuses mainly on the efficiency of the recruitment and selection process:
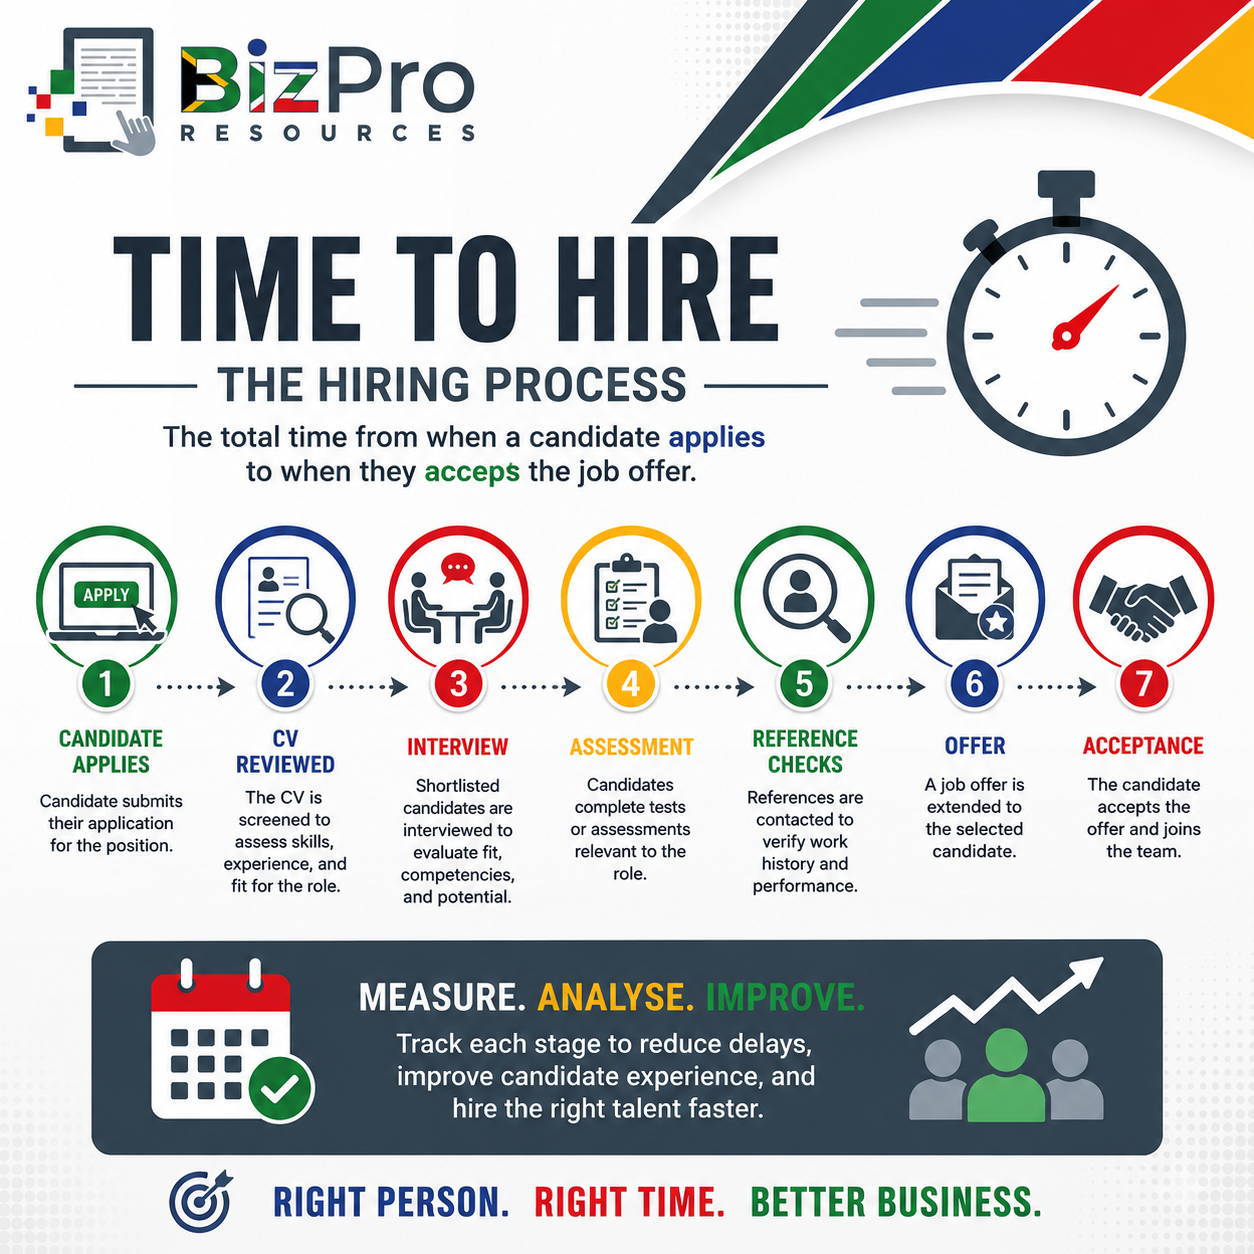
If this process regularly takes too long, good candidates may accept positions elsewhere before your business makes a decision.
Time to Hire should not be confused with another metric sometimes called Time to Fill.
Time to Fill normally measures the broader period from when a vacancy is opened or approved until it is filled.
Time to Hire usually focuses on the period from when the successful candidate enters the recruitment process until they accept the offer.
A small business can use either metric, but management should define exactly what it is measuring and use the same definition consistently.
How Is Time to Hire Calculated?
A simple calculation is: Time to Hire = Date Candidate Accepts Offer − Date Candidate Entered Recruitment Process
For example:
A candidate applies on 3 March.
After interviews and reference checks, the company makes an offer.
The candidate accepts the offer on 17 March.
The Time to Hire is: 17 March − 3 March = 14 days
If you hire several employees, you can calculate an average: Average Time to Hire = Total Time to Hire for All Successful Candidates ÷ Number of Hires
Suppose four employees had the following results:
Employee A - 12 days
Employee B - 18 days
Employee C - 16 days
Employee D - 14 days
Total = 60 days
Average Time to Hire: 60 ÷ 4 = 15 days
The company's average Time to Hire is therefore 15 days.
Example of Poor Time to Hire Performance
Imagine a small security company needs to recruit a control room supervisor.
A strong candidate applies and completes an interview.
However:
the manager takes a week to review the interview;
the second interview is delayed;
reference checks only begin several days later;
management takes another week to approve the salary; and
the employment offer is eventually sent 35 days after the candidate originally applied.
The company's Time to Hire is: 35 days
During this period, the candidate is also interviewing with another employer. The other company makes an offer first. The candidate accepts it. The security company loses a suitable candidate and must continue recruiting.
What Does This Mean for the Company?
A long Time to Hire may indicate:
slow decision-making;
unnecessary recruitment stages;
poor communication between managers;
delayed interviews;
slow reference or background checks;
unclear authority to approve appointments;
unrealistic recruitment requirements; or
difficulty finding suitable candidates.
A vacancy that remains open can also create indirect costs.
Other employees may have to work overtime. Managers may have to perform operational work instead of management work. Customer service may suffer. Revenue opportunities may be lost.
However, a long Time to Hire is not automatically bad.
Specialist or senior positions may genuinely require more time.
The important question is: Is the recruitment process taking longer than necessary?
Example of Good Time to Hire Performance
Now imagine the company improves its process:
Applications are reviewed twice per week.
Suitable candidates receive interview invitations quickly.
The first and second interviews are scheduled close together.
Reference checks begin immediately after the final interview.
The responsible manager already knows the salary range and has authority to approve an offer within that range.
A strong candidate applies on 5 June and accepts an offer on 17 June.
Time to Hire = 12 days
What Does This Mean for the Company?
A reasonable Time to Hire may indicate that:
recruitment responsibilities are clear;
managers make decisions quickly;
interviews are organised efficiently;
approvals are not unnecessarily delayed;
suitable candidates receive regular communication; and
the company is able to compete for good employees.
But management must not reduce Time to Hire by removing important checks. Hiring someone quickly who turns out to be unsuitable is not good recruitment.
This is why Time to Hire should eventually be considered together with Quality per Hire.
2. Cost per Hire
What Is Cost per Hire?
Cost per Hire measures how much the business spends, on average, to recruit and appoint a new employee.
Many small business owners underestimate this cost because they only consider obvious expenses such as recruitment advertisements.
The real recruitment cost may include:
online job advertisements;
recruitment agency fees;
background checks;
qualification verification;
medical examinations where appropriate;
skills assessments;
interview expenses;
travel expenses;
recruitment software;
employee referral payments; and
other direct recruitment expenses.
You may also decide to include internal recruitment costs, such as the value of management and HR time spent recruiting.
The important point is consistency.
Decide which recruitment costs your business will include and use the same method every time.
How Is Cost per Hire Calculated?
A simple formula is: Cost per Hire = Total Recruitment Costs ÷ Number of Employees Hired
Suppose a business recruits five employees during a quarter. The costs would look something like this:
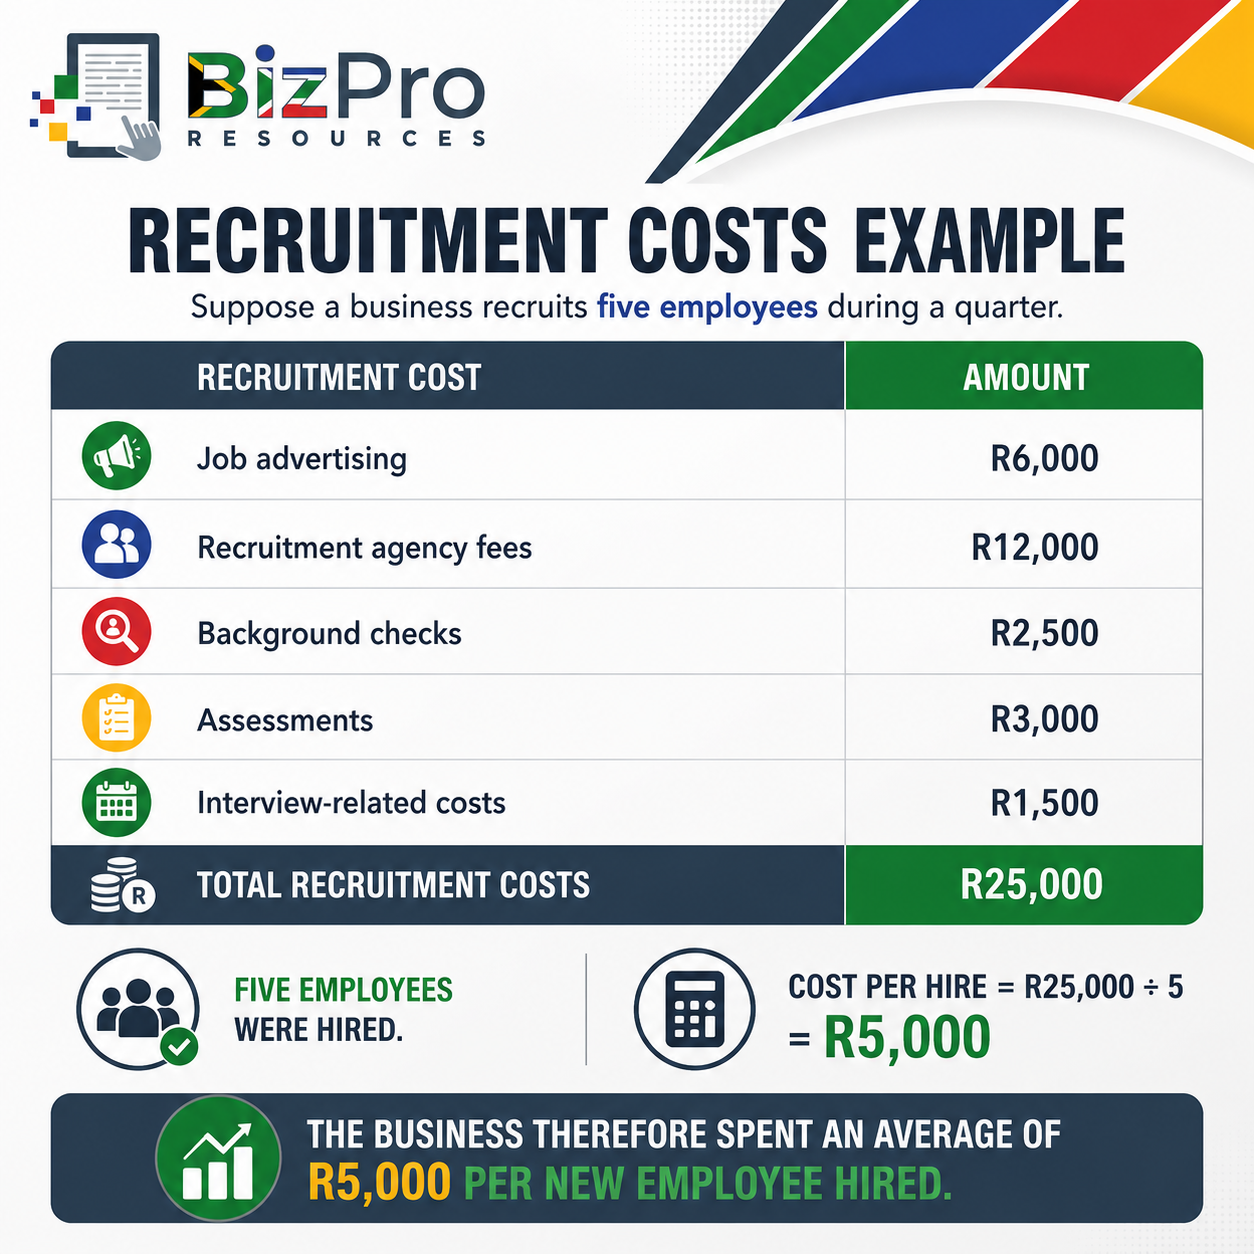
The business therefore spent an average of R5,000 per new employee hired.
Example of Poor Cost per Hire Performance
Consider a small accounting firm that hires three junior employees.
The firm spends:
R15,000 on agency fees;
R8,000 on advertising;
R4,000 on assessments;
R3,000 on background checks; and
R6,000 on other recruitment expenses.
Total recruitment cost: R36,000
Number of hires: 3
Cost per Hire: R36,000 ÷ 3 = R12,000
Management investigates and discovers that several recruitment expenses are being duplicated.
The company is advertising vacancies on multiple paid platforms even though most successful candidates come from only one platform.
An agency is also being used for positions the business could reasonably recruit itself.
What Does This Mean for the Company?
A high Cost per Hire may indicate:
excessive recruitment agency use;
ineffective advertising;
poor choice of recruitment channels;
repeated recruitment because employees leave quickly;
unnecessary assessments;
inefficient recruitment processes; or
difficulty attracting candidates.
For a small business hiring frequently, these costs can become significant.
If 20 employees are hired during the year at R12,000 each: 20 × R12,000 = R240,000
Recruitment has become a R240,000 annual expense.
That deserves management attention.
Example of Good Cost per Hire Performance
The accounting firm changes its recruitment approach.
It tracks where successful candidates come from and stops paying for recruitment channels that produce poor results.
It introduces an employee referral programme and uses recruitment agencies only for specialist positions.
The following year, the business spends R60,000 recruiting 15 employees:
Cost per Hire = R60,000 ÷ 15
Cost per Hire = R4,000
What Does This Mean for the Company?
The lower Cost per Hire may indicate that the business is using recruitment resources more efficiently.
However, a low Cost per Hire is only positive if the company is still attracting and appointing suitable people.
Saving R5,000 during recruitment means very little if the new employee performs poorly and leaves three months later.
Therefore: Cheap recruitment is not necessarily good recruitment.
Cost per Hire should be considered together with employee performance, retention, and Quality per Hire.
3. Quality per Hire
What Is Quality per Hire?
Quality per Hire, also commonly called Quality of Hire, attempts to measure whether newly appointed employees actually become good employees.
This is one of the most important recruitment metrics because hiring is ultimately about more than filling vacancies.
The business needs people who can perform.
A candidate may:
have an impressive CV;
interview extremely well;
provide good references; and
accept the company's salary offer.
But the real test comes after appointment.
Can the employee perform the work?
Do they achieve their goals?
Do they work effectively with others?
Do they meet quality standards?
Do they provide good customer service?
Do they remain with the business?
Quality per Hire attempts to turn these outcomes into something management can measure.
How Is Quality per Hire Calculated?
There is no single calculation that works for every business. A practical small-business method is to create a score using several measures.
For example: Quality per Hire Score = (Performance Score + Goal Achievement Score + Manager Satisfaction Score) ÷ 3
Each measure could be scored as a percentage.
Suppose a new employee receives:
Performance Score = 80%
Goal Achievement = 85%
Manager Satisfaction = 75%
The calculation is: (80% + 85% + 75%) ÷ 3 = 80%
The employee's Quality per Hire score is therefore: 80%
You could also include other measures such as:
attendance;
customer feedback;
probation results;
productivity;
quality of work;
disciplinary record; or
retention after 6 or 12 months.
The exact formula is less important than using a reasonable and consistent system.
Example of Poor Quality per Hire Performance
A plumbing company recruits four plumbers during the year.
After six months, management evaluates them using three measures:
work performance;
goal achievement; and
supervisor satisfaction.
The average Quality per Hire score is only: 48%
Management also discovers that:
two employees require repeated supervision;
one has received several customer complaints;
rework has increased;
one employee has already resigned; and
experienced employees are spending additional time correcting mistakes.
What Does This Mean for the Company?
Poor Quality per Hire may indicate problems with:
job advertisements;
job descriptions;
candidate screening;
interview questions;
practical assessments;
reference checking;
qualification verification;
recruitment sources;
onboarding;
training; or
expectations communicated during recruitment.
It is important not to automatically blame recruitment.
A good candidate can become a poor-performing employee if the business provides weak induction, poor training, unclear instructions, inadequate equipment, or ineffective supervision.
Quality per Hire therefore encourages management to investigate the complete process.
Example of Good Quality per Hire Performance
The plumbing company improves its recruitment process:
Applicants now complete a practical skills assessment.
Interview questions focus more directly on the actual work.
References are checked properly.
New employees receive a structured induction and are paired with experienced employees during their first few weeks.
After six months, the average Quality per Hire score increases to: 84%
The new employees are:
completing jobs more independently;
receiving positive customer feedback;
meeting productivity expectations;
producing less rework; and
requiring less supervision.
What Does This Mean for the Company?
A strong Quality per Hire result suggests that the recruitment process is producing employees who match the company's requirements.
This can lead to:
higher productivity;
better customer service;
lower supervision requirements;
fewer mistakes;
lower employee turnover;
stronger teams; and
better return on recruitment spending.
Quality per Hire therefore helps management answer one of the most important recruitment questions: Are we simply filling vacancies, or are we hiring people who add value to the business?
4. Acceptance Rate
What Is Acceptance Rate?
Acceptance Rate measures the percentage of formal employment offers that candidates accept. It is sometimes called the Offer Acceptance Rate.
For example, if a company makes ten employment offers and eight candidates accept, its Acceptance Rate is 80%.
This metric is useful because recruitment does not end when management chooses a candidate. The candidate must also choose the company.
A business may find excellent candidates but still struggle to recruit them if its offers are regularly rejected.
How Is Acceptance Rate Calculated?
The formula is: Acceptance Rate = Number of Accepted Offers ÷ Total Number of Offers Made × 100
Suppose a company makes 12 formal job offers:
Nine candidates accept.
Acceptance Rate = 9 ÷ 12 × 100
Acceptance Rate = 75%
The company's Acceptance Rate is therefore 75%.
Example of Poor Acceptance Rate Performance
A small automotive repair business is recruiting technicians:
Over six months, it makes ten employment offers.
Only five candidates accept.
Acceptance Rate = 5 ÷ 10 × 100
Acceptance Rate = 50%
Half of the company's preferred candidates reject its offers. Management investigates the reasons.
Several candidates say that:
the salary is lower than competing offers;
working hours were only explained late in the recruitment process;
benefits were unclear;
the recruitment process took too long; and
communication from the company was poor.
What Does This Mean for the Company?
A low Acceptance Rate can indicate:
uncompetitive remuneration;
unattractive working conditions;
poor communication;
slow recruitment;
unrealistic candidate expectations;
unclear job descriptions;
poor employer reputation;
differences between what was discussed and what was formally offered; or
strong competition for employees with particular skills.
A low Acceptance Rate also increases recruitment costs.
If the preferred candidate rejects the offer, the business may have to approach the second-choice candidate or restart the recruitment process.
This increases Time to Hire and may increase Cost per Hire.
Example of Good Acceptance Rate Performance
The automotive business reviews its recruitment process.
It checks market-related salaries, clearly explains working hours during the first interview, improves communication, and sends employment offers quickly after final decisions.
During the next six months, it makes ten offers:
Nine are accepted.
Acceptance Rate = 9 ÷ 10 × 100
Acceptance Rate = 90%
What Does This Mean for the Company?
A strong Acceptance Rate may indicate that:
remuneration is reasonably competitive;
candidates understand the role;
expectations are clear;
recruitment communication is effective;
offers are made quickly;
candidates have a positive impression of the company; and
the overall employment proposition is attractive.
However, an extremely high Acceptance Rate should not automatically be treated as proof that everything is perfect.
For example, the company may be offering salaries significantly above market rates.
The metric should therefore be considered together with recruitment costs, employee performance, and retention.
How the Four Recruiting Metrics Work Together
The real value of these metrics becomes clearer when they are considered together. Using a single metric can easily give management the wrong impression.
Consider these examples:
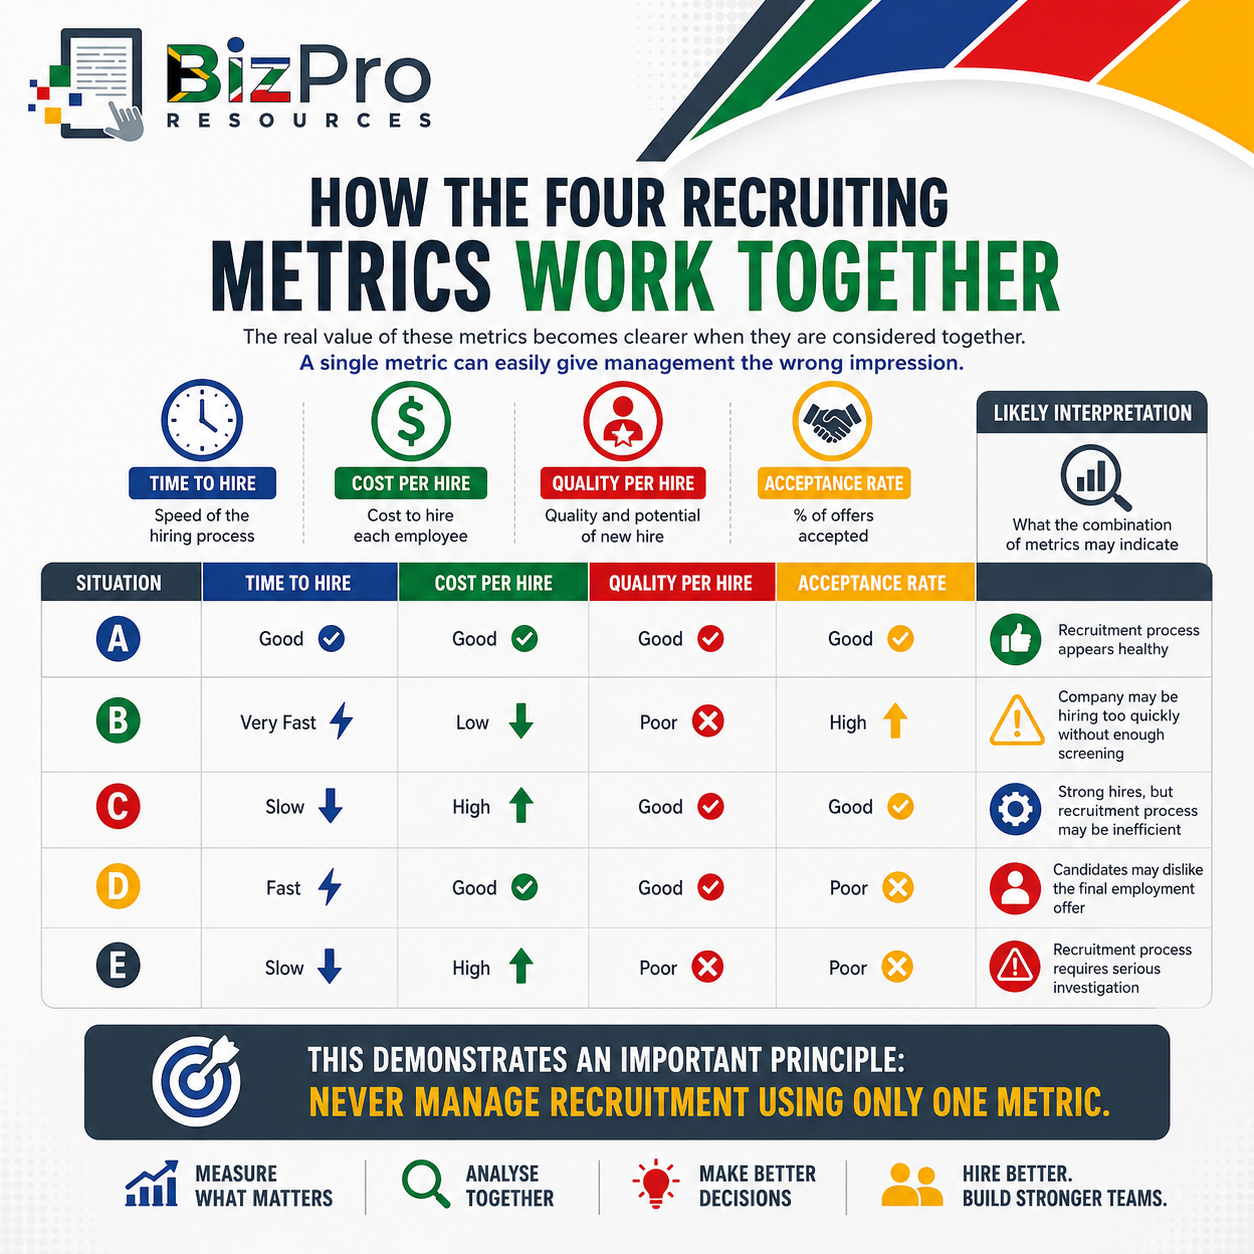
This demonstrates an important principle: Never manage recruitment using only one metric.
For example, management might decide: "Our Time to Hire is too high. We need to hire people faster."
The company then removes assessments and reference checks.
Time to Hire improves from 25 days to 12 days. Management celebrates.
Six months later, Quality per Hire has fallen significantly and employee turnover has increased.
The company improved one number while damaging the overall recruitment process.
Follow the Recruitment Funnel
Another useful approach is to think about recruitment as a funnel.
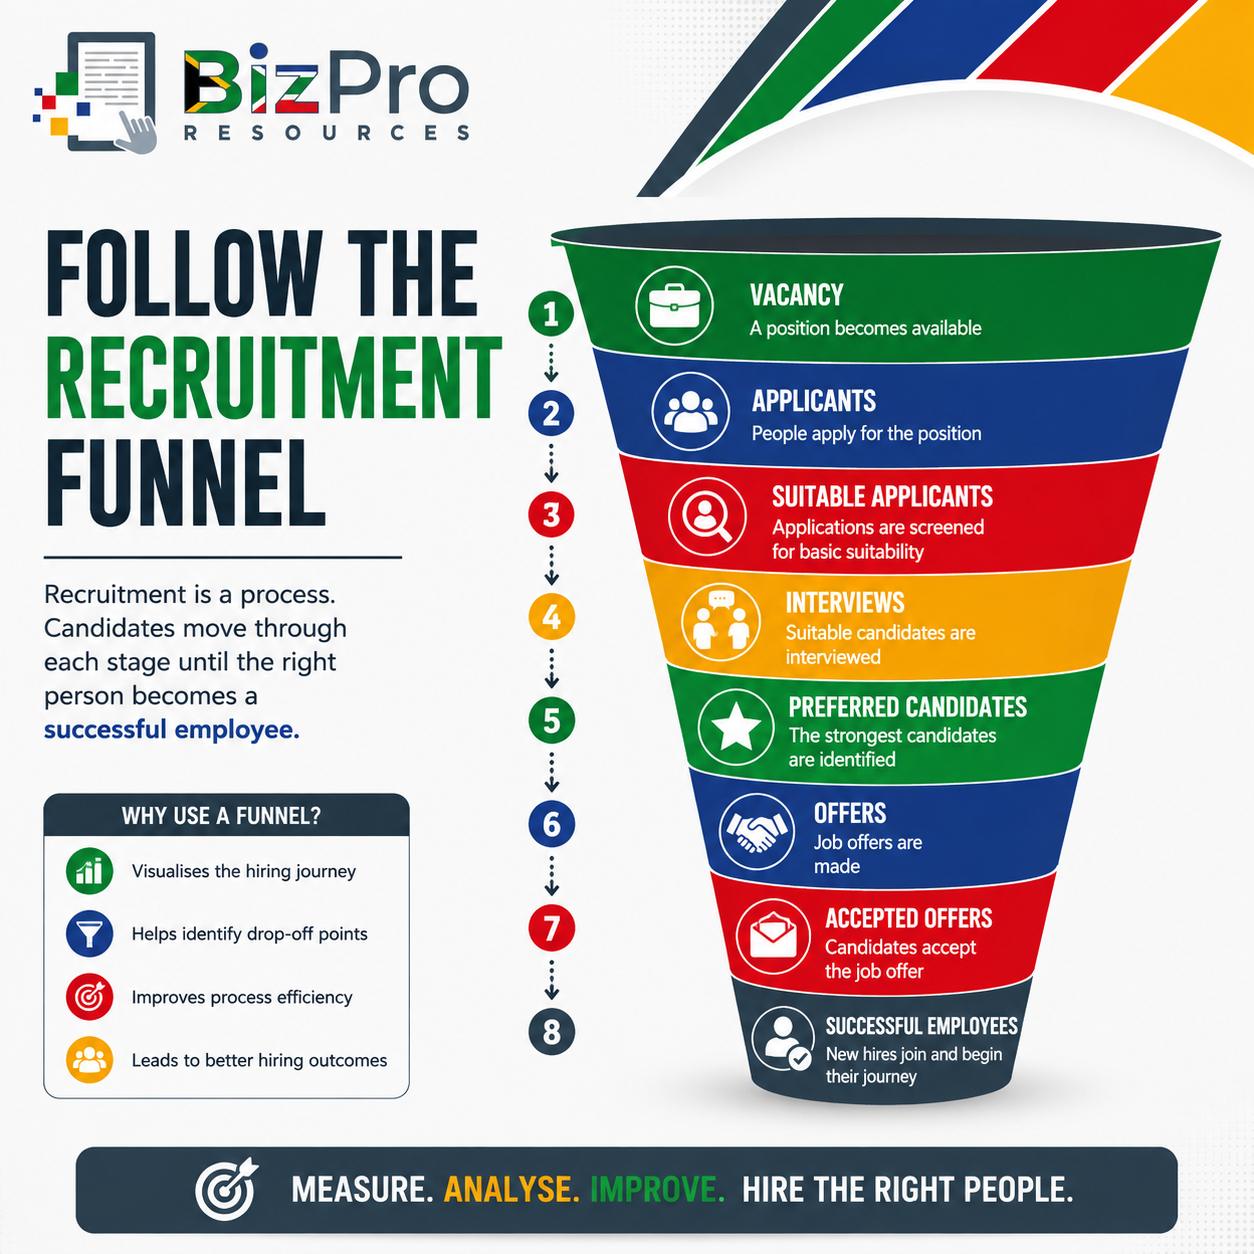
The four metrics discussed in this article measure different parts of this journey:
Time to Hire tells you how quickly candidates move through it.
Cost per Hire tells you how much the process costs.
Acceptance Rate tells you whether preferred candidates are willing to join the business.
Quality per Hire tells you whether the people eventually appointed become successful employees.
Together, they provide a much more complete picture.
Build a Simple Recruiting and Hiring Dashboard
You do not need expensive HR software to begin measuring recruitment. A small business can start with a spreadsheet.
A simple quarterly dashboard might look like this:
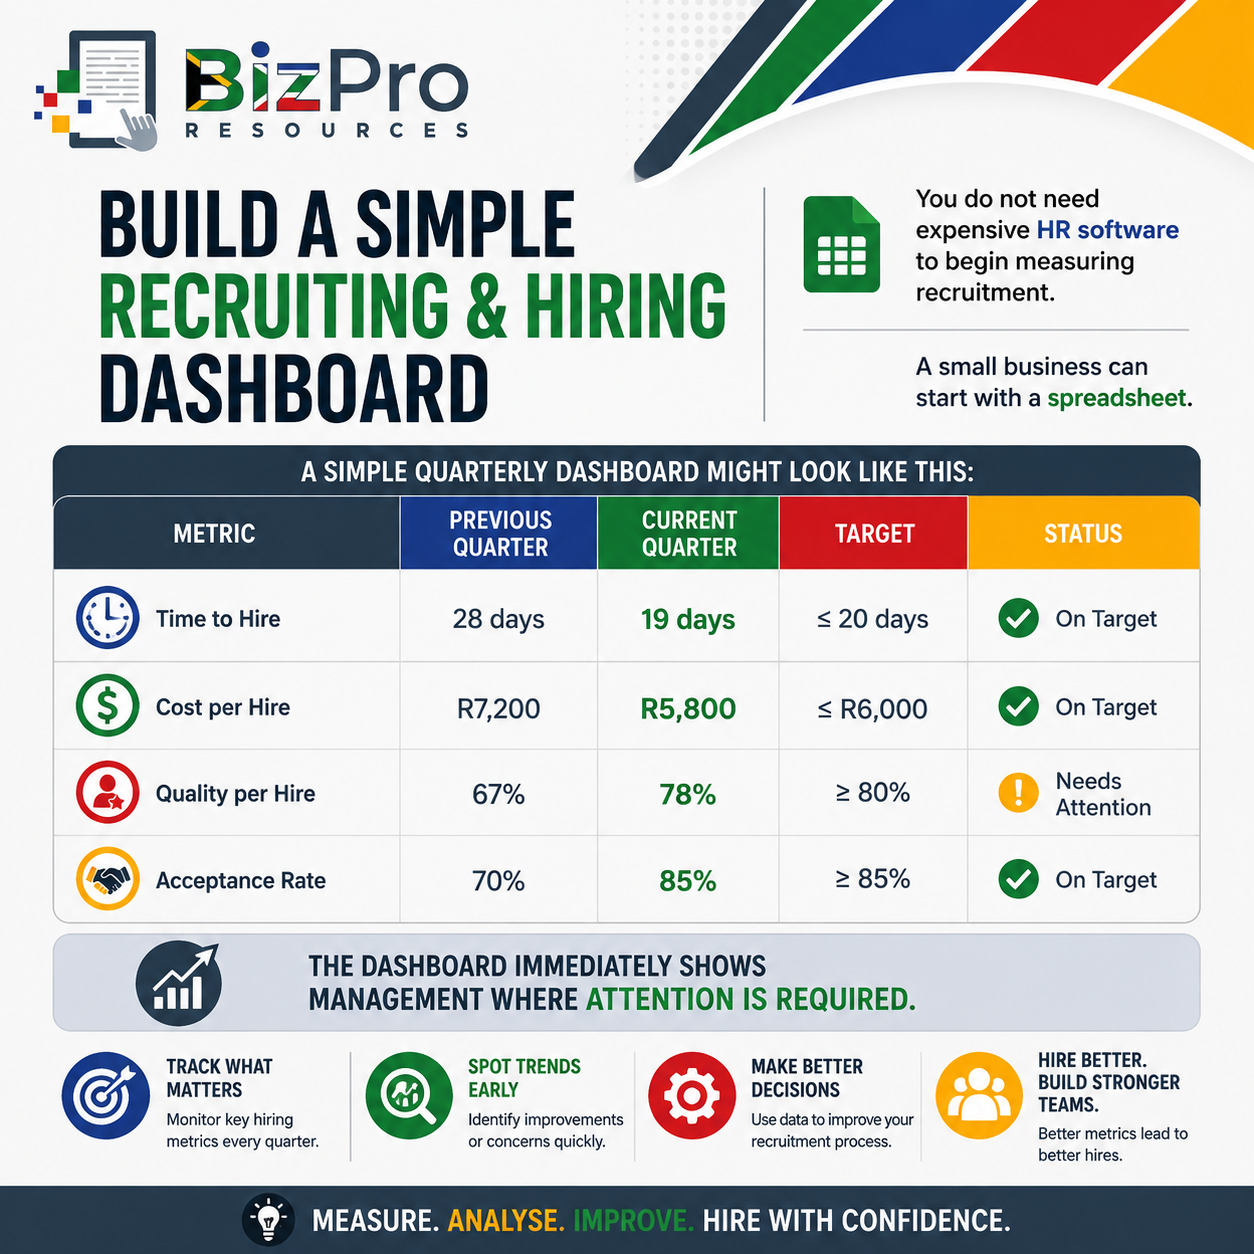
The dashboard immediately shows management where attention is required.
In this example, recruitment is faster, less expensive, and candidates are accepting offers. However, Quality per Hire remains below target.
Management should therefore investigate whether:
screening criteria need improvement;
interview questions are effective;
skills assessments are appropriate;
job requirements are clear; or
new employees need better onboarding and training.
This is much more useful than simply saying: "Recruitment seems better this quarter."
Segment Your Recruitment Data
As the business collects more information, avoid looking only at company-wide averages. Different jobs may produce very different recruitment results.
For example:
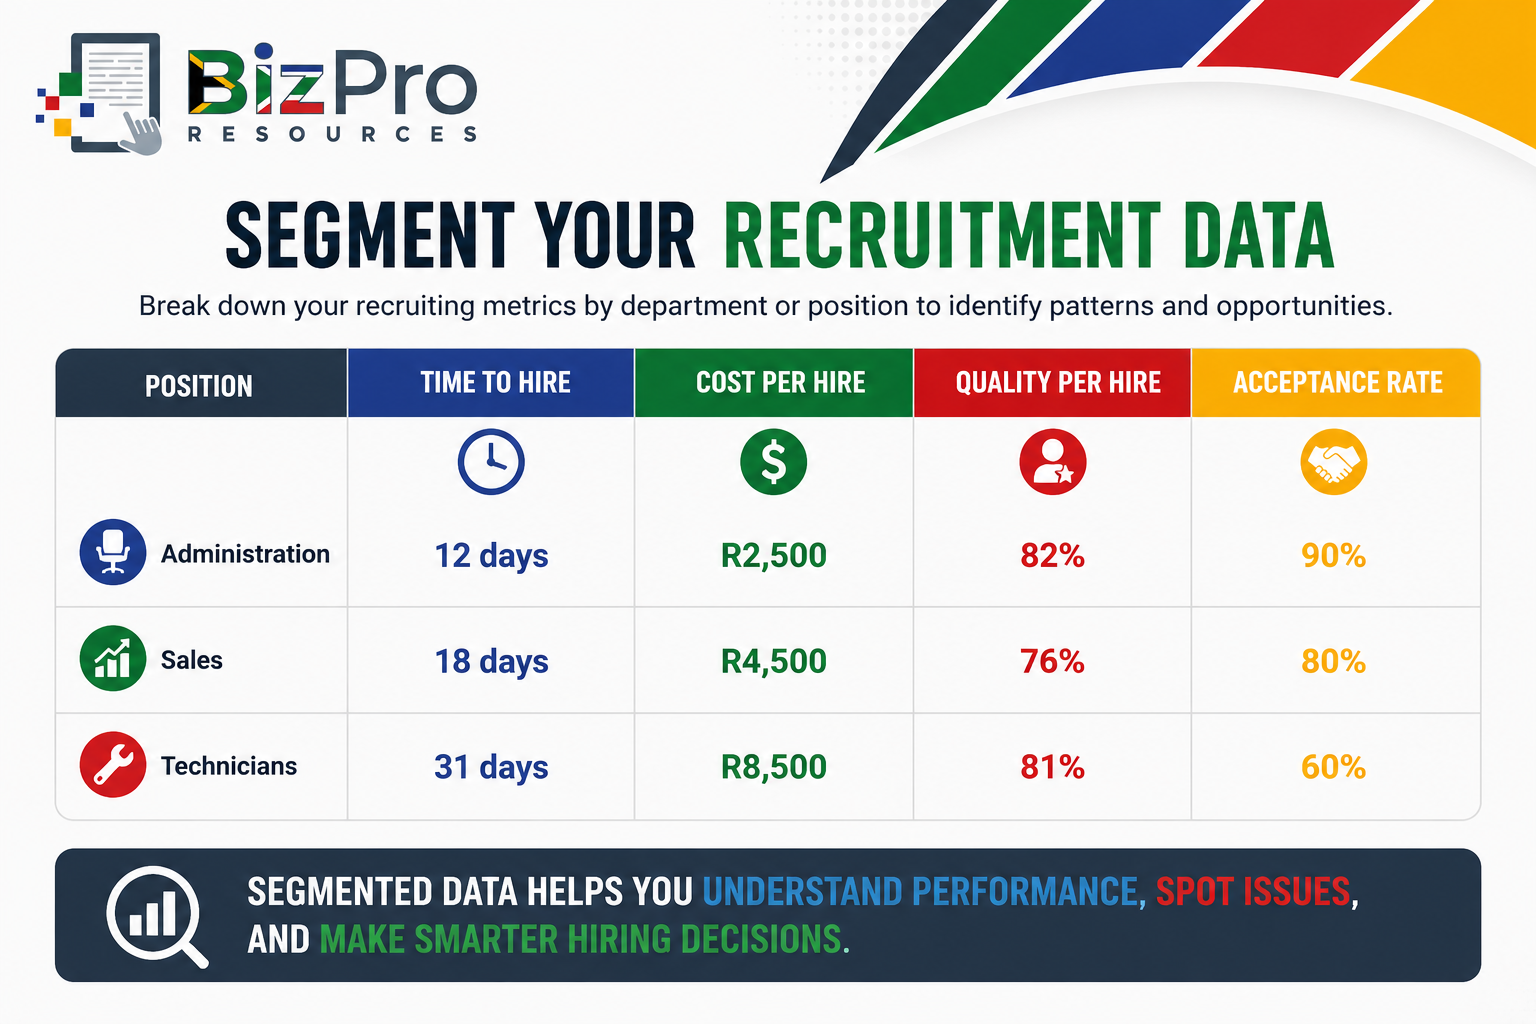
The company-wide average may look reasonable.
But the position-level data identifies a specific problem: Technician recruitment is slow, expensive, and has a low Acceptance Rate.
Management can now investigate the technician recruitment process instead of changing recruitment across the entire company.
You can also compare results by:
branch;
department;
recruitment source;
job level;
recruitment agency; or
hiring manager.
Measure Recruitment Sources
One of the most useful extensions of these metrics is measuring where successful employees come from.
Possible recruitment sources include:
job websites;
recruitment agencies;
employee referrals;
social media;
company websites;
colleges or training institutions;
professional networks; and
direct applications.
Suppose your business discovers the following:
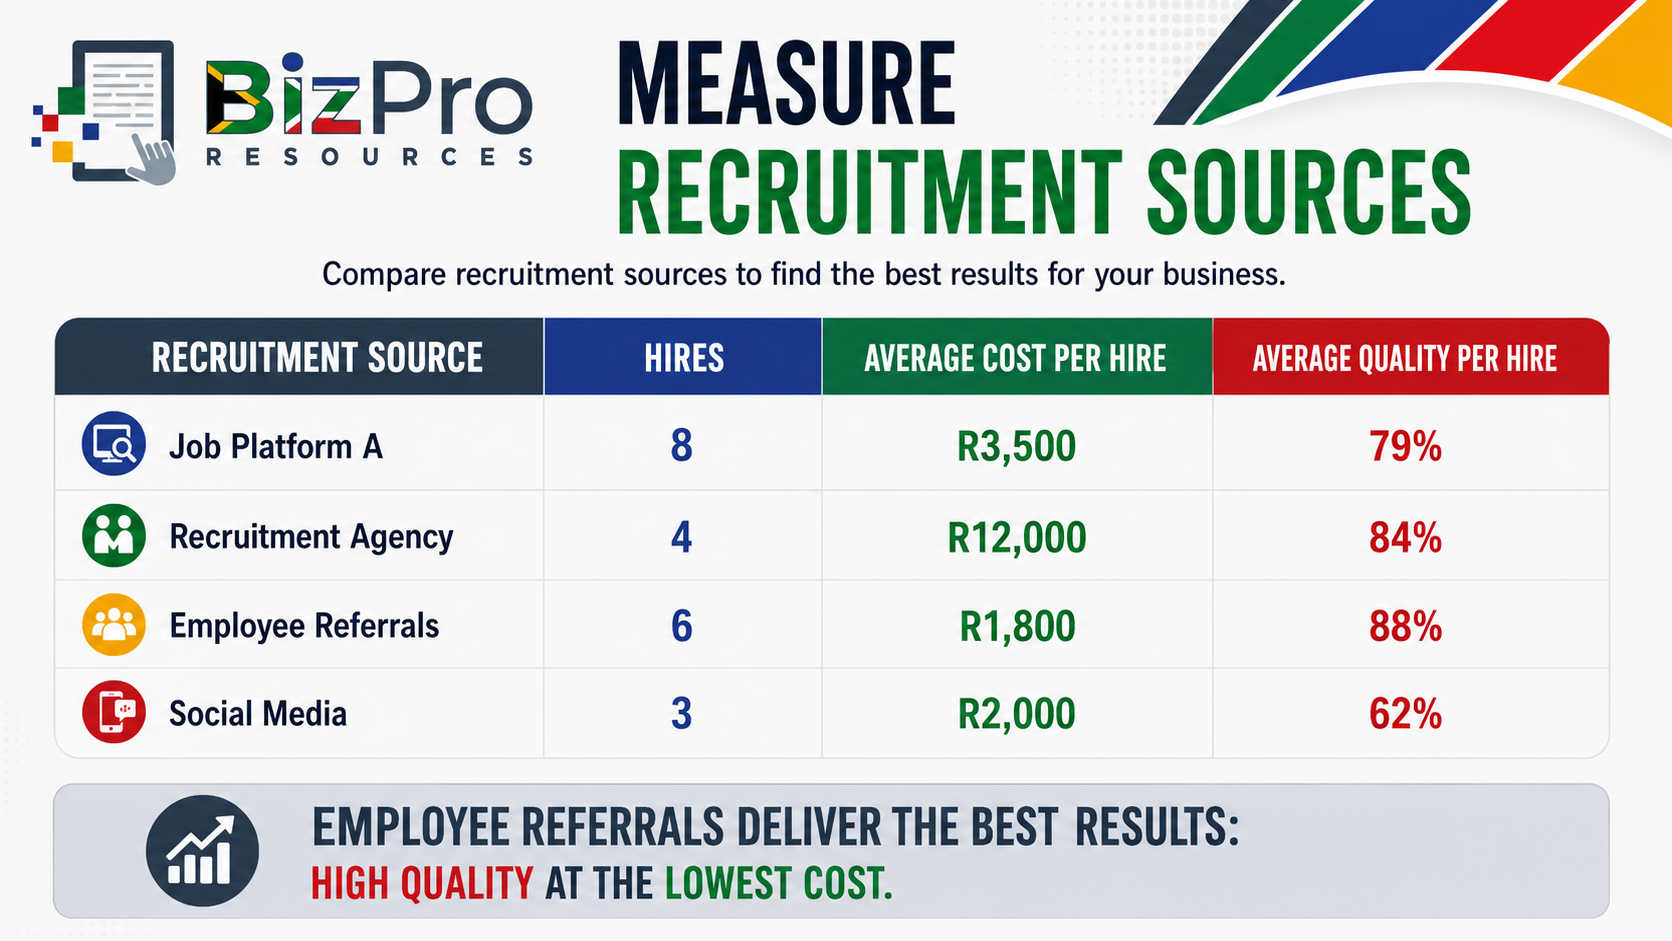
This information can change recruitment decisions:
Employee referrals appear to provide relatively inexpensive, high-quality hires.
The recruitment agency produces good employees, but at a much higher cost.
Social media is inexpensive, but the quality of hires is poor.
Management can now make better decisions about where to spend recruitment money.
Do Not Chase the Numbers Blindly
Metrics are management tools. They are not the objective themselves.
A business can create new problems when management becomes obsessed with achieving a particular number.
For example:
Trying to reduce Time to Hire too aggressively can result in rushed recruitment decisions.
Trying to reduce Cost per Hire too aggressively can reduce the quality of candidate screening.
Trying to increase Acceptance Rate at any cost can result in excessive salaries or promises that the company cannot maintain.
Trying to increase Quality per Hire without fair and consistent measures can result in subjective or biased decisions.
The objective should always be: Better recruitment decisions.
The metrics simply help management understand whether the process is moving in the right direction.
What Does Good Recruiting Performance Look Like?
There is no single perfect target for every small business.
Recruitment results depend on factors such as:
industry;
occupation;
location;
required skills;
salary level;
seniority;
labour market conditions; and
availability of suitable candidates.
A specialised technical position may reasonably take longer and cost more to fill than an entry-level administrative position.
Therefore, instead of blindly copying another company's targets, begin by measuring your own performance.
Establish a baseline.
For example:
Current Time to Hire: 27 days
Current Cost per Hire: R7,500
Current Quality per Hire: 68%
Current Acceptance Rate: 72%
Then set realistic improvement targets.
Perhaps:
Time to Hire target: 22 days
Cost per Hire target: R6,500
Quality per Hire target: 75%
Acceptance Rate target: 80%
Measure again after several months.
This creates a continuous improvement process.
Turning Recruitment Data into Action
Collecting numbers is not enough. The purpose of measurement is to improve decisions.
A practical management cycle is:
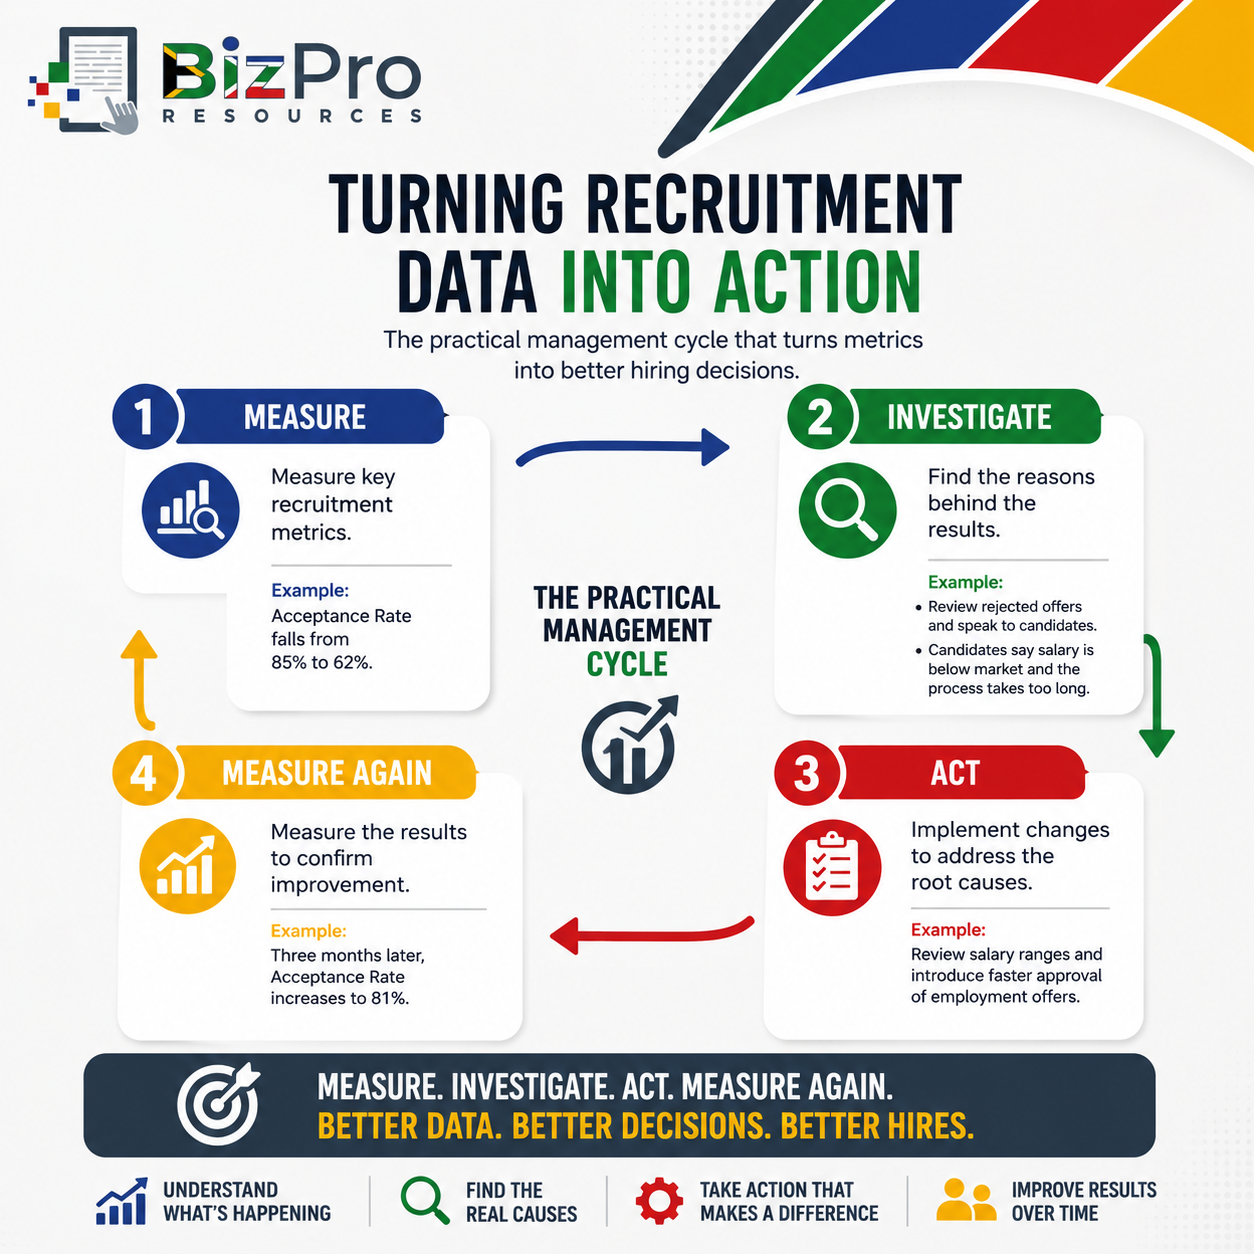
That is how metrics become management tools rather than simply numbers in a spreadsheet.
Questions to Ask Every Quarter
When reviewing recruiting and hiring metrics, management should ask:
Is our Time to Hire improving or getting worse?
Which positions take longest to fill?
Where are recruitment delays occurring?
How much are we actually spending per hire?
Which recruitment sources produce the best employees?
Are expensive recruitment channels producing better results?
Are our new employees performing well?
Are new employees remaining with the company?
Are good candidates accepting our offers?
Why are candidates rejecting offers?
Are our salaries and employment conditions reasonably competitive?
Are we rushing recruitment simply to fill vacancies?
Are managers applying the recruitment process consistently?
What should we change before the next recruitment cycle?
These questions turn HR information into practical management decisions.
Final Thoughts
Recruitment should not be judged simply by whether a vacancy was filled.
A successful recruitment process should help the company find suitable employees within a reasonable period, at a reasonable cost, while producing people who perform well and want to join the organisation.
The four metrics in this article provide a practical starting point.
Time to Hire measures recruitment speed.
Cost per Hire measures recruitment cost.
Quality per Hire measures whether recruitment produces successful employees.
Acceptance Rate measures whether selected candidates are willing to accept the company's employment offers.
No single metric tells the complete story:
A very fast recruitment process can still produce poor employees.
A cheap recruitment process can become expensive if employees leave.
A high Acceptance Rate means little if employee performance is poor.
A strong Quality per Hire result may still hide an unnecessarily slow and expensive recruitment process.
The greatest value comes from measuring all four metrics together and looking for patterns over time.
For a small business, the objective is not to build a complicated HR analytics department:
Start with a spreadsheet.
Record the numbers.
Compare them every month or quarter.
Investigate unusual results.
Make practical improvements.
Then measure again.
That simple discipline can gradually transform recruitment from a largely instinctive activity into a measurable business process that helps the company attract better people, control costs, and build a stronger workforce.
Related Articles in the HR Performance Metrics Series
Rentention and Workforce Health Metrics
Productivity and Value Metrics
Disciplinary Procedure Metrics
AI Disclaimer
AI Tools were used to assist with research. Remember to always cross-check everything that you read.


