
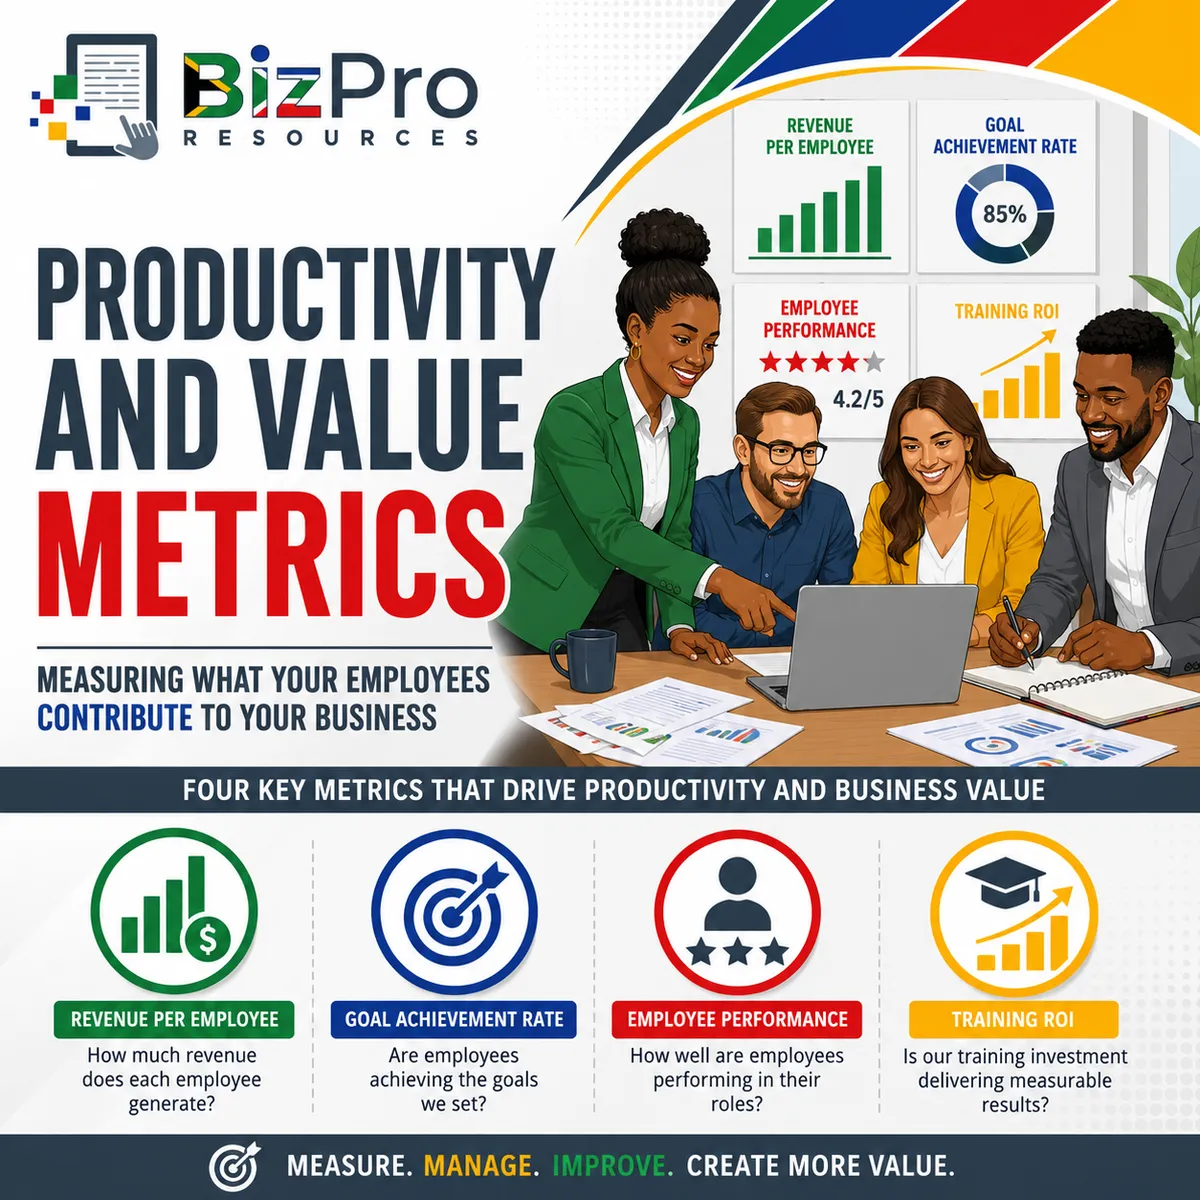
Productivity and Value Metrics: Measuring What Your Employees Contribute to the Business
Article #3 of #4 in the HR Performance Metrics Series
Introduction
Employees are one of the most important resources in a small business.
They serve customers, produce goods, complete projects, make sales, manage administration, operate equipment, solve problems, and help the business generate revenue.
They are also one of the largest costs for many businesses.
Salaries and wages may be accompanied by:
overtime;
bonuses and incentives;
employer contributions;
training;
uniforms and PPE;
equipment;
vehicles;
technology;
supervision; and
other employee-related costs.
For this reason, business owners need to understand more than simply how many people they employ. They also need to understand the value and productivity those employees help create.
A manager may say:
"We are busier than ever, but profits are not improving."
"We have hired more people, but revenue has hardly changed."
"Some employees achieve their targets and others don't."
"Our performance reviews are too subjective."
"We spend a lot on training, but I don't know whether it makes a difference."
These are measurement problems.
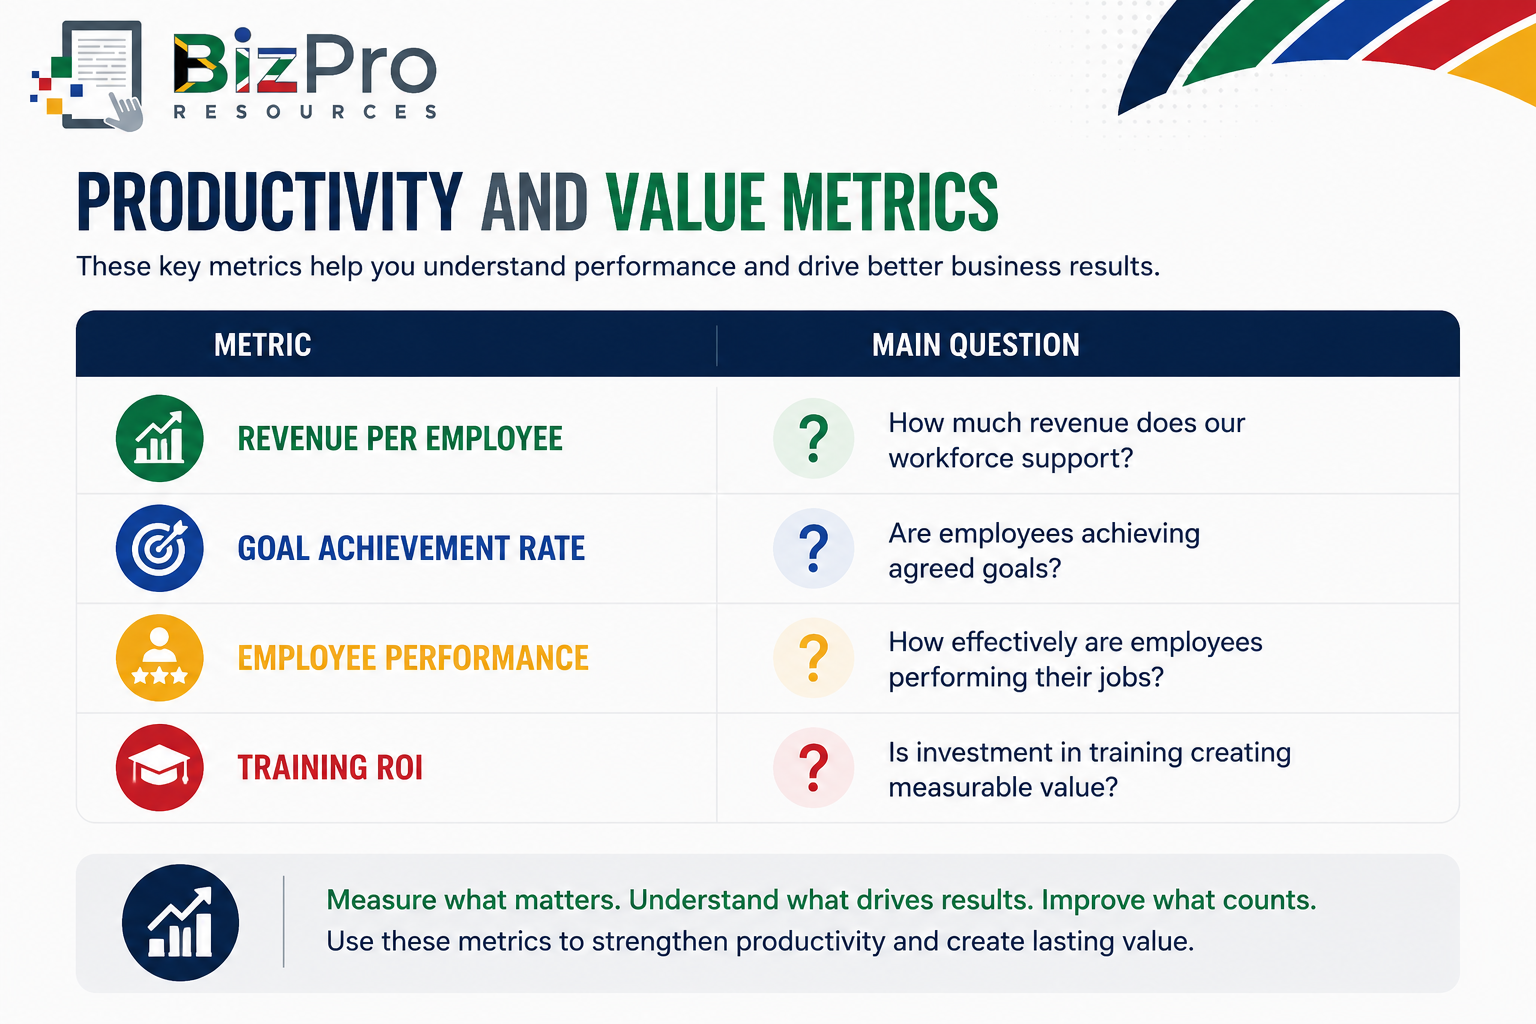
Four useful Human Resource metrics can help:
Revenue per Employee
Goal Achievement Rate
Employee Performance
Training ROI
Together, these metrics help management answer four important questions:
How much revenue does our workforce support?
Are employees achieving the goals we set?
How well are employees performing?
Is employee training creating enough value to justify its cost?
The objective is not to reduce employees to numbers.
The objective is to use better information to make better decisions about productivity, performance, staffing, development, and investment in people.
Why Productivity and Value Metrics Matter
Imagine a small business grows from 20 employees to 30 employees. That sounds positive.
The owner may believe: "We are growing. We have ten more employees." But employee numbers alone do not tell us whether the business has become stronger.
Suppose annual revenue before the expansion was: R12 million.
With 20 employees: R12,000,000 ÷ 20 = R600,000 revenue per employee
After expanding to 30 employees, annual revenue increases to: R13.5 million. Revenue has increased by R1.5 million.
But Revenue per Employee is now: R13,500,000 ÷ 30 = R450,000.
The workforce increased by 50%.
Revenue increased by only 12.5%.
That does not automatically mean the expansion was a mistake. New employees may need time to become productive, or the business may be investing ahead of future growth.
But the change deserves investigation.
Without measurement, management may simply see: More employees + more revenue = growth
With measurement, management asks a better question: Are we getting enough additional value from the additional workforce capacity?
That is the purpose of productivity and value metrics.
1. Revenue per Employee
What Is Revenue per Employee?
Revenue per Employee measures how much business revenue is generated, on average, for each employee.
It is a high-level workforce productivity metric.
The metric does not mean that every employee personally generates that amount of revenue.
Consider an accounting firm.
Accountants may perform work that is directly billed to clients.
But the business also needs:
reception;
administration;
payroll;
IT support;
management; and
finance.
These employees may not directly invoice customers, but their work enables revenue-generating employees to perform effectively.
Revenue per Employee therefore looks at the workforce as a whole.
How Is Revenue per Employee Calculated?
The basic formula is: Revenue per Employee = Total Revenue ÷ Average Number of Employees
Suppose a business generates annual revenue of: R10,000,000
Its average workforce during the year is: 20 employees
Revenue per Employee: R10,000,000 ÷ 20 = R500,000
The business therefore generates: R500,000 of annual revenue per employee
If employee numbers change significantly during the year, using the average number of employees is more useful than simply using the year-end number.
For example:
Employees at beginning of year: 18
Employees at end of year: 22
Average employees: (18 + 22) ÷ 2 = 20
Example of Poor Revenue per Employee Performance
Consider a small security systems installation company.
Last year:
Revenue: R15 million
Average employees: 25
Revenue per Employee: R15,000,000 ÷ 25 = R600,000
This year, the company expands:
Revenue: R16 million
Average employees: 32
Revenue per Employee: R16,000,000 ÷ 32 = R500,000
Revenue increased.
But Revenue per Employee decreased from: R600,000 to R500,000
That is a decrease of: 16.7%
What Does This Mean for the Company?
The lower result could indicate:
overstaffing;
poor workforce utilisation;
inefficient processes;
weak sales growth;
employees taking too long to become productive;
duplicated roles;
excessive administration;
poor scheduling;
insufficient work for the available workforce; or
technology and equipment limitations.
However, management should not immediately conclude that employees need to be reduced:
Perhaps the company hired technicians in preparation for a major new contract.
Perhaps new employees are still being trained.
Perhaps the company is building capacity for future growth.
The metric identifies a question. It does not automatically provide the answer.
Example of Good Revenue per Employee Performance
The company improves scheduling, sales activity, project planning, and technician utilisation.
The following year:
Revenue: R21 million
Average employees: 33
Revenue per Employee: R21,000,000 ÷ 33 = approximately R636,364
The result has increased from R500,000 to approximately R636,000.
What Does This Mean for the Company?
The improvement may indicate:
better employee utilisation;
stronger sales;
improved processes;
higher employee productivity;
more efficient project management;
improved technology;
better scheduling; or
stronger workforce capability.
The business is generating more revenue without increasing employee numbers at the same rate.
That can support improved profitability.
2. Goal Achievement Rate
What Is Goal Achievement Rate?
Goal Achievement Rate measures the percentage of defined goals or targets that employees successfully achieve.
Goals can vary significantly between jobs.
A salesperson may have goals relating to:
sales revenue;
new customers;
customer retention; or
gross profit.
A technician may have goals relating to:
completed jobs;
response times;
quality;
first-time fix rates; or
customer satisfaction.
An administrator may have goals relating to:
processing times;
accuracy;
outstanding documents; or
deadlines.
The important point is that goals should be clear and measurable.
An employee cannot reasonably be measured against a target they do not understand.
How Is Goal Achievement Rate Calculated?
A simple formula is: Goal Achievement Rate = Number of Goals Achieved ÷ Total Number of Goals Set × 100
Suppose an employee has eight agreed goals for a quarter.
The employee achieves six:
Goal Achievement Rate = 6 ÷ 8 × 100
Goal Achievement Rate = 75%
You can calculate the rate for:
an individual employee;
a team;
a department; or
the entire company.
Example of Poor Goal Achievement Rate
A small sales business has five sales representatives. Each salesperson has four important quarterly goals.
Total goals: 5 × 4 = 20 goals
At the end of the quarter, only nine goals were achieved:
Goal Achievement Rate = 9 ÷ 20 × 100
Goal Achievement Rate = 45%
What Does This Mean for the Company?
A 45% Goal Achievement Rate indicates that more than half of the agreed goals were not achieved.
Possible reasons include:
unrealistic targets;
poor employee performance;
inadequate training;
weak management;
unclear goals;
insufficient resources;
poor market conditions;
inadequate sales leads;
poor planning; or
goals that employees cannot reasonably influence.
Management should investigate before deciding what action to take. If every salesperson misses the same target, the problem may not be five individual employees.
The target itself may be unrealistic.
Example of Good Goal Achievement Rate
Management reviews its target-setting process:
Goals are made clearer.
Salespeople receive better information about their targets.
Sales leads are allocated more consistently.
Managers hold regular performance discussions rather than waiting until the end of the quarter.
During the next quarter:
Total goals: 20
Goals achieved: 17
Goal Achievement Rate: 17 ÷ 20 × 100 = 85%
What Does This Mean for the Company?
An 85% Goal Achievement Rate may indicate:
realistic targets;
stronger employee performance;
better communication;
improved management;
better resources;
clearer priorities; and
stronger alignment between employees and business objectives.
Management should also investigate the three goals that were missed.
A strong overall result does not mean there is nothing left to improve.
3. Employee Performance
What Is Employee Performance?
Employee Performance measures how effectively an employee performs the responsibilities and expected outcomes of their job.
This is broader than Goal Achievement Rate.
An employee may achieve a numerical target while performing poorly in other important areas.
For example, a salesperson might exceed their sales target but:
create customer complaints;
offer excessive discounts;
fail to complete administration;
ignore company procedures; or
damage relationships with colleagues.
Similarly, an employee may narrowly miss a numerical goal while demonstrating excellent:
quality;
teamwork;
customer service;
reliability; and
problem-solving.
A good Employee Performance measure therefore considers several aspects of the job.
How Is Employee Performance Calculated?
There is no single universal formula.
A small business can create a simple weighted performance score.
For example:
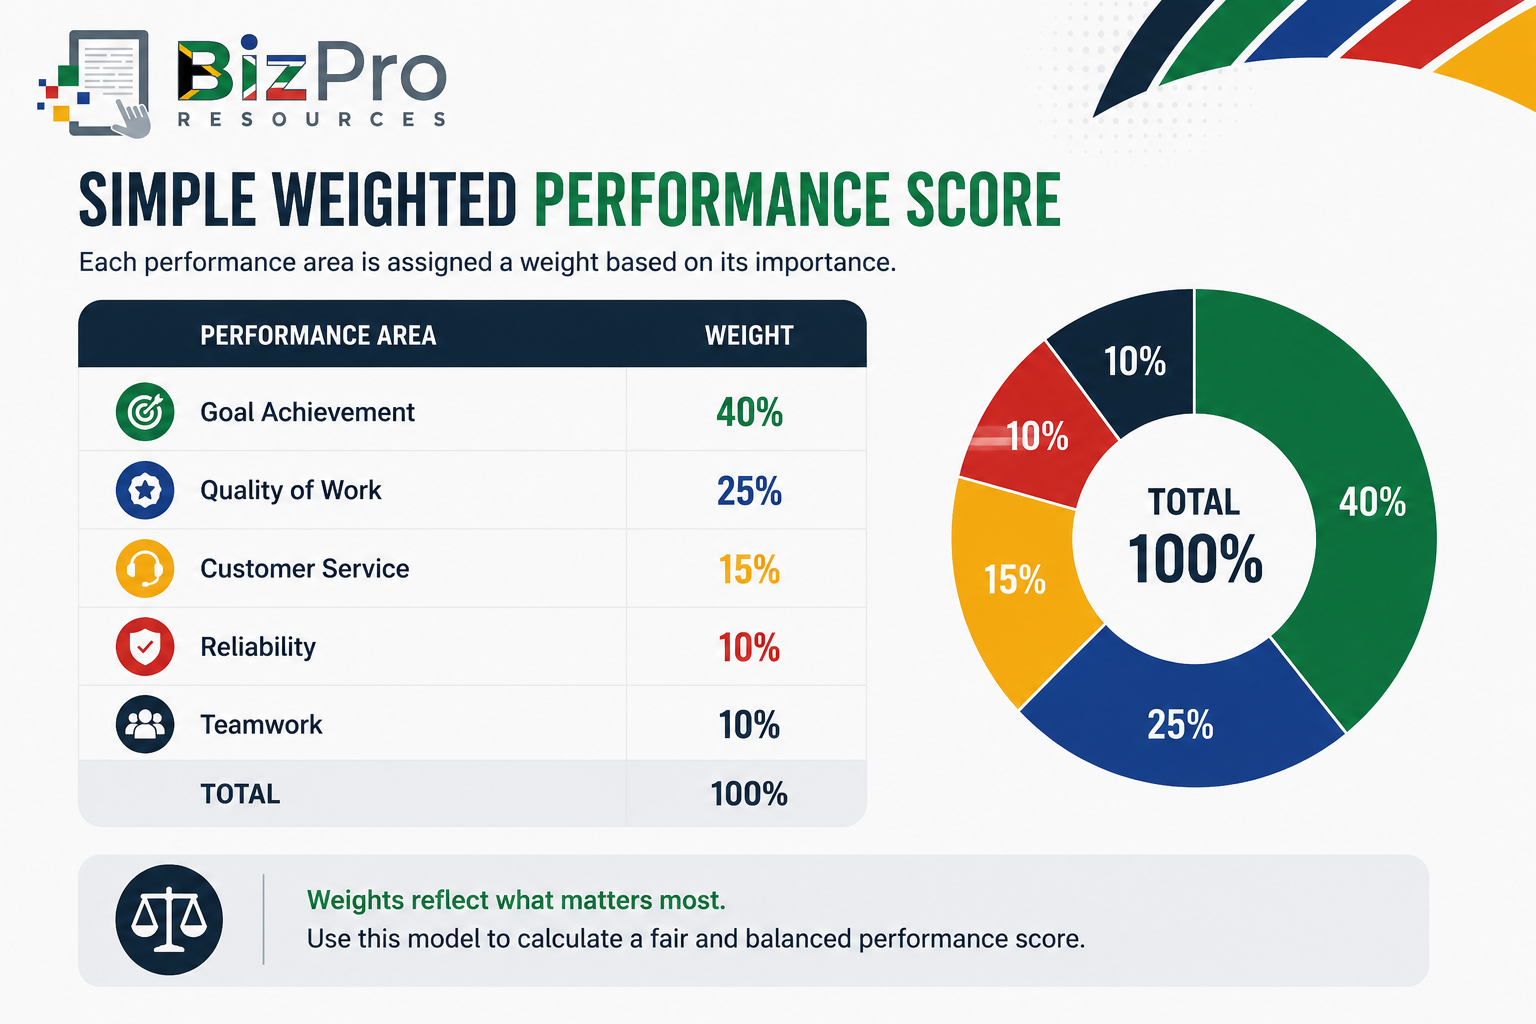
Suppose an employee receives:
Goal Achievement: 80%
Quality: 90%
Customer Service: 85%
Reliability: 95%
Teamwork: 80%
The weighted calculation is: (80 × 40%) + (90 × 25%) + (85 × 15%) + (95 × 10%) + (80 × 10%)
This gives: 32 + 22.5 + 12.75 + 9.5 + 8 = 84.75%
Employee Performance Score: 84.75%
The exact performance areas and weightings should reflect the actual job.
Example of Poor Employee Performance
Imagine an automotive repair business evaluates a technician.
The technician receives the following scores:
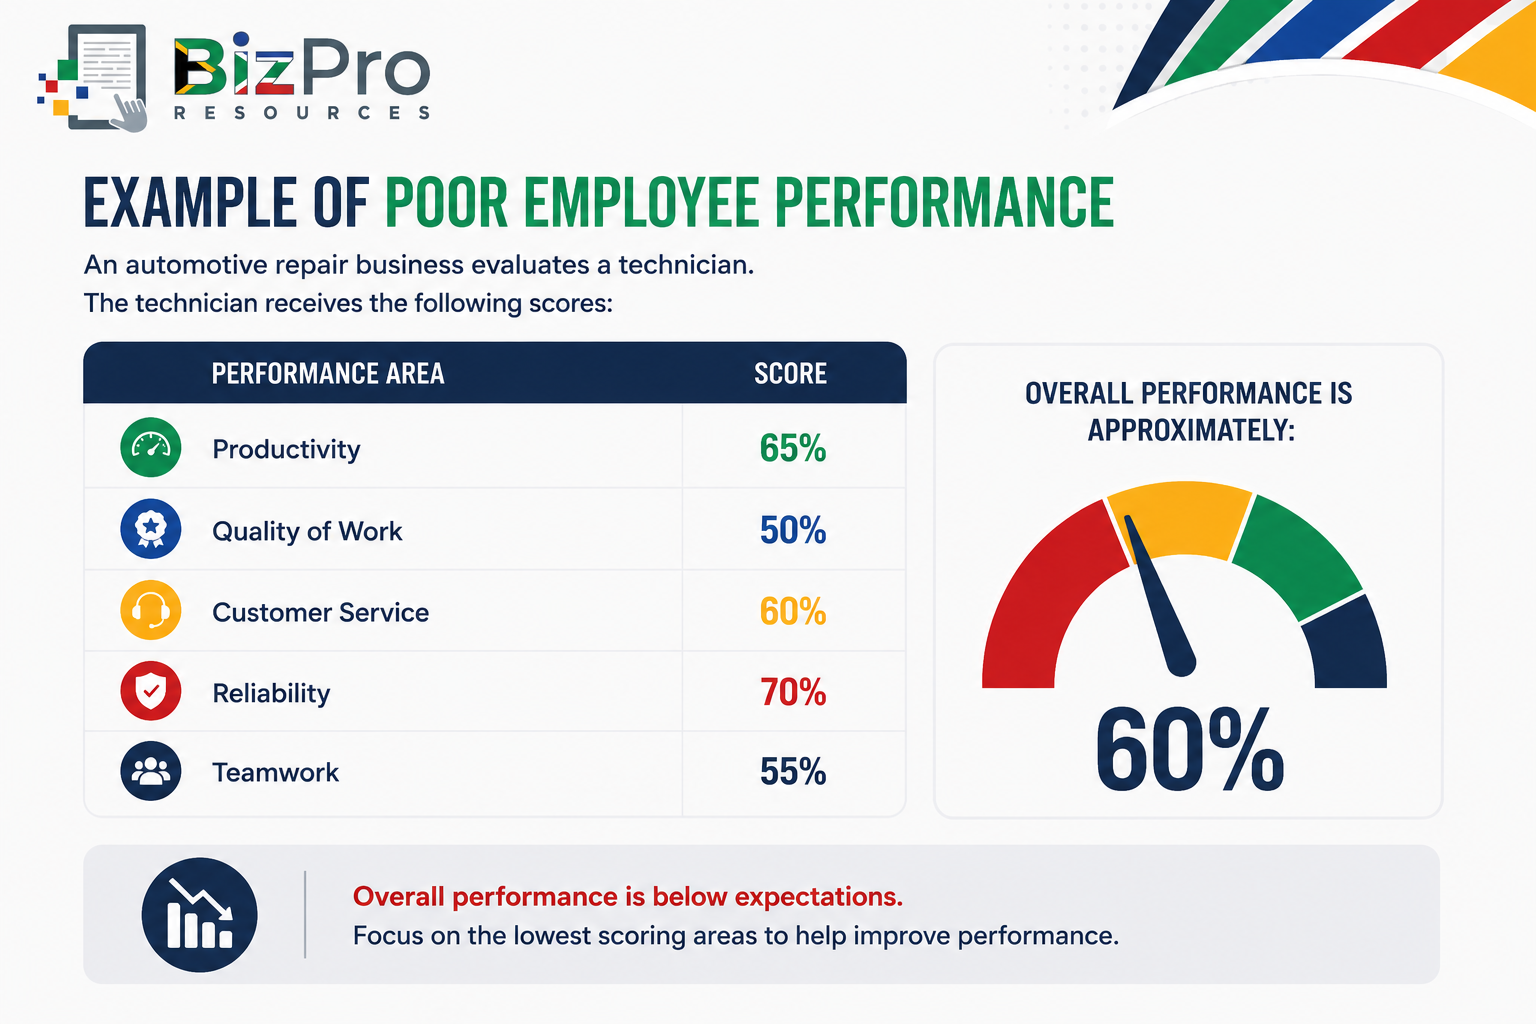
Overall performance is approximately: 60%
Management investigates.
It discovers:
repeated rework;
missed deadlines;
incomplete job cards;
customer complaints; and
poor communication with colleagues.
What Does This Mean for the Company?
Poor employee performance can affect:
productivity;
customer satisfaction;
profitability;
quality;
employee morale;
management time;
safety; and
the performance of other employees.
But a performance score should trigger proper management action, not an automatic assumption that the employee is simply "bad".
Management should ask:
Does the employee understand the job?
Were expectations clearly communicated?
Has appropriate training been provided?
Does the employee have the correct tools?
Is the workload reasonable?
Is supervision adequate?
Are there process problems?
Has performance feedback been provided?
The cause matters.
Example of Good Employee Performance
After receiving clear feedback, additional training, and regular supervisor support, the technician improves.
Three months later:
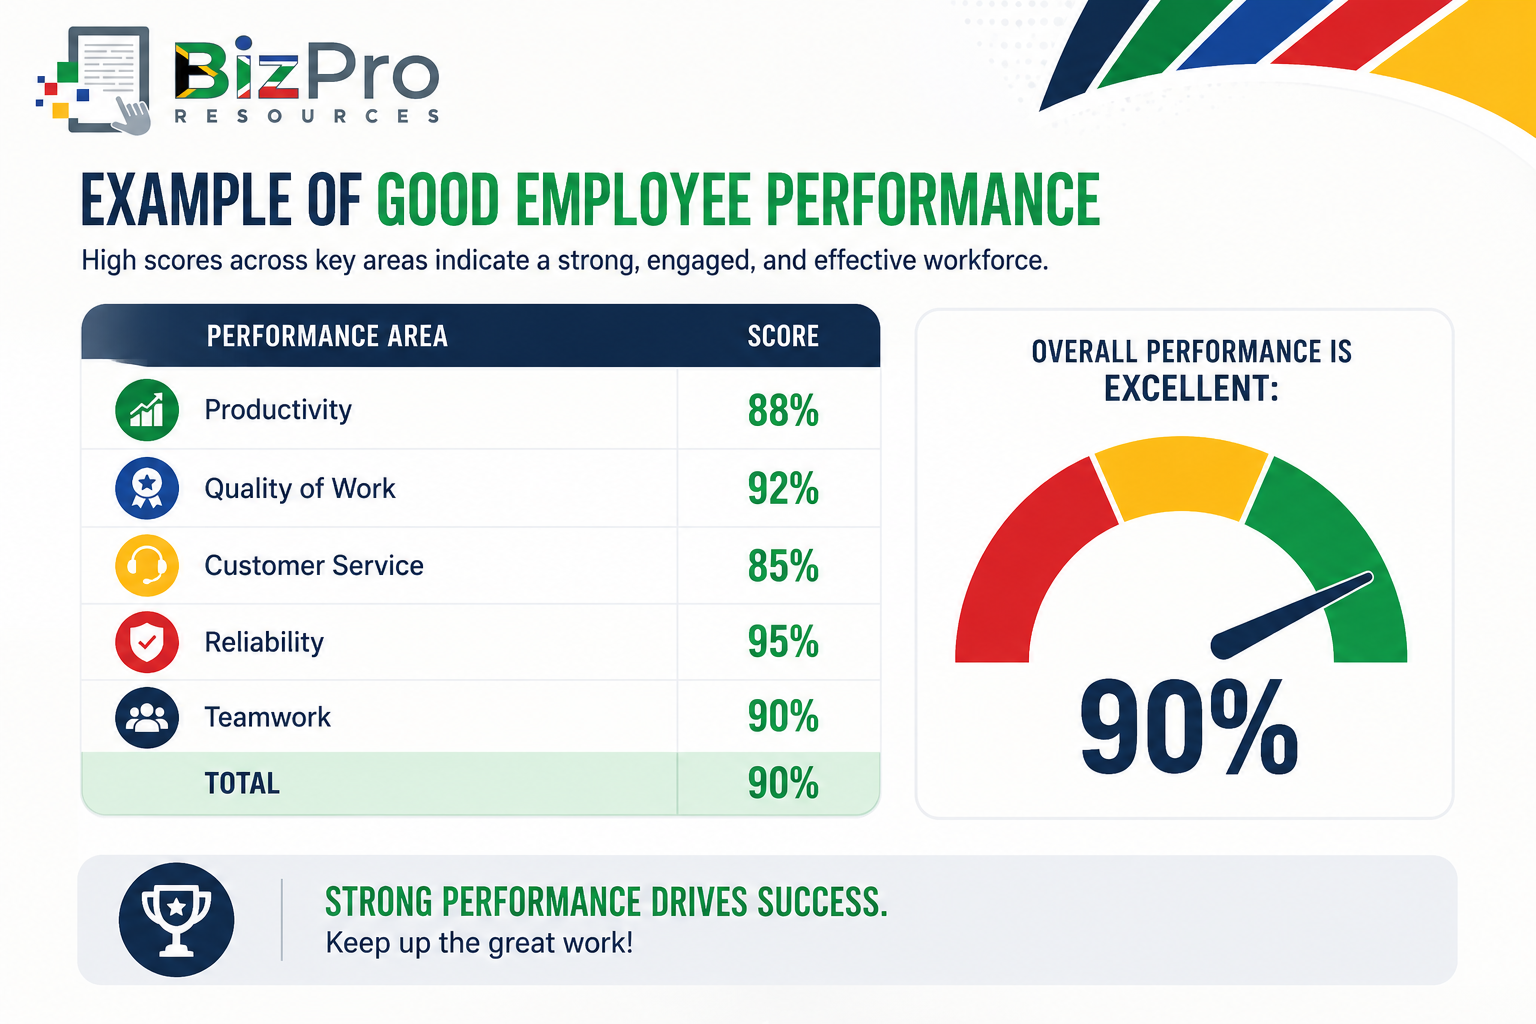
Overall performance is now approximately: 90%
What Does This Mean for the Company?
The improvement may lead to:
fewer mistakes;
less rework;
faster job completion;
improved customer satisfaction;
stronger teamwork;
less supervision; and
higher productivity.
It also demonstrates why performance measurement should be used to manage and improve performance, not simply to create a score.
4. Training ROI
What Is Training ROI?
Businesses spend money training employees for many reasons.
Training may involve:
technical skills;
sales;
customer service;
software;
management;
health and safety;
compliance;
equipment operation; or
professional development.
But training has a cost.
The business may pay for:
course fees;
trainers;
training materials;
travel;
accommodation;
employee working time;
temporary replacement staff; and
lost productive time while employees attend training.
Training ROI, or Training Return on Investment, attempts to compare the financial benefit created by training with the cost of providing that training.
How Is Training ROI Calculated?
A practical formula is: Training ROI = (Financial Benefit from Training − Training Cost) ÷ Training Cost × 100
Suppose training costs: R20,000
After the training, management estimates measurable annual benefits of: R35,000
Net benefit: R35,000 − R20,000 = R15,000
Training ROI: R15,000 ÷ R20,000 × 100 = 75%
The Training ROI is: 75%
This means the measurable net benefit was equal to 75% of the training investment.
Measuring the Benefit of Training
This is often the difficult part.
The financial benefit might come from:
increased sales;
improved productivity;
reduced waste;
fewer mistakes;
reduced rework;
fewer customer complaints;
lower equipment damage;
reduced overtime;
faster processing;
lower employee turnover; or
improved efficiency.
Where possible, compare performance before and after training.
For example:
Before training: Monthly rework cost = R12,000
After training: Monthly rework cost = R7,000
Monthly saving: R5,000
Annual saving: R5,000 × 12 = R60,000
This gives management a measurable financial benefit that can be compared with the training cost.
Example of Poor Training ROI
A small company sends ten employees on customer service training.
Total cost: R50,000. Management expects customer complaints to decrease and customer retention to improve.
Six months later, the measurable benefit is estimated at only: R30,000
Training ROI: (R30,000 − R50,000) ÷ R50,000 × 100 = -40%
What Does This Mean for the Company?
A negative Training ROI means the measurable financial benefits have not yet recovered the training investment.
Possible reasons include:
the wrong training was selected;
employees already knew the material;
training was too theoretical;
employees could not apply what they learned;
managers did not reinforce the training;
the training provider was ineffective;
the wrong employees attended; or
insufficient time has passed for the benefits to appear.
A negative result does not automatically mean training was worthless.
Some benefits are difficult to convert directly into money.
For example:
improved safety awareness;
stronger management capability;
better employee confidence;
improved compliance; and
reduced future risk.
Training ROI should therefore be used sensibly.
Example of Good Training ROI
A plumbing business provides technical training to eight employees.
Training cost: R40,000. Before training, the company experiences high levels of rework and repeat customer visits.
During the following year, reduced rework and improved productivity create estimated measurable savings of: R100,000
Training ROI: (R100,000 − R40,000) ÷ R40,000 × 100 = 150%
Training ROI: 150%
What Does This Mean for the Company?
The training produced measurable financial benefits significantly greater than its cost.
The company may decide to:
repeat the programme;
provide similar training to other employees;
include the training in onboarding;
use the same provider again; or
investigate other areas where training could improve performance.
Training has moved from being viewed simply as an expense to being evaluated as an investment.
How the Four Productivity and Value Metrics Work Together
These four metrics measure different parts of workforce productivity.
The greatest value comes from considering them together.
For example:
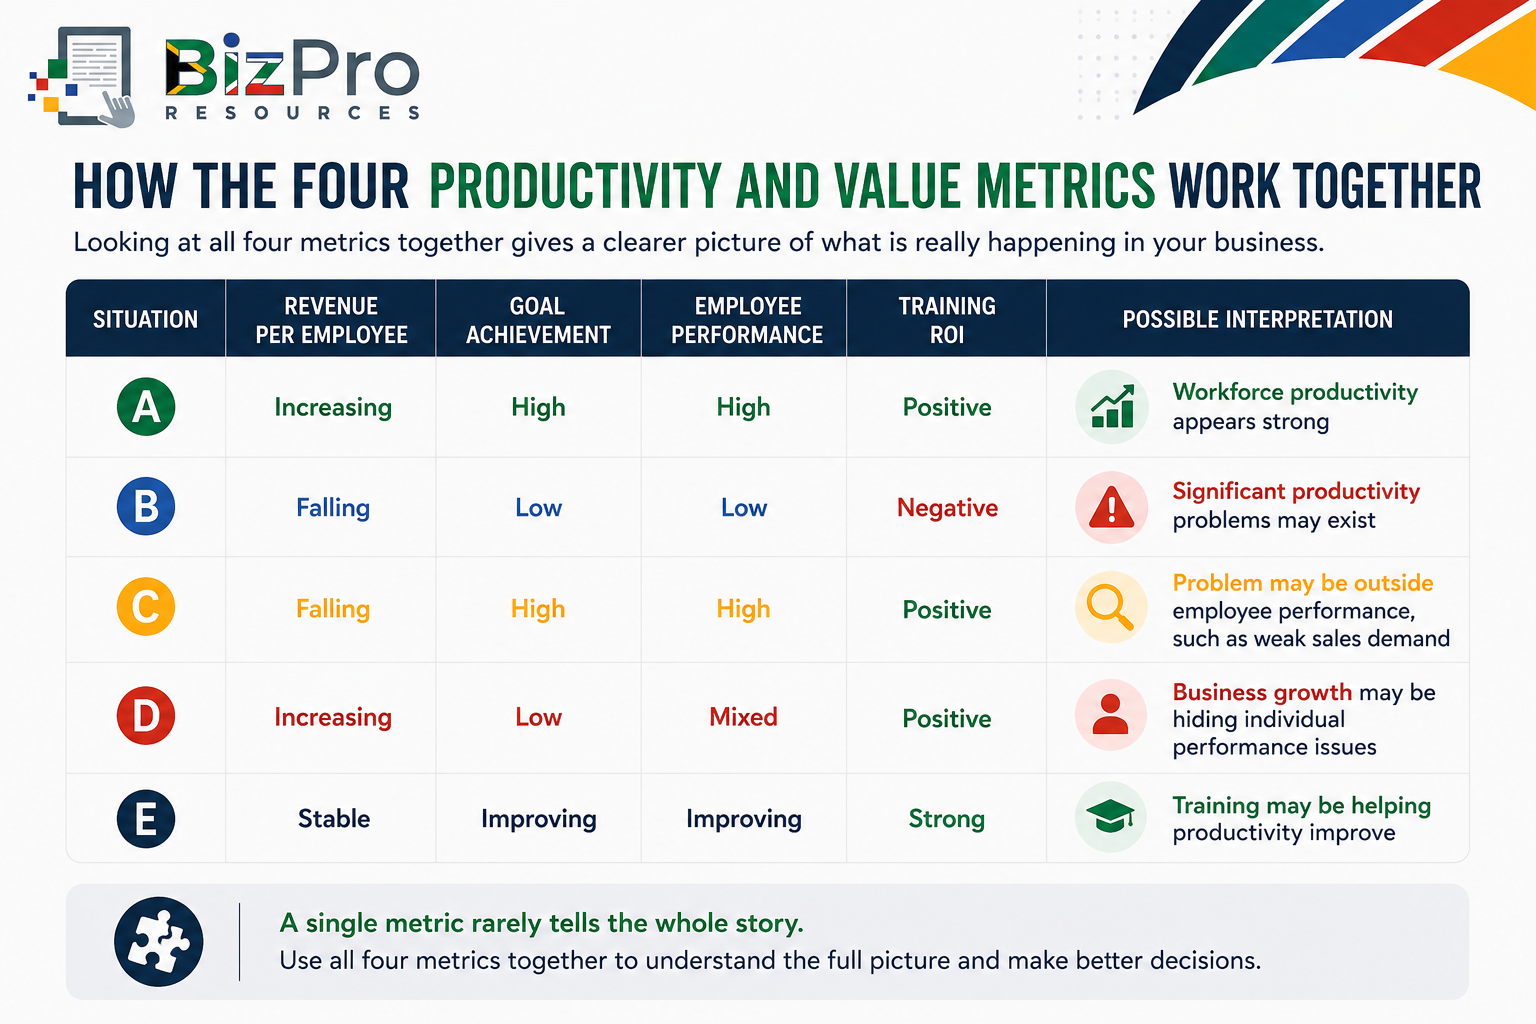
A single metric rarely tells the whole story.
Revenue per Employee Is Not the Same as Profit per Employee
This distinction is important. A business may generate high revenue per employee while producing poor profit.
For example:
Company A: Revenue per Employee = R800,000
Company B: Revenue per Employee = R600,000
At first, Company A appears more productive.
But suppose Company A has very high operating costs and low margins.
Company B may actually produce more profit per employee.
Revenue per Employee is therefore useful, but it should be considered alongside financial metrics such as:
Gross Profit Margin;
Net Profit Margin;
operating costs; and
labour costs.
Remember: Revenue is not profit.
Be Careful When Comparing Employees
Employee productivity measures should be appropriate to the job.
It makes little sense to compare a receptionist's Revenue per Employee with a salesperson's sales revenue.
Their jobs create value differently.
Similarly, comparing two technicians only by the number of jobs completed can create the wrong behaviour:
Technician A completes: 50 jobs
Technician B completes: 42 jobs
Technician A appears more productive.
But suppose Technician A has:
eight repeat visits;
five customer complaints; and
significant rework.
Technician B has:
one repeat visit;
no complaints; and
very little rework.
Quantity alone does not equal good performance.
Good measurement should balance: Quantity + Quality + Cost + Customer Impact where appropriate.
Avoid Creating the Wrong Behaviour
Poorly designed performance metrics can encourage employees to improve the number while damaging the business.
For example:
If a call centre measures employees only on the number of calls handled, employees may rush customers off the telephone.
If technicians are measured only on jobs completed, they may sacrifice quality.
If salespeople are measured only on revenue, they may offer excessive discounts.
If employees are measured only on attendance, they may come to work when they should genuinely be absent.
This is sometimes called gaming the metric.
The employee improves the measured number without necessarily improving the underlying business result.
Good performance measurement therefore uses a balanced set of indicators.
Build a Simple Productivity and Value Dashboard
A small business can begin with a spreadsheet.
A quarterly dashboard might look like this:
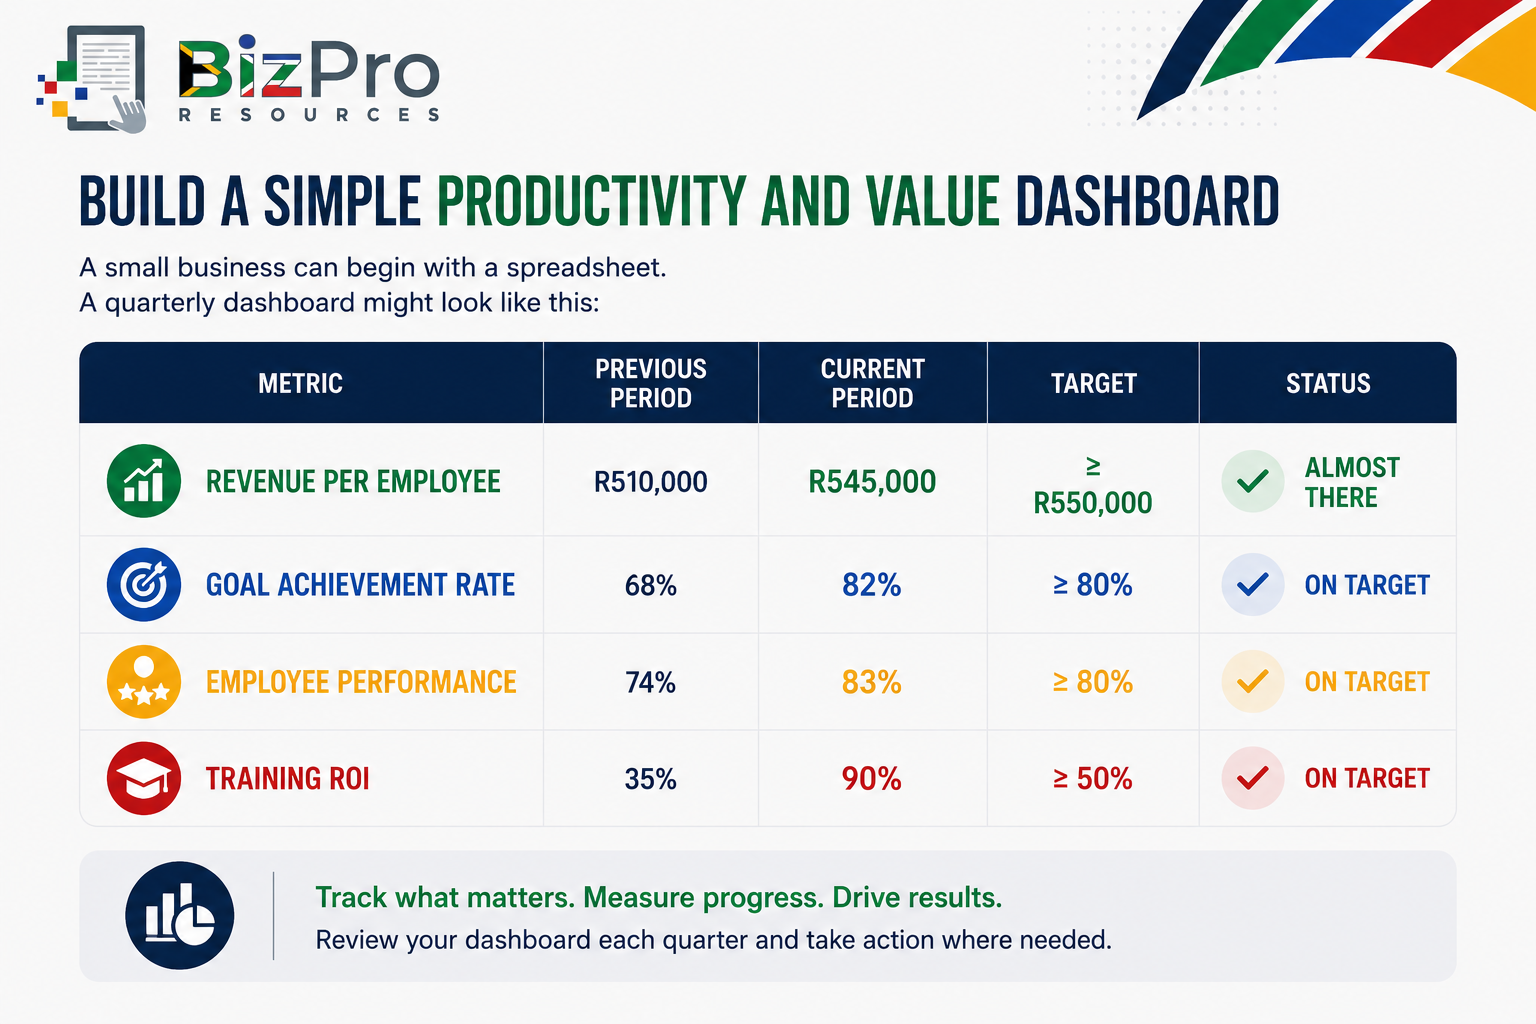
Management can immediately see that:
goal achievement has improved;
employee performance has improved;
training is generating a stronger return; and
Revenue per Employee is improving but remains slightly below target.
This provides a much more useful discussion than: "Everyone seems busy."
Being busy is not the same as being productive.
Segment Your Productivity Data
Company-wide averages can hide important differences.
Consider Revenue per Employee by branch:
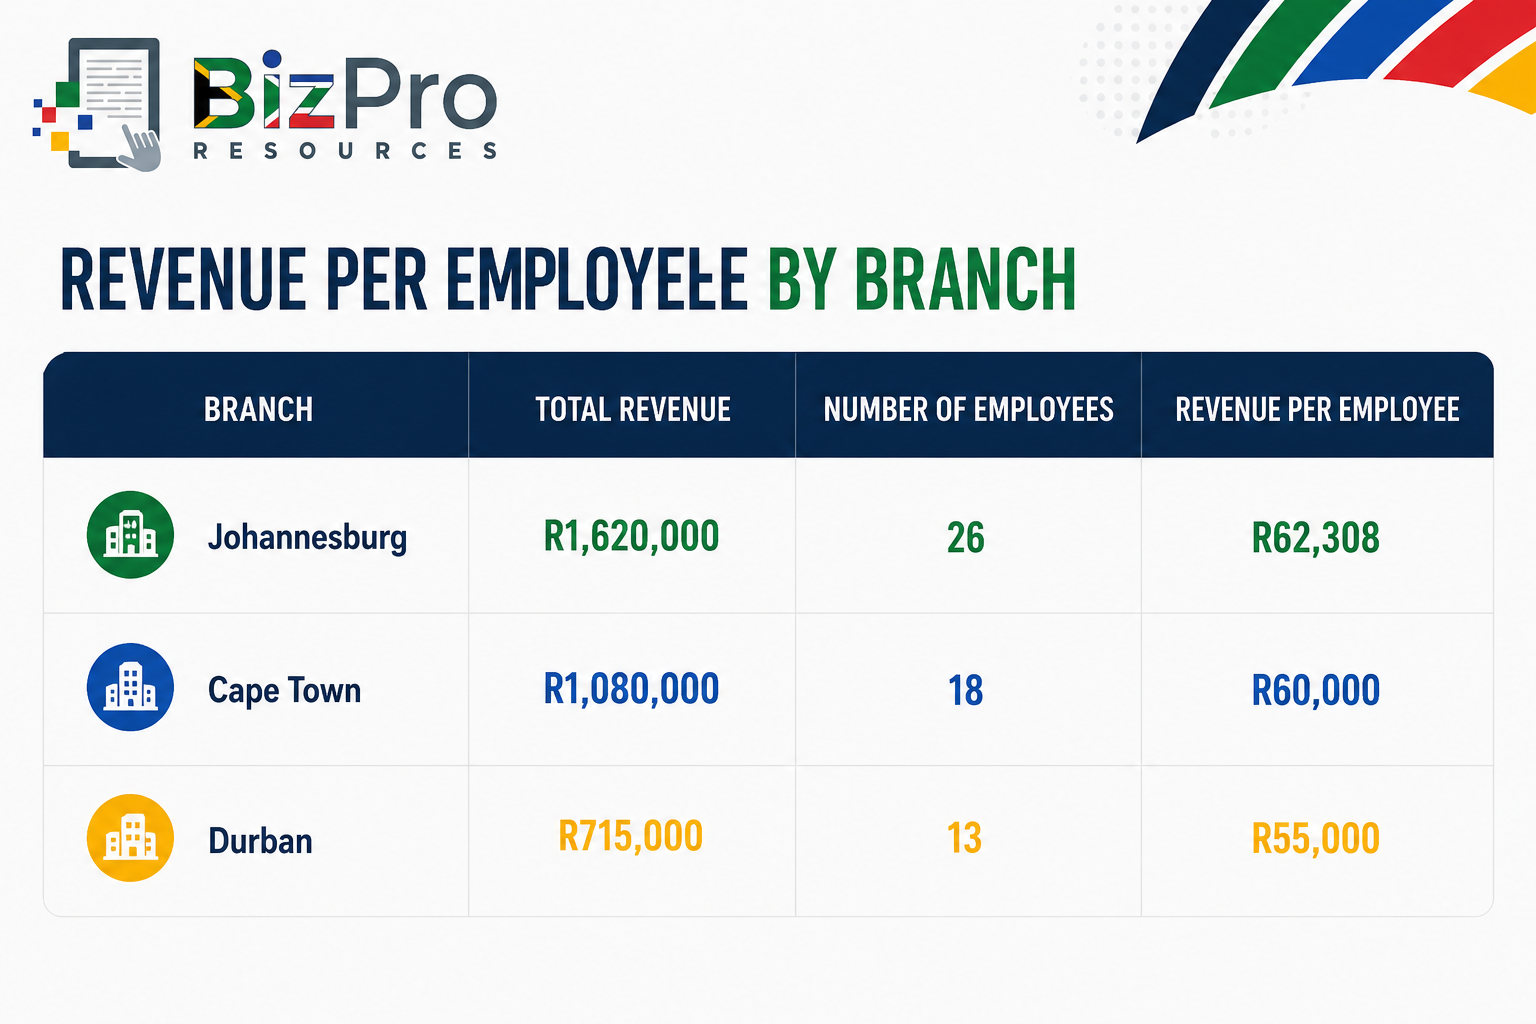
The overall business may appear reasonably productive.
But Durban is generating substantially less revenue per employee.
Management can investigate whether the difference relates to:
market size;
sales;
staffing levels;
customer demand;
management;
employee productivity;
pricing;
capacity utilisation; or
local operating conditions.
The purpose is not automatically to criticise the lowest-performing branch.
The purpose is to understand the difference.
Measure Trends, Not Just Single Numbers
A single measurement provides limited information. Trends are more useful.
Suppose Revenue per Employee is:
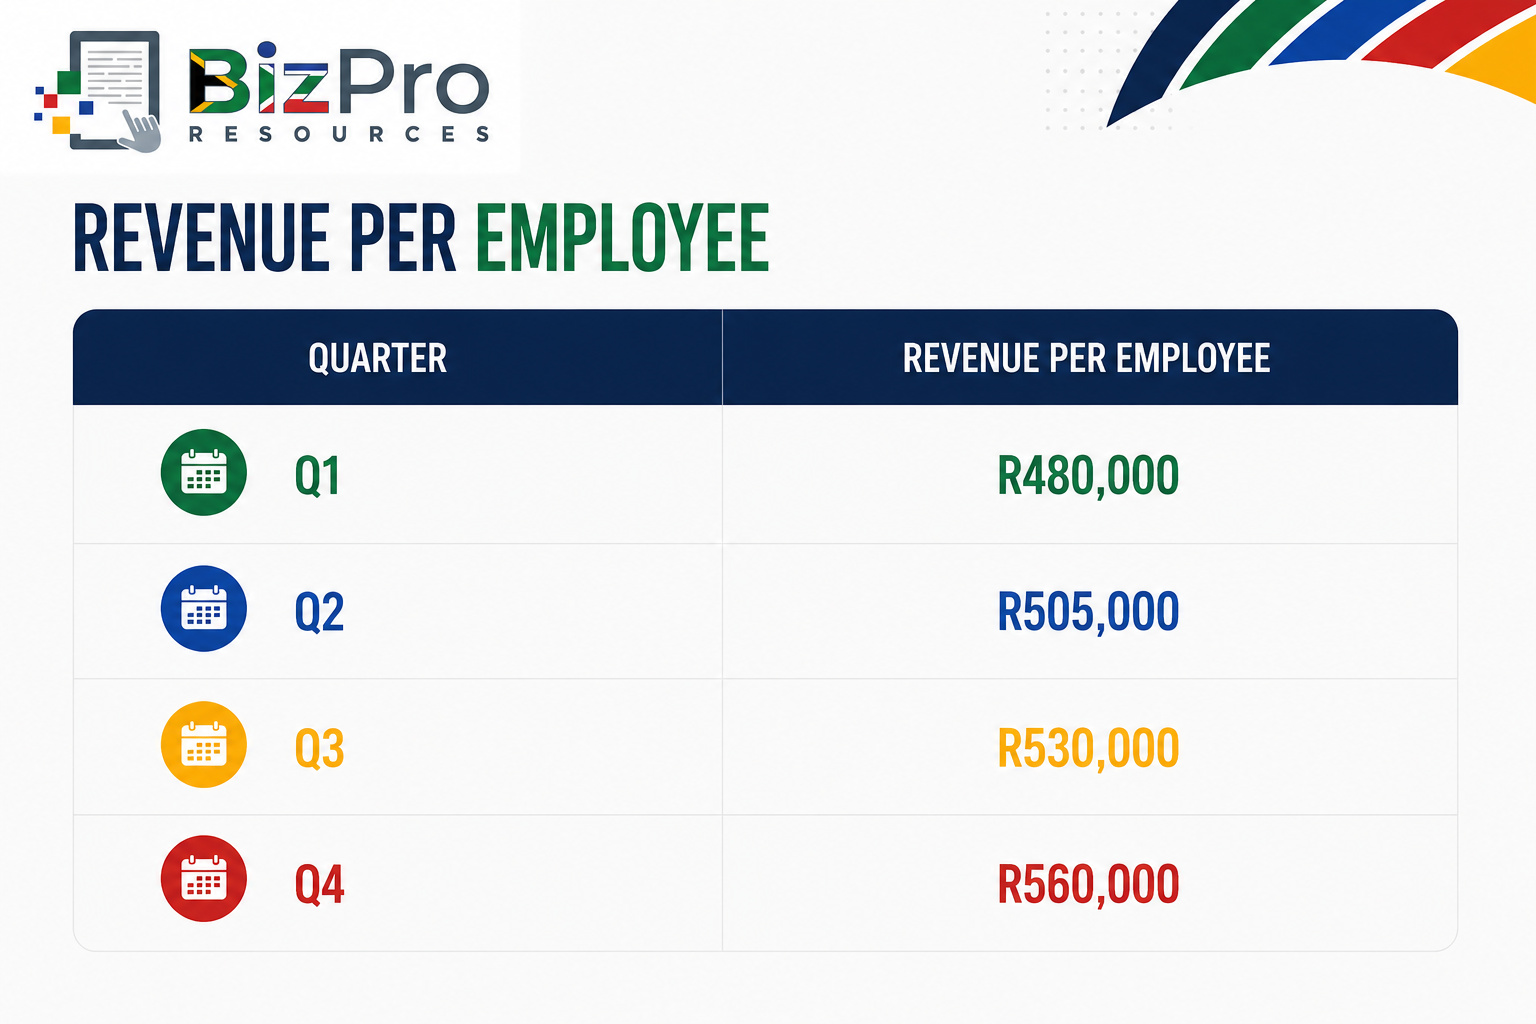
The direction is positive.
Now suppose Goal Achievement Rate moves as follows:
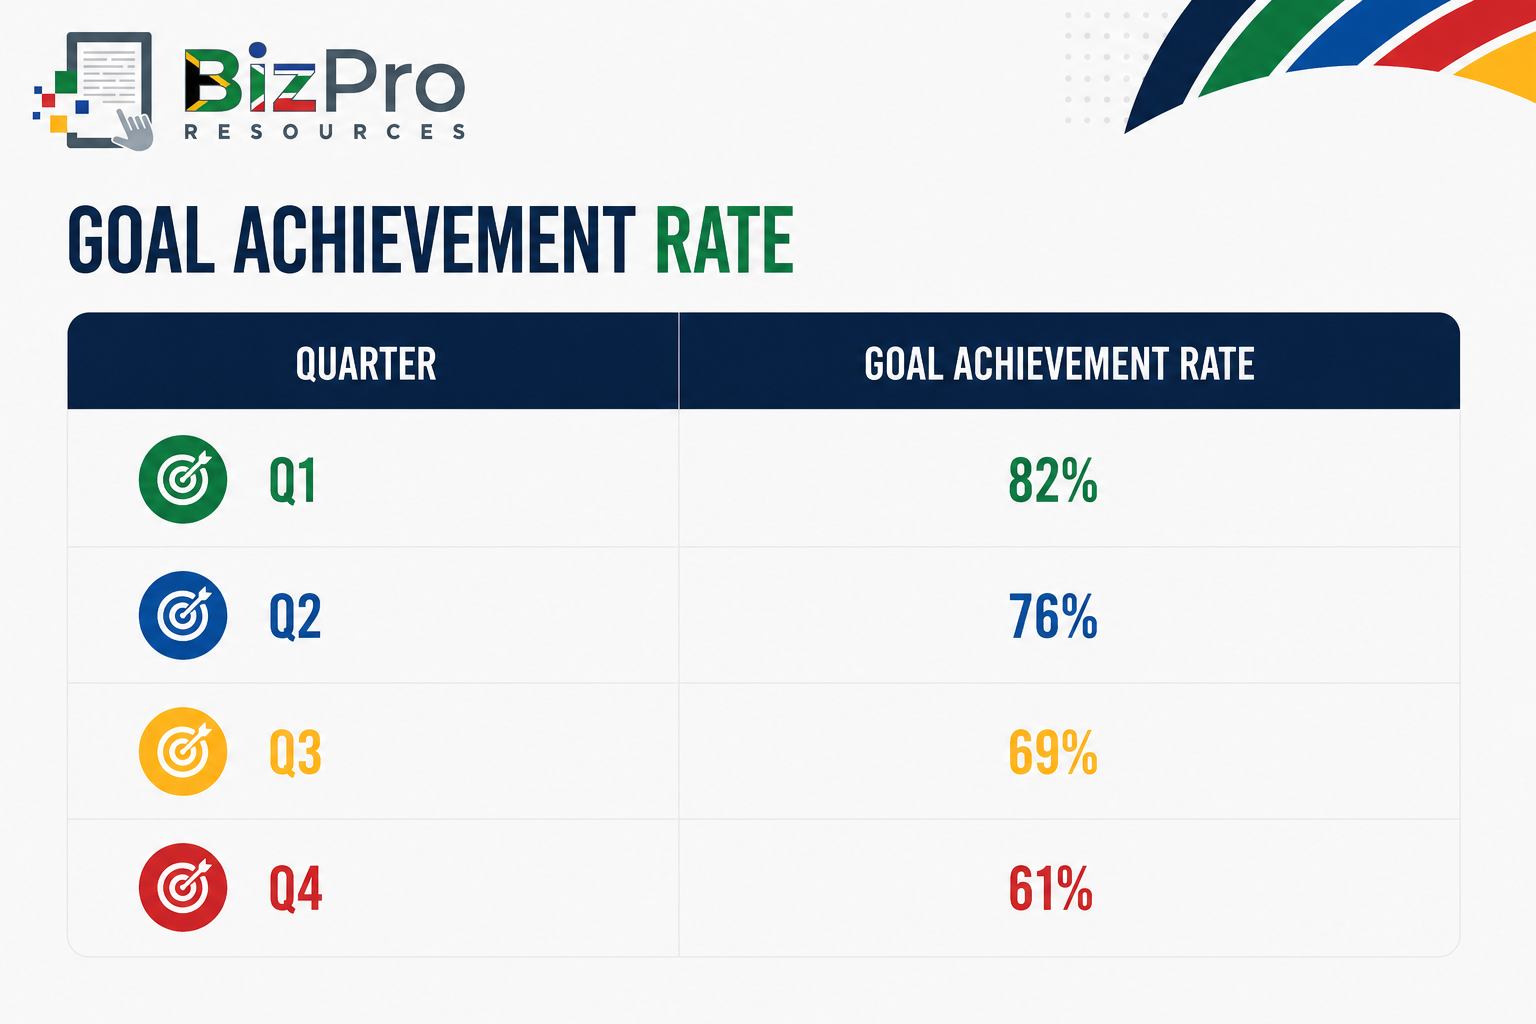
That trend deserves attention.
Even if 61% does not immediately create a crisis, performance is moving consistently in the wrong direction.
Trends often provide warning signs before a problem becomes serious.
Connect Training to Performance
Training should not happen in isolation.
A useful approach is: Identify Performance Gap → Provide Appropriate Training → Measure Performance Again
For example:
Technician first-time fix rate:
Before Training: 70%
Training is provided.
Three months later:
After Training: 86%
At the same time:
Customer complaints decrease.
Rework decreases.
Productivity improves.
The business can now see a stronger connection between training and operational performance.
Without before-and-after measurement, management may simply know that employees attended training.
Attendance is not the same as improvement.
What Does Good Productivity Performance Look Like?
There is no single perfect number for every company.
Revenue per Employee varies significantly between industries.
A law firm, security company, plumbing contractor, retailer, accounting firm, medical practice, and manufacturing business will naturally produce different numbers.
Similarly, performance measures should reflect the job. Instead of copying another company's targets, begin with your own baseline.
For example:
Revenue per Employee: R450,000
Goal Achievement Rate: 65%
Average Employee Performance: 72%
Training ROI: 20%
Then set realistic improvement targets.
Perhaps:
Revenue per Employee: R500,000
Goal Achievement Rate: 75%
Employee Performance: 80%
Training ROI: 50%
Measure regularly.
Investigate changes.
Improve the process.
Then measure again.
Turning Productivity Data into Action
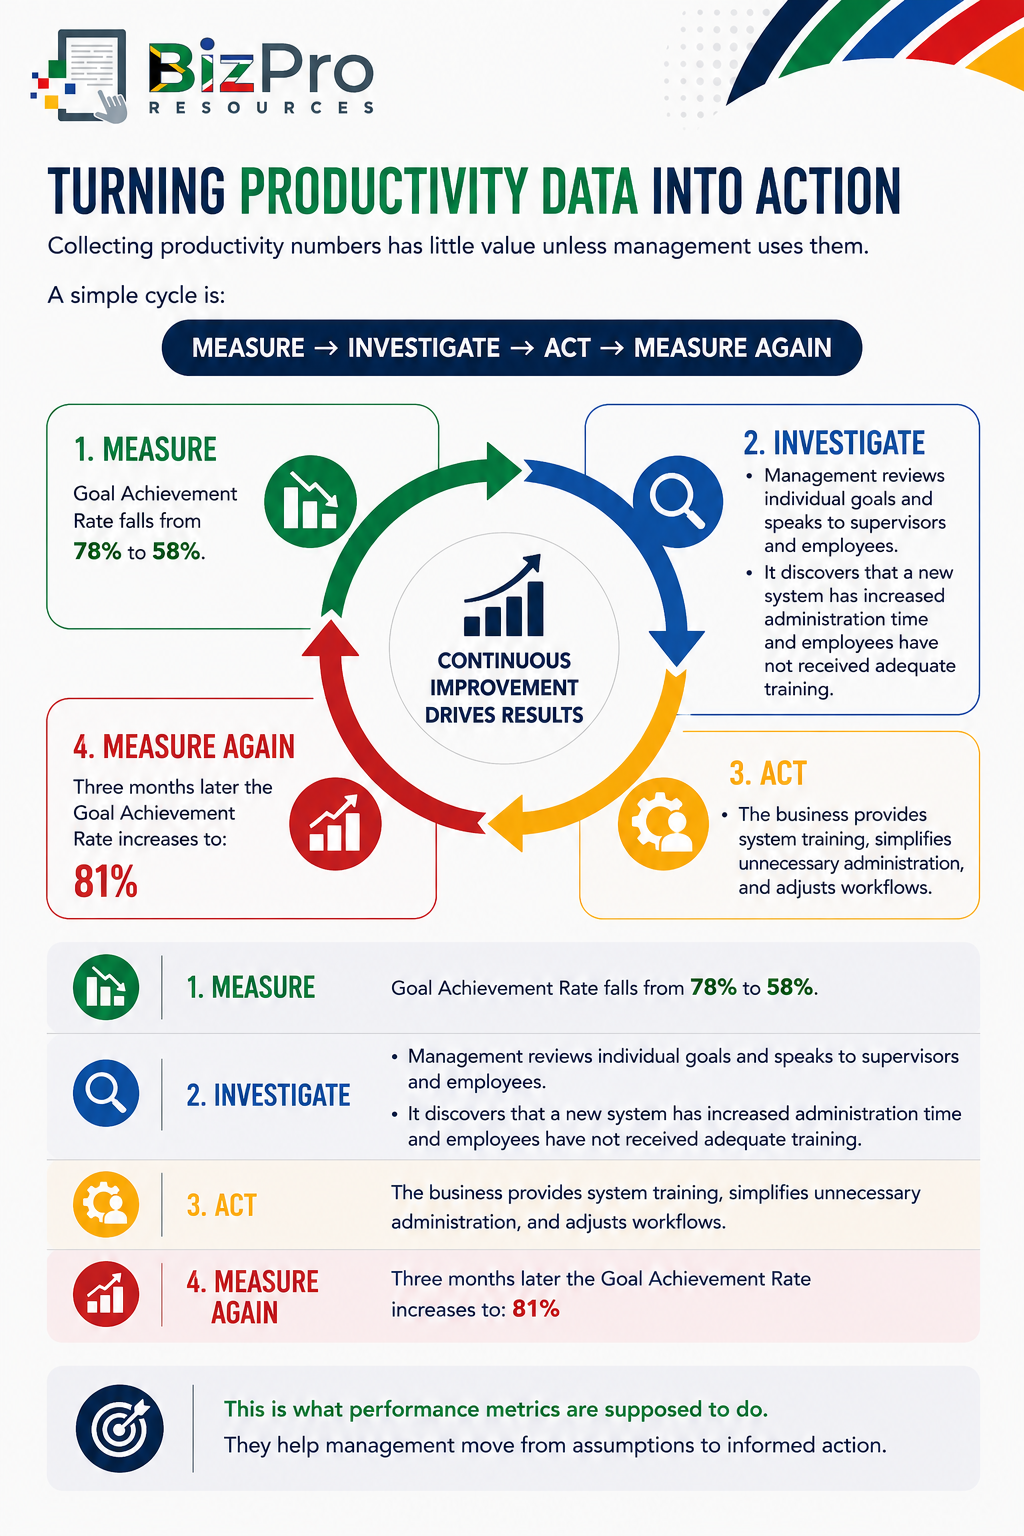
Collecting productivity numbers has little value unless management uses them.
A simple cycle is:
Questions to Ask Every Quarter
When reviewing Productivity and Value metrics, management should ask:
Is Revenue per Employee increasing or decreasing?
Is revenue growing faster or slower than employee numbers?
Which departments or branches are most productive?
Are employees achieving their agreed goals?
Are goals clear and realistic?
Which goals are regularly missed?
Are performance problems individual or company-wide?
Are employees being measured fairly?
Do employees have the tools and resources needed to perform?
Are our performance measures encouraging the right behaviour?
Is training improving actual performance?
What financial benefits are we receiving from training?
Which training programmes produce the strongest results?
Are we spending money on training that creates little measurable value?
Are quality and customer service being considered alongside quantity?
What has improved since the previous period?
Where should management focus next?
These questions turn HR data into practical management information.
Final Thoughts
Employees should never be viewed simply as a cost. They are also a major source of business value.
But management needs to understand whether that value is increasing, decreasing, or remaining unchanged.
Revenue per Employee helps measure how much revenue the workforce supports.
Goal Achievement Rate shows whether agreed objectives are being achieved.
Employee Performance provides a broader assessment of how effectively employees perform their roles.
Training ROI helps determine whether investment in employee development is creating measurable value.
No single metric should be used on its own:
High Revenue per Employee does not automatically mean employees are performing well.
High Goal Achievement does not automatically mean quality is good.
A positive Training ROI does not mean every benefit of training can be reduced to money.
A strong performance score is only useful if the measures themselves are appropriate.
The objective is not to turn people into numbers. The objective is to use numbers to better understand how people, processes, training, and business results work together.
For a small business, the process can remain simple:
Measure.
Investigate.
Improve.
Measure again.
Over time, this creates a clearer understanding of what employees contribute, where productivity is being lost, where development is needed, and how the business can create more value from its most important resource — its people.
Related Articles in the HR Performance Metrics Series
Rentention and Workforce Health Metrics
Productivity and Value Metrics
Disciplinary Procedure Metrics
AI Disclaimer
AI Tools were used to assist with research. Remember to always cross-check everything that you read.


