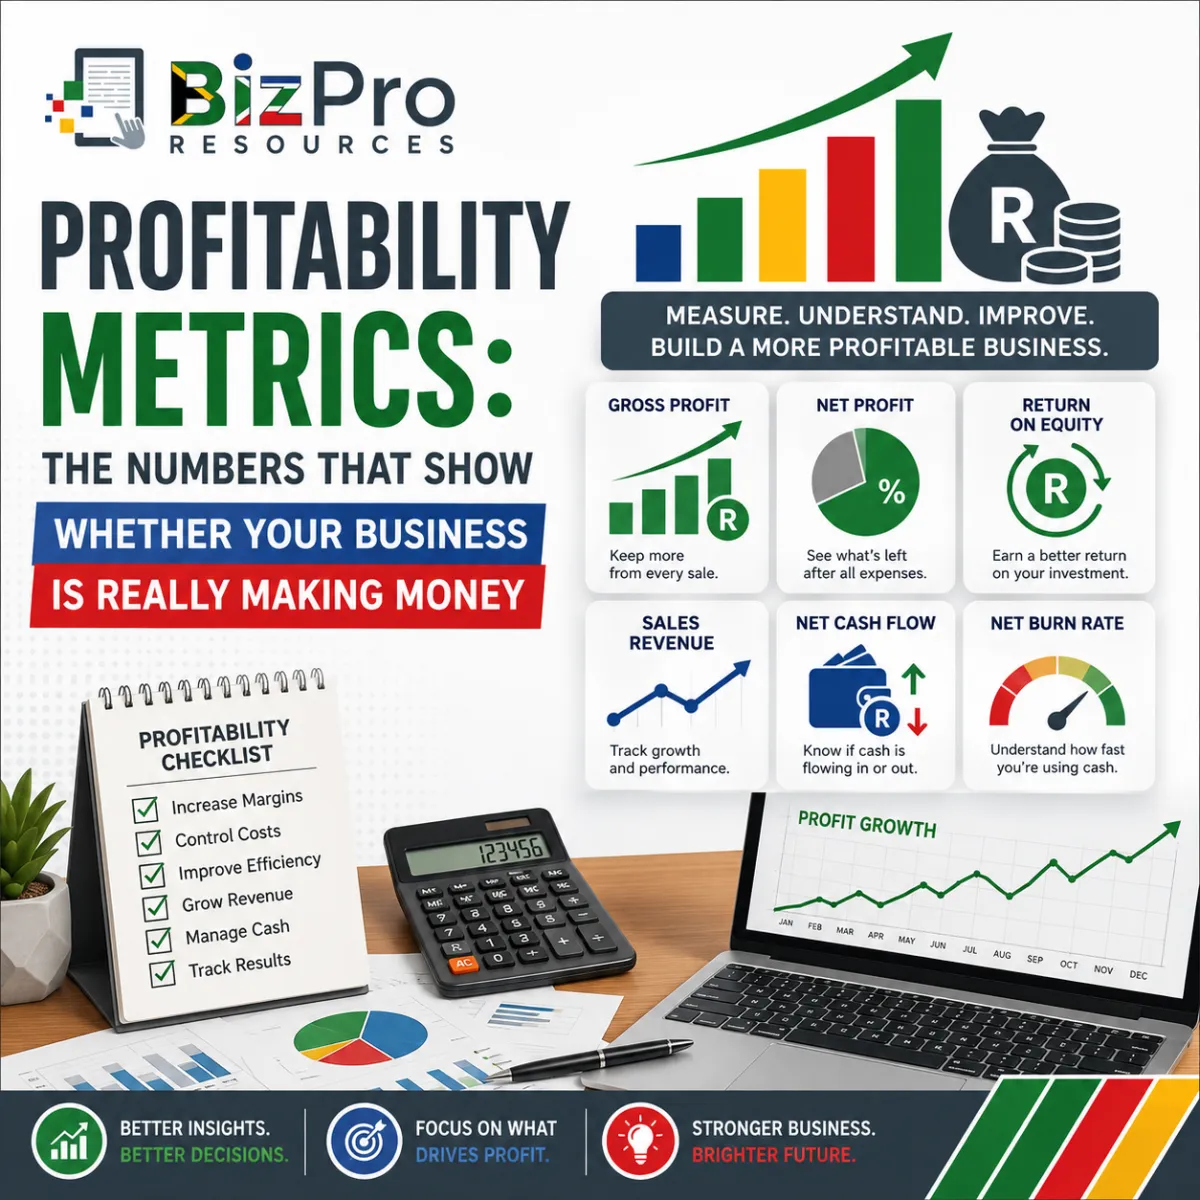
Profitability Metrics: The Numbers That Show Whether Your Business Is Really Making Money
Article #1 of #3 in the Finance Performance Metrics Series
Introduction
Profitability Metrics: The Numbers That Show Whether Your Business Is Really Making Money
Making sales and making money are not necessarily the same thing. This is one of the most important financial lessons for any small business owner to understand.
Imagine two businesses:
Business A generates R500,000 in sales during a month.
Business B generates only R350,000.
Which business performed better?
At first, you might choose Business A because it generated more sales. But what if Business A spent R490,000 to generate those sales and Business B spent only R280,000?
Suddenly, the picture looks very different.
This is why small business owners need to look beyond the amount of money coming into the business.
You need to understand how much money the business keeps, what it costs to generate sales, whether cash is increasing or decreasing, and whether the owners are earning a reasonable return on the money they have invested.
These are some of the questions that profitability metrics can help you answer.
In this article, we will examine six important financial measurements:
Gross Profit and Gross Profit Margin (GPM)
Net Profit and Net Profit Margin
Return on Equity (ROE)
Sales Revenue
Net Cash Flow
Net Burn Rate
Some of these measurements are directly concerned with profit, while others provide important supporting information about the financial performance and sustainability of the business.
For each one, we will explain what it means, how to calculate it, what poor performance can look like and what good performance can look like.
The aim is not to turn you into an accountant.
The aim is to help you understand the numbers well enough to manage your business better.
Why Profitability Matters
A business needs sales to survive, but sales alone are not enough.
Suppose an electrical contractor wins a R100,000 project. That sounds excellent.
But completing the project requires:
R45,000 in materials;
R25,000 in labour;
R8,000 in transport and other direct costs; and
additional business overheads.
The R100,000 is not profit. Most of that money already has somewhere else to go. This distinction becomes extremely important as a business grows. A company can become extremely busy while becoming less profitable.
It can hire more employees, buy more vehicles, complete more projects and generate more revenue while putting increasing pressure on its cash.
This is why you need several financial measurements rather than relying on one number.
Let us begin with one of the most useful.
1. Gross Profit and Gross Profit Margin
What Is Gross Profit?
Gross profit tells you how much money remains from your sales after subtracting the direct costs of providing the products or services you sold.
The basic calculation is:
Gross Profit = Sales Revenue − Cost of Goods Sold
You may also hear Cost of Goods Sold referred to as COGS or, depending on the business, cost of sales.
The important idea is that these are costs directly connected to producing or delivering what you sell:
For a retail business, this might be the cost of buying the products that are resold.
For a manufacturer, it could include materials and direct production costs.
For a contractor, it could include materials and direct labour used to complete jobs.
Exactly what should be included can depend on the type of business and its accounting practices. If you are unsure about how your business should classify a particular cost, discuss it with your accountant or bookkeeper.
Gross Profit Example
Suppose a plumbing company generates: Sales Revenue = R200,000
The direct costs associated with completing those jobs are: Cost of Sales = R130,000
The calculation is: Gross Profit = R200,000 − R130,000 = R70,000
The business therefore has R70,000 remaining after covering the direct costs of producing its R200,000 in sales.
But this does not mean the business made R70,000 in final profit.
The company may still need to pay expenses such as:
office rent;
administration salaries;
accounting fees;
insurance;
telephone costs;
software subscriptions;
marketing;
bank charges; and
other operating expenses.
Gross profit is therefore an important step towards understanding profitability, but it is not the final answer.
What Is Gross Profit Margin?
Gross profit becomes even more useful when we turn it into a percentage.
This is called the Gross Profit Margin, or GPM.
The formula is: Gross Profit Margin = (Gross Profit ÷ Sales Revenue) × 100
Using our plumbing company: Gross Profit = R70,000 and Sales Revenue = R200,000
Therefore: GPM = (R70,000 ÷ R200,000) × 100 = 35%
This means that for every R1 of sales, approximately 35 cents remains as gross profit before the company's other operating expenses are deducted.
Example of Poor Gross Profit Performance
Imagine the plumbing company's gross profit margin falls from 35% to 18%.
It generates R200,000 in sales but now has only: R200,000 × 18% = R36,000 in gross profit.
That is a major difference.
Several problems could be responsible:
material prices increased;
the business is charging too little;
employees are taking too long to complete jobs;
too much material is being wasted;
discounts are too generous;
quotations are inaccurate;
subcontractor costs have increased; or
the business is selling more low-margin work.
A falling gross profit margin is therefore an important warning sign.
The business owner should investigate why it costs so much to produce the sales.
Example of Good Gross Profit Performance
Suppose the owner improves quoting, negotiates better supplier prices and reduces material waste.
Sales remain at R200,000, but direct costs fall to R120,000.
Gross profit becomes: R200,000 − R120,000 = R80,000
Gross profit margin becomes: (R80,000 ÷ R200,000) × 100 = 40%
The business now keeps 40 cents in gross profit from every R1 of sales.
That gives the company more money to cover its other expenses and potentially generate net profit.
Importantly, there is no single gross profit margin that is automatically "good" for every business.
A supermarket, accounting practice, security company and construction business can have very different cost structures.
The most useful comparison is often your business against:
its previous performance;
its budget;
its targets; and
appropriate businesses in the same industry.
2. Net Profit and Net Profit Margin
What Is Net Profit?
Gross profit tells us what remains after direct costs.
Net profit goes much further.
It looks at what remains after the relevant business expenses have been deducted.
A simplified way of thinking about it is: Net Profit = Total Revenue − Total Expenses
Depending on the financial statement and accounting treatment, this can include items such as operating expenses, interest and tax.
Net profit is sometimes described as the bottom line because it appears towards the bottom of the income statement.
This is the number that helps answer a very important question:
After everything the business had to pay, did it actually make money?
Net Profit Example
Suppose a small automotive workshop generates: Sales Revenue = R500,000
Its cost of sales is: R300,000
Gross profit is therefore: R500,000 − R300,000 = R200,000
The company then has R160,000 in other expenses.
Its simplified net profit is: R200,000 − R160,000 = R40,000
The business generated R500,000 in sales but ultimately produced only R40,000 in net profit.
This demonstrates why sales revenue should never be confused with profit.
What Is Net Profit Margin?
The Net Profit Margin shows net profit as a percentage of revenue.
The formula is: Net Profit Margin = (Net Profit ÷ Revenue) × 100
Using our workshop: Net Profit Margin = (R40,000 ÷ R500,000) × 100 = 8%
This means that for every R1 in revenue, approximately 8 cents ultimately becomes net profit under this simplified example.
Example of Poor Net Profit Performance
Suppose the workshop generates R500,000 in monthly revenue but makes only R5,000 in net profit.
Its net profit margin would be: (R5,000 ÷ R500,000) × 100 = 1%
The business is operating on an extremely thin margin.
A relatively small unexpected expense could eliminate the entire month's profit.
For example:
a major equipment repair;
an unpaid customer account;
unexpected overtime;
higher electricity costs; or
a sudden drop in sales.
The business owner should investigate both sides of the profit equation: Can revenue be improved? and Can expenses be better controlled?
Example of Good Net Profit Performance
Suppose the workshop improves its pricing, reduces unnecessary overtime, controls purchasing and increases productivity.
Revenue increases to R550,000 and net profit increases to R66,000.
The net profit margin becomes: (R66,000 ÷ R550,000) × 100 = 12%
The company now keeps approximately 12 cents of net profit from each R1 of revenue.
This gives the business greater ability to:
build cash reserves;
reinvest;
buy equipment;
reduce debt;
survive difficult periods; and
provide returns to its owners.
Again, what counts as a strong net profit margin varies significantly between industries.
The trend is particularly important.
If your margin moves: 10% → 8% → 6% → 4% you have a warning.
If it moves: 4% → 6% → 8% → 10% something is improving.
Find out why.
3. Return on Equity (ROE)
What Is Return on Equity?
Business owners invest money in their businesses.
That investment should ideally produce a return.
Return on Equity, commonly called ROE, measures the profit generated relative to the owners' equity in the business.
The basic formula is: ROE = (Net Income ÷ Average Shareholders' Equity) × 100
For a small business, equity broadly represents the owners' financial interest in the company after liabilities are taken into account.
A simplified accounting relationship is: Equity = Assets − Liabilities
ROE helps answer: How effectively is the business using the owners' capital to generate profit?
ROE Example
Suppose the average owners' equity in a company is R1,000,000. The company generates R150,000 in net income for the year.
ROE is: (R150,000 ÷ R1,000,000) × 100 = 15%
The business generated a 15% accounting return on average equity for that period.
Example of Poor ROE Performance
Suppose the owners have R2 million in equity invested in a company, but the business produces only R40,000 in annual net income.
ROE is: (R40,000 ÷ R2,000,000) × 100 = 2%
A 2% ROE does not automatically prove that the business is bad, but it should raise questions.
Why is so much capital producing so little profit?
Perhaps:
expensive assets are underused;
margins are too low;
costs are too high;
sales are weak;
too much money is tied up in the business; or
the business is going through a temporary investment period.
The owner needs to understand the reason.
Example of Good ROE Performance
Suppose another company has average equity of R1 million and generates R200,000 in net income.
Its ROE is: (R200,000 ÷ R1,000,000) × 100 = 20%
The business is generating a stronger return relative to the owners' equity.
However, ROE needs to be interpreted carefully.
A company with substantial debt can sometimes show a high ROE because debt reduces the proportion of the business financed by equity.
So a high ROE should not automatically be celebrated without also understanding the company's debt and financial risk.
This is a good example of why business owners should never judge a business using only one metric.
4. Sales Revenue
What Is Sales Revenue?
Sales revenue is the income generated from selling the company's goods or services before expenses are deducted.
If you sell 100 products for R500 each: Sales Revenue = 100 × R500 = R50,000
For a service business, you might calculate revenue based on jobs completed, billable services or contracts.
For example, a security company with 200 customers paying an average of R800 per month would generate: 200 × R800 = R160,000 in monthly recurring sales revenue from those customers.
Sales revenue is one of the easiest business numbers to understand.
But it is also one of the easiest to misinterpret.
Why Sales Revenue Matters
Without revenue, there is eventually no business.
Revenue provides the money from which the company must:
cover direct costs;
pay employees;
pay rent;
pay suppliers;
cover overheads;
pay finance costs;
pay taxes where applicable; and
generate profit.
Tracking sales revenue helps you identify growth or decline.
Useful comparisons include:
This month vs last month
This quarter vs last quarter
This year vs last year
Actual revenue vs sales target
Revenue by product
Revenue by service
Revenue by branch
Revenue by salesperson
Revenue by customer type
These comparisons can reveal much more than one total figure.
Example of Poor Sales Revenue Performance
Suppose a small electrical business normally generates R400,000 per month.
Its recent performance is:
January: R405,000
February: R390,000
March: R360,000
April: R325,000
May: R290,000
The problem is not simply that May was a weak month. There is a clear downward trend. Management needs to investigate.
Possible questions include:
Are fewer enquiries coming in?
Are fewer quotations being issued?
Has the quotation conversion rate fallen?
Have important customers been lost?
Has a competitor entered the market?
Are customers spending less?
Is there a seasonal explanation?
Are salespeople following up properly?
Revenue tells you what is happening.
Further investigation tells you why.
Example of Good Sales Revenue Performance
Suppose the business sets an annual goal of increasing monthly sales from R400,000 to R500,000.
After improving marketing and sales follow-up, monthly revenue reaches R510,000.
That is positive performance.
But before celebrating, the owner should ask: Did profitability also improve?
If the company achieved the additional revenue only by heavily discounting prices or accepting unprofitable jobs, higher revenue might not produce a stronger business.
This brings us back to an important principle:
Revenue growth is valuable when it contributes to sustainable profit and cash flow.
5. Net Cash Flow
What Is Net Cash Flow?
Profit and cash are not the same thing. This causes problems for many growing businesses.
A company can show a profit on its income statement while struggling to pay its bills.
Why?
Because accounting profit does not necessarily mean the cash has already arrived in the bank.
For example, you might complete a R100,000 job and invoice the customer today.
That sale may be recognised in your accounting records, depending on your accounting basis, but the customer might pay you only 30 or 60 days later.
Meanwhile, your employees and suppliers still need to be paid.
Net cash flow measures the difference between cash flowing into and out of the business during a period.
A simplified formula is: Net Cash Flow = Total Cash Inflows − Total Cash Outflows
A full cash flow statement normally separates cash flows into:
operating activities;
investing activities; and
financing activities.
For day-to-day small business management, the essential idea is understanding whether the business is generating or consuming cash.
Net Cash Flow Example
Suppose during one month:
Cash Inflows = R450,000
Cash Outflows = R400,000
Net cash flow is: R450,000 − R400,000 = R50,000
The company generated positive net cash flow of R50,000 during that period.
Example of Poor Net Cash Flow Performance
Suppose:
Cash Inflows = R350,000
Cash Outflows = R430,000
Net cash flow is: R350,000 − R430,000 = −R80,000
The business had negative net cash flow of R80,000.
If this happens once because the company bought an important piece of equipment, it may not necessarily indicate poor business performance.
But if operating cash flow is repeatedly negative, the company may have a serious problem.
Possible causes include:
customers paying slowly;
declining sales;
excessive expenses;
too much stock;
poor debtor collection;
large loan repayments; or
rapid expansion.
If the pattern continues, the business will need another source of cash.
That could mean using reserves, borrowing money or obtaining additional investment.
Eventually those options can run out.
Example of Good Net Cash Flow Performance
Suppose a company improves its customer collection process and reduces unnecessary spending.
Monthly cash inflows increase to R480,000 while outflows are R410,000.
Net cash flow becomes: R480,000 − R410,000 = R70,000
The business is adding cash rather than consuming it.
This can strengthen its ability to:
pay suppliers on time;
meet payroll;
build emergency reserves;
invest in growth;
handle unexpected expenses; and
reduce dependence on borrowing.
However, positive cash flow also needs context.
A business could have positive cash flow because it borrowed R1 million from a bank.
That does not mean its normal operations suddenly became profitable.
Always understand where the cash came from.
6. Net Burn Rate
What Is Net Burn Rate?
Burn rate measures how quickly a business is using its available cash.
It is particularly useful for businesses that are currently spending more cash than they generate.
The term is commonly associated with start-ups, but the basic idea can also be useful for an established small business going through:
expansion;
a major investment programme;
a temporary downturn;
a new branch opening;
product development; or
another period of planned negative cash flow.
Net burn rate focuses on the difference between cash outflows and cash inflows during a period when the business is consuming cash.
A simplified monthly calculation is: Net Burn Rate = Monthly Cash Outflows − Monthly Cash Inflows when outflows exceed inflows.
Net Burn Rate Example
Suppose a growing business has:
Monthly Cash Outflows = R500,000
Monthly Cash Inflows = R420,000
Net burn rate is: R500,000 − R420,000 = R80,000 per month
The business is consuming approximately R80,000 of cash each month. This becomes especially useful when combined with the amount of cash available.
Suppose the business has R480,000 in cash reserves.
At a net burn rate of R80,000 per month, a simple estimate of its cash runway is: R480,000 ÷ R80,000 = 6 months
If nothing changes, the business has approximately six months before those reserves are exhausted.
Real-world cash flows will rarely be perfectly constant, so runway should be treated as an estimate rather than a guarantee.
Example of Poor Net Burn Rate Performance
Suppose a company has R600,000 in available cash.
Its net burn rate increases:
January: R50,000
February: R70,000
March: R90,000
April: R120,000
This trend is worrying. At R120,000 per month, R600,000 would represent only about five months of runway if the burn continued at that level.
Management needs to understand why cash consumption is accelerating.
Perhaps:
payroll has increased too quickly;
a new branch is costing more than expected;
sales growth has not materialised;
marketing expenditure is producing poor results;
customers are paying slowly; or
operating expenses are uncontrolled.
The key danger is not merely that the company is losing cash.
It is that the company could run out of cash before its strategy starts producing results.
Example of Good Net Burn Rate Performance
Suppose management responds.
The business improves collections, reduces unnecessary expenses and increases sales.
Its burn rate changes:
April: R120,000
May: R90,000
June: R55,000
July: R20,000
The company is moving towards cash-flow break-even.
If cash inflows eventually exceed cash outflows, the business will stop burning cash under this simplified calculation and begin generating positive net cash flow.
That is a much healthier direction. However, context matters again.
A business deliberately investing heavily in a profitable expansion might temporarily have a higher burn rate.
The key questions are:
Was the cash consumption planned?
Can the business afford it?
Is the investment producing the expected results?
How much runway remains?
How These Six Metrics Work Together
These measurements become far more powerful when you look at them together.
Imagine a business reporting the following:
Sales Revenue: Increasing strongly. That sounds good.
Gross Profit Margin: Falling. Now there is a concern.
Net Profit Margin: Falling. The concern becomes stronger.
Net Cash Flow: Negative. Now management needs to pay close attention.
Net Burn Rate: Increasing. The company's cash position may become dangerous.
ROE: Declining. The owners are receiving a weaker return on the capital invested in the company.
Looking only at revenue could have created the impression that the business was performing well.
Looking at all six measurements tells a completely different story.
Now consider another company:
Sales Revenue: Growing steadily
Gross Profit Margin: Improving
Net Profit Margin: Improving
Net Cash Flow: Positive
Net Burn Rate: Not applicable because operations are generating cash
ROE: Improving
That is a much stronger combination.
This is why financial management requires more than one number.
A Practical Example: Two Businesses with the Same Sales
Consider two small businesses that each generate R5 million in annual sales.
Business A
Sales Revenue: R5,000,000
Gross Profit: R1,250,000
Gross Profit Margin: 25%
Net Profit: R100,000
Net Profit Margin: 2%
Net Cash Flow: Negative
ROE: Low
Cash Burn: Increasing
Business B
Sales Revenue: R5,000,000
Gross Profit: R2,000,000
Gross Profit Margin: 40%
Net Profit: R600,000
Net Profit Margin: 12%
Net Cash Flow: Positive
ROE: Healthy relative to its circumstances
Cash Burn: None from normal operations
Both businesses have exactly the same sales revenue. But they are clearly not performing equally.
Business B is retaining much more value from every rand of sales and, based on this simplified example, appears to have a much stronger financial position.
This illustrates an important lesson: Do not judge the size or success of a business by sales alone.
Build a Simple Monthly Profitability Dashboard
You do not need complicated financial software to begin monitoring these measurements.
Your accounting system may already provide much of the information.
A simple monthly dashboard could include:
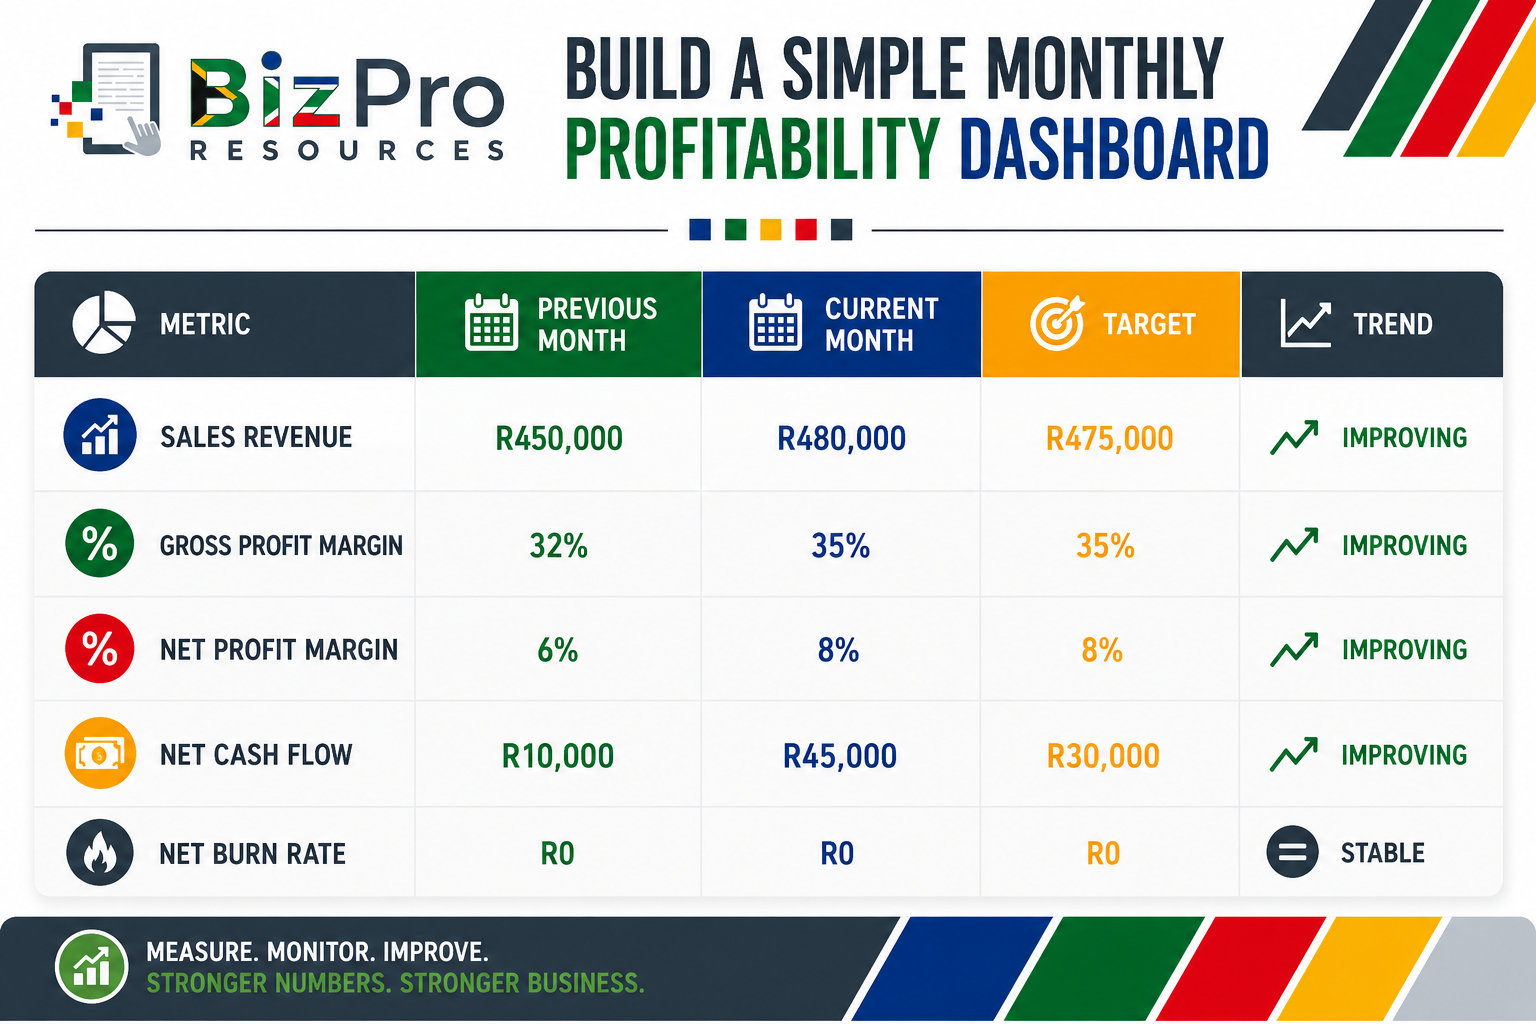
ROE is usually more useful when reviewed over a longer period rather than treated purely as a month-to-month operating measure.
The purpose of your dashboard is not simply to collect numbers.
Every month, ask:
What changed?
Why did it change?
Is the change good or bad?
Is it temporary or part of a trend?
Do we need to take action?
Watch for Relationships Between the Metrics
The real power of business metrics often comes from understanding the relationships between them.
Sales Up + Margin Up
Generally encouraging.
You are generating more revenue and keeping more gross profit from each rand of sales.
Sales Up + Margin Down
Investigate.
You may be growing through discounts, lower-margin products or rising direct costs.
Profit Up + Cash Flow Down
Investigate.
Perhaps customers are paying slowly, stock levels are increasing or cash is being used elsewhere.
Sales Down + Profit Margin Up
Not automatically bad.
Perhaps the company deliberately stopped accepting low-margin work.
High ROE + High Debt
Investigate carefully.
Debt may be contributing to the high ROE and could also increase financial risk.
Negative Cash Flow + High Burn Rate
Urgent attention may be required, particularly if cash reserves are limited.
This is why a good business owner does not ask only: “What is the number?”
Ask: “What is the number telling me about the business?”
Do Not Search for One Universal "Good" Number
You will often find articles online saying things such as: “A good profit margin is X%.” Be careful.
Businesses are different:
A grocery retailer may operate with relatively small margins and large sales volumes.
A professional consulting business may have a very different cost structure.
A security company employing hundreds of guards has different economics from a software business.
A motor workshop has different costs from an accounting practice.
Even two businesses in the same industry may differ because of:
location;
size;
customer type;
pricing;
business model;
debt;
growth stage; and
competitive strategy.
Instead of looking for one magical number, compare your metrics against meaningful benchmarks.
These could include:
Your budget
Your target
Last month
Last year
Your historical average
Relevant industry information
Then investigate the trend.
Common Mistakes Small Business Owners Make
Mistake 1: Confusing Sales with Profit
R1 million in sales does not mean R1 million in profit.
Always understand what remains after costs.
Mistake 2: Looking Only at the Bank Balance
A healthy bank balance today does not necessarily mean the business is profitable.
Some of that money may be needed for VAT, PAYE, suppliers, salaries, loan payments or other obligations.
Mistake 3: Ignoring Gross Margin
A business can grow revenue while its underlying economics become worse.
Track your margin.
Mistake 4: Ignoring Cash Flow
Profitable businesses can still experience cash-flow problems.
Track both profit and cash.
Mistake 5: Looking at Only One Month
One unusual month can distort the picture.
Look for trends.
Mistake 6: Comparing Yourself with the Wrong Business
A good margin for one industry may be poor or unrealistic for another.
Use relevant comparisons.
Mistake 7: Measuring Without Taking Action
A dashboard is useless if nobody responds to what it shows.
Turn Your Numbers into Management Actions
The purpose of measuring profitability is not accounting for the sake of accounting. It is better management.
If your gross profit margin is falling, investigate:
supplier costs;
pricing;
discounts;
labour efficiency;
waste;
quoting accuracy; and
product or service mix.
If your net profit margin is falling, investigate:
overheads;
payroll;
rent;
administration costs;
financing costs;
unnecessary expenses; and
overall pricing.
If sales revenue is falling, investigate:
lead generation;
customer retention;
sales conversion;
competition;
pricing;
sales activity; and
customer demand.
If ROE is weak, investigate:
profitability;
asset use;
capital tied up in the business; and
whether the business is generating an appropriate return for its circumstances.
If net cash flow is consistently negative, investigate:
customer collections;
stock;
expenses;
debt payments;
capital expenditure; and
the timing of money entering and leaving the business.
If net burn rate is increasing, investigate immediately:
available cash;
monthly spending;
revenue growth;
runway; and
what needs to change before cash reserves become dangerously low.
Every metric should eventually lead to a question.
Every important question should lead to an investigation.
And every investigation should eventually lead to a decision.
Final Thoughts
Small business owners work extremely hard to generate sales. But sales are only the beginning of the financial story.
You also need to know:
How much gross profit are we making?
What percentage of our sales becomes gross profit?
How much net profit remains after expenses?
What percentage of revenue ultimately becomes net profit?
What return are the owners earning on their equity?
Is sales revenue growing or declining?
Is the business generating cash or consuming it?
If we are burning cash, how quickly are we using our reserves?
These questions give you a much clearer understanding of your business.
Do not worry if you have never measured all these numbers before:
Start with what you can measure.
Record it consistently.
Compare it over time.
Investigate unexpected changes.
Then take action.
Remember the principle introduced at the beginning of this Business Performance Metrics series: You cannot properly manage something if you are not measuring it.
Profitability metrics turn your financial records into management information.
And once you understand what the numbers are telling you, you are in a much stronger position to make decisions that can build a healthier, more profitable and more sustainable business.
Related Articles in the Finance Metrics Series
Profitability Metrics: The Numbers That Show Whether Your Business Is Really Making Money
Liquidity and Solvency Metrics: Can Your Business Pay Its Bills and Manage Its Debt?
Efficiency Metrics: Is Your Business Making the Best Use of Its Assets and Inventory?
AI Disclaimer
AI Tools were used to assist with research. Remember to always cross-check everything that you read.


