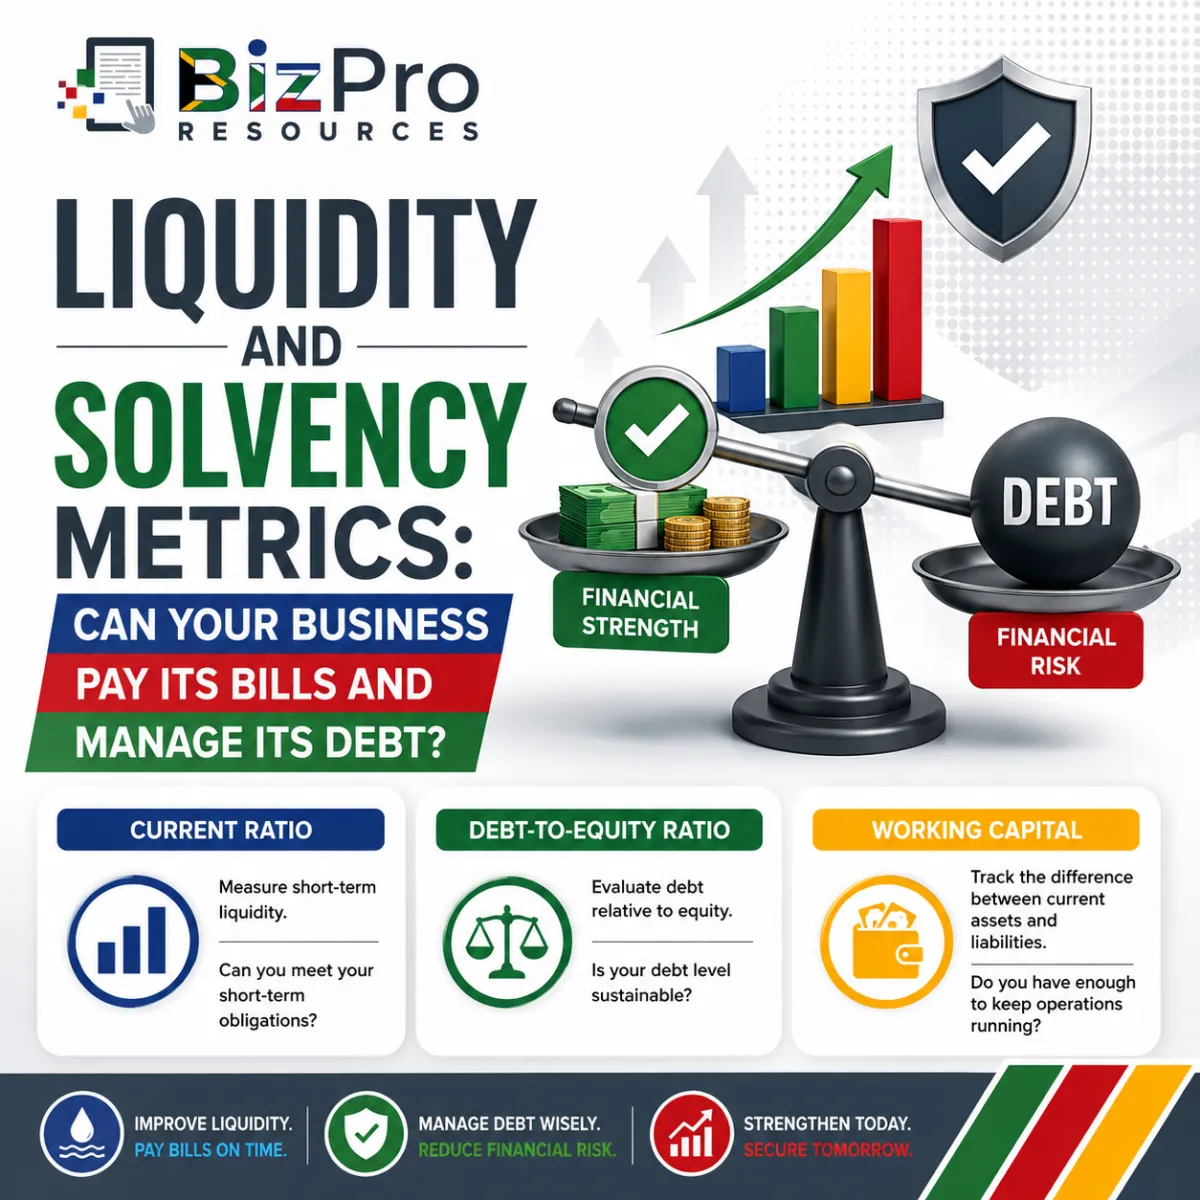
Liquidity and Solvency Metrics: Can Your Business Pay Its Bills and Manage Its Debt?
Article #2 of #3 in the Finance Performance Metrics Series
Introduction
A business can be profitable and still run into serious financial trouble. That statement may sound strange. If the business is making a profit, surely it should be financially healthy?
Not necessarily.
Imagine a small construction company that has completed several profitable projects. Its accounting records show that the business is making money.
However, many customers have not paid their invoices yet.
At the same time:
employees need to be paid;
suppliers are demanding payment;
VAT and other taxes may be due;
vehicle instalments need to be paid;
rent is due; and
loan repayments must continue.
The company may be profitable on paper but have very little cash available.
Now imagine another company with enough money to pay this month's bills, but it has accumulated so much long-term debt that its financial position is becoming increasingly risky.
These are two different financial problems:
The first is mainly about liquidity.
The second is mainly about solvency.
Both are extremely important for small business owners.
In this article, we will examine three useful financial metrics:
Current Ratio
Debt-to-Equity Ratio
Working Capital
For each metric, we will explain what it means, how it is calculated, what poor performance can look like and what good performance can look like.
The goal is simple: To help you understand whether your business is in a strong enough financial position to meet its obligations and continue operating sustainably.
Understanding Liquidity and Solvency
Before looking at the individual metrics, we need to understand two important financial terms.
What Is Liquidity?
Liquidity refers to a business's ability to meet its short-term financial obligations.
In simple terms: Can you pay the bills that need to be paid soon?
These could include:
supplier accounts;
salaries and wages;
rent;
electricity;
short-term loan payments;
taxes;
insurance;
vehicle expenses; and
other operating costs.
A business with good liquidity generally has enough short-term resources to meet its short-term obligations.
A business with poor liquidity may struggle to pay bills when they become due.
What Is Solvency?
Solvency looks more broadly at the longer-term financial health of the business and its ability to meet its debts and obligations over time.
A business may have enough cash to survive this month but still have a dangerous long-term debt position.
For example, imagine a company that has:
R2 million in assets;
R1.8 million in liabilities; and
only R200,000 in owners' equity.
That business may be much more financially vulnerable than another company with R2 million in assets and only R500,000 in liabilities.
Liquidity asks: Can we meet our short-term obligations?
Solvency asks a broader question: Is the overall financial structure of the business sustainable?
These ideas are connected, but they are not the same.
1. Current Ratio
What Is the Current Ratio?
The Current Ratio is one of the most common measures of short-term liquidity. It compares your current assets with your current liabilities.
The formula is: Current Ratio = Current Assets ÷ Current Liabilities
To understand the calculation, we first need to understand what these two terms mean.
What Are Current Assets?
Current assets are generally assets expected to be converted into cash, sold or used within the normal operating cycle or approximately the next 12 months.
Examples can include:
cash in the bank;
money owed by customers or trade receivables;
inventory or stock;
certain short-term investments; and
some prepaid expenses.
The exact accounting classification can depend on the circumstances, so your accountant or bookkeeper can help you identify which items on your balance sheet are current assets.
What Are Current Liabilities?
Current liabilities are obligations generally due within approximately the next 12 months or the normal operating cycle.
Examples can include:
money owed to suppliers;
short-term loans;
the current portion of longer-term debt;
certain taxes payable;
accrued expenses; and
other short-term obligations.
The Current Ratio compares these two groups.
How Is the Current Ratio Calculated?
Suppose a small security company has: Current Assets = R600,000 and Current Liabilities = R400,000.
The calculation is:
Current Ratio = Current Asssts ÷ Current Liabilities
Current Ratio = R600,000 ÷ R400,000 = 1.5
This can also be expressed as: 1.5 : 1
In simple terms, the business has R1.50 of current assets for every R1 of current liabilities.
What Does a Current Ratio Below 1 Mean?
Suppose the same company has:
Current Assets = R300,000
Current Liabilities = R500,000
Its Current Ratio would be: R300,000 ÷ R500,000 = 0.6
The company has only 60 cents in current assets for every R1 of current liabilities. This could indicate a liquidity problem.
The business may struggle to meet its short-term obligations unless:
customers pay quickly;
additional sales generate cash;
the owner introduces more capital;
the business borrows money; or
other cash becomes available.
However, a Current Ratio below 1 does not automatically mean that the business will fail. Different businesses have different operating cycles and cash-flow patterns.
A business that receives cash immediately from customers may operate differently from a business where customers take 60 days to pay.
Context matters.
Example of Poor Current Ratio Performance
Imagine an electrical contractor has:
Current Assets = R450,000
Current Liabilities = R750,000
The Current Ratio is: R450,000 ÷ R750,000 = 0.6
This deserves attention. The business has significantly more short-term liabilities than current assets.
The owner should investigate:
How much cash is actually available?
How much money do customers owe?
How quickly will customers pay?
How much stock is included in current assets?
Which supplier accounts are due?
Are tax payments approaching?
Are there short-term loan repayments?
Are customers paying too slowly?
The ratio does not tell the owner exactly what the problem is. It tells the owner: "Your short-term financial position needs investigation."
That is the value of a metric.
Example of Good Current Ratio Performance
Suppose the company improves debtor collection, builds cash reserves and better manages short-term obligations.
It now has:
Current Assets = R900,000
Current Liabilities = R600,000
The Current Ratio becomes: R900,000 ÷ R600,000 = 1.5
The company now has R1.50 in current assets for every R1 of current liabilities. This provides a stronger short-term financial cushion. But there is another important lesson here.
A very high Current Ratio is not automatically excellent.
Suppose a business has a Current Ratio of 5.
That might look fantastic, but:
Perhaps the business is holding enormous amounts of slow-moving stock.
Or customers owe the business large amounts of money that are not being collected.
Or excess cash is sitting unused instead of being invested productively.
The aim is not simply to make the ratio as high as possible. The aim is to understand what the ratio says about your business.
Look Inside Your Current Assets
The Current Ratio has an important limitation. Not all current assets are equally liquid.
Consider two businesses:
Business A Current Assets:
Cash: R400,000
Receivables: R300,000
Inventory: R100,000
Total: R800,000
Business B Current Assets:
Cash: R50,000
Receivables: R150,000
Inventory: R600,000
Total: R800,000
Both companies may report exactly the same amount of current assets.
But their positions are very different:
Business A has much more cash available.
Business B has most of its current assets tied up in inventory.
If that inventory takes months to sell, Business B may experience more pressure when bills become due. This is why business owners should not look only at the final ratio.
Ask: What is actually inside the number?
2. Debt-to-Equity Ratio
What Is the Debt-to-Equity Ratio?
The Debt-to-Equity Ratio helps you understand how much debt a business is using relative to the owners' equity. It is commonly used as an indicator of financial leverage and solvency risk.
The basic formula is: Debt-to-Equity Ratio = Total Debt ÷ Shareholders' Equity
Depending on the purpose of the analysis, definitions can differ. Some calculations use interest-bearing debt, while others may use broader liabilities.
For a small business owner, the most important thing is to understand exactly what is included in the calculation and then use the same approach consistently when comparing performance.
Understanding Equity
Equity represents the owners' financial interest in the business.
A simplified accounting equation is: Assets = Liabilities + Equity
Therefore: Equity = Assets − Liabilities
Suppose your company has:
Assets = R2,000,000
Liabilities = R1,200,000
Then:
Equity = R2,000,000 − R1,200,000
Equity = R800,000
This represents the accounting value attributable to the owners under this simplified example.
How Is the Debt-to-Equity Ratio Calculated?
Suppose a small manufacturing company has:
Total Debt = R600,000
Equity = R800,000
The calculation is:
Debt-to-Equity Ratio = R600,000 ÷ R800,000
Debt-to-Equity Ratio = 0.75
This means the company has approximately 75 cents of debt for every R1 of equity.
Why Businesses Use Debt
Debt is not automatically bad. This is extremely important. Businesses borrow money for many sensible reasons.
A company might use debt to:
purchase equipment;
buy vehicles;
finance expansion;
open another branch;
acquire property;
purchase stock;
improve production capacity; or
fund other investments.
Suppose a plumbing company borrows R500,000 to buy additional vehicles and equipment. Those assets allow it to employ another team and generate an additional R1 million in profitable annual sales. That debt may have contributed to growth.
The real question is not: "Does the business have debt?"
The better questions are:
"How much debt does it have?"
"Can it comfortably service the debt?"
"What is the debt being used for?"
"Is the debt helping the business generate sufficient returns?"
Example of Poor Debt-to-Equity Performance
Suppose a small business has:
Debt = R1,800,000
Equity = R600,000
Debt-to-Equity Ratio: R1,800,000 ÷ R600,000 = 3.0
The company has R3 of debt for every R1 of equity. This may indicate substantial financial leverage. Again, whether that ratio is acceptable depends on the industry and circumstances.
But a highly leveraged small business may face several risks:
Higher Interest Costs:
Borrowing money costs money.
Higher debt can mean larger interest payments.
Greater Cash-Flow Pressure
Loan instalments still need to be paid even when sales are weak.
Less Flexibility:
The company may have less room to borrow additional money when an emergency or opportunity appears.
Greater Risk During a Downturn:
If revenue falls sharply, debt repayments do not automatically disappear.
Increased Exposure to Interest Rates:
Depending on the loan terms, changing interest rates can increase borrowing costs.
A high or rapidly rising Debt-to-Equity Ratio should therefore encourage the owner to investigate the company's financial risk.
Example of Good Debt-to-Equity Performance
Suppose another business has:
Debt = R400,000
Equity = R1,000,000
Debt-to-Equity Ratio: R400,000 ÷ R1,000,000 = 0.4
The business has 40 cents of debt for every R1 of equity. This indicates a lower level of debt relative to equity than our previous example. The business may have greater financial flexibility and lower debt-related risk.
But we should still avoid saying: "Low debt is always good."
Imagine a highly profitable business that refuses to borrow R300,000 for equipment that could significantly increase productive capacity.
Avoiding all debt might actually limit growth. Debt is a financial tool.
The important issue is whether it is being used responsibly.
What Does a Rising Debt-to-Equity Ratio Tell You?
Trends are often more useful than a single number.
Suppose your Debt-to-Equity Ratio changes as follows:
Year 1: 0.5
Year 2: 0.8
Year 3: 1.4
Year 4: 2.1
Debt is becoming increasingly important in the company's financial structure relative to equity. That does not automatically mean there is a crisis. Perhaps the company is deliberately financing a major expansion.
But management should investigate.
Ask:
Why is debt increasing?
What was the borrowed money used for?
Is the investment producing additional profit?
Can cash flow comfortably cover repayments?
What happens if sales fall?
Are interest costs increasing?
Is additional borrowing planned?
A metric should trigger better management questions.
3. Working Capital
What Is Working Capital?
Working capital is another important measure of short-term financial health. It measures the difference between your current assets and current liabilities.
The formula is: Working Capital = Current Assets − Current Liabilities
Unlike the Current Ratio, which gives you a ratio, working capital gives you a rand amount.
It helps you understand the short-term financial resources available after current liabilities are taken into account.
How Is Working Capital Calculated?
Suppose a small motor repair business has:
Current Assets = R700,000
Current Liabilities = R500,000
Working capital is: R700,000 − R500,000 = R200,000.
The business has positive working capital of R200,000.
Now suppose another company has:
Current Assets = R400,000
Current Liabilities = R550,000
Working capital is: R400,000 − R550,000 = −R150,000.
The business has negative working capital of R150,000.
That deserves attention.
Why Working Capital Is So Important
Working capital helps keep the everyday business operating. Consider a small plumbing business.
Before a customer pays, the company may need to:
buy materials;
put fuel in vehicles;
pay employees;
pay subcontractors;
cover insurance;
pay suppliers; and
cover administration expenses.
The company needs enough financial resources to bridge the period between spending money and receiving money.
This is where working capital becomes critical.
The Working Capital Cycle
Many small businesses experience a cycle that looks something like this:
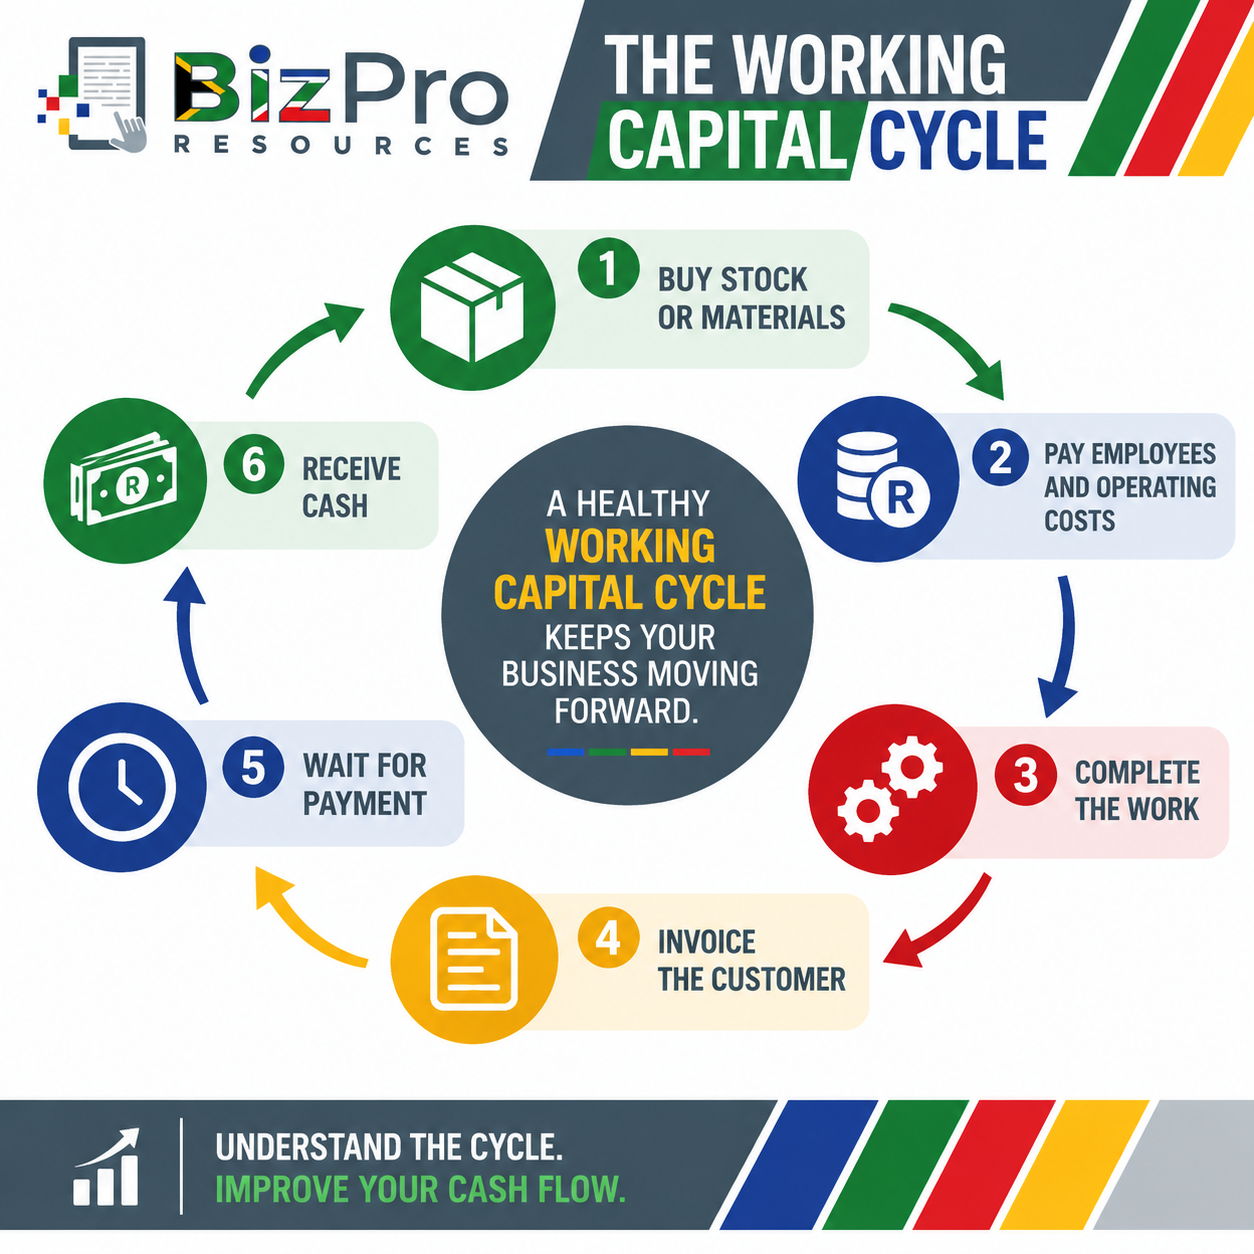
The longer this cycle takes, the more working capital the business may require.
Imagine an engineering company completing a project today but receiving payment only 60 days later.
For those 60 days, it still needs money to operate. Now imagine that the company wins several large projects simultaneously. This sounds like excellent news. But the business may suddenly need much more working capital.
This is why fast growth can sometimes create cash-flow problems.
Example of Poor Working Capital Performance
Suppose a small security company has:
Current Assets = R1,000,000
Current Liabilities = R1,300,000
Working capital is: R1,000,000 − R1,300,000 = −R300,000
The company has negative working capital.
Possible problems might include:
customers paying too slowly;
supplier balances becoming too high;
short-term borrowing increasing;
too much money tied up in stock;
rapid expansion;
poor cash-flow planning; or
insufficient cash reserves.
The company might still be profitable. But it may struggle to pay obligations when they become due.
This is one of the most dangerous situations for a growing small business.
What Poor Working Capital Can Mean in Practice
Poor working capital is not just an accounting problem. It can affect everyday operations.
The company might:
pay suppliers late;
lose supplier discounts;
damage supplier relationships;
struggle to buy stock;
delay important maintenance;
depend on overdrafts;
struggle to pay salaries;
miss tax obligations; or
turn away profitable work because it cannot finance the job.
A company can therefore have plenty of customers and still experience a working capital crisis.
Example of Good Working Capital Performance
Suppose the security company improves collections and negotiates better supplier payment terms.
Its position changes to:
Current Assets = R1,500,000
Current Liabilities = R900,000
Working capital becomes: R1,500,000 − R900,000 = R600,000
The company now has positive working capital of R600,000.
This stronger position may make it easier to:
meet short-term obligations;
purchase necessary supplies;
manage unexpected costs;
finance normal operations;
take advantage of opportunities; and
survive temporary reductions in cash inflows.
But, just like the Current Ratio, more working capital is not automatically better in every situation.
Too much money sitting in:
unused cash;
excessive inventory; or
overdue customer accounts
may indicate that resources are not being managed efficiently.
Working Capital and Customer Payment Terms
One of the biggest working capital problems for South African small businesses can be slow-paying customers.
Imagine your business sells R300,000 worth of services this month. That sounds good. But your customers have 60-day payment terms. You may need to wait two months for much of that money.
Meanwhile:
Employees want payment this month.
Fuel must be purchased this month.
Suppliers may want payment this month.
Rent is due this month.
Other operating costs are due this month.
Your sales may be healthy while your working capital comes under severe pressure. This is why debtor management is not simply an administrative task.
It is a financial management activity.
Working Capital and Inventory
Inventory can create another challenge. Imagine an automotive parts business has R1 million worth of stock. That stock forms part of the company's assets. But suppose R400,000 of it consists of old parts that rarely sell.
On paper, the business may appear to have significant current assets. In practice, that stock may not quickly help the business pay tomorrow's supplier accounts.
This is why business owners should regularly ask:
How much stock do we hold?
How quickly does it sell?
Which items are slow-moving?
Which items are obsolete?
Are we ordering too much?
Is cash unnecessarily trapped in inventory?
We will explore inventory efficiency in more detail when we discuss Inventory Turnover in the Efficiency Metrics article.
Current Ratio and Working Capital: What Is the Difference?
These two metrics use the same basic financial information but present it differently.
Suppose:
Current Assets = R900,000
Current Liabilities = R600,000
Current Ratio: R900,000 ÷ R600,000 = 1.5
This tells you the relationship between current assets and current liabilities.
Working Capital: R900,000 − R600,000 = R300,000
This tells you the rand difference.
Both are useful.
The Current Ratio helps you compare relative liquidity.
Working capital helps you understand the actual rand amount involved.
A Practical Comparison of Two Businesses
Consider two companies.
Company A:
Current Assets: R600,000
Current Liabilities: R500,000
Current Ratio: 1.2
Working Capital: R100,000
Debt: R1,500,000
Equity: R500,000
Debt-to-Equity Ratio: 3.0
Company B:
Current Assets: R1,200,000
Current Liabilities: R600,000
Current Ratio: 2.0
Working Capital: R600,000
Debt: R500,000
Equity: R1,000,000
Debt-to-Equity Ratio: 0.5
At first glance, Company B appears to have a stronger liquidity and debt position.
It has:
more positive working capital;
a higher Current Ratio; and
less debt relative to equity.
But even now, we should not make a final judgment without understanding the businesses.
Perhaps Company A has highly predictable cash flows and is using debt to fund a very profitable expansion. Perhaps Company B has R700,000 of its current assets tied up in obsolete inventory.
Metrics help you identify what to investigate.
They do not remove the need for business judgment.
What Is a "Good" Current Ratio?
Small business owners naturally want a simple answer.
You might ask: "What Current Ratio should my business have?"
There is no single answer that is correct for every business. A ratio above 1 generally means current assets exceed current liabilities.
But whether 1.2, 1.5, 2.0 or another figure represents a healthy position depends on factors such as:
industry;
business model;
customer payment terms;
inventory levels;
supplier payment terms;
cash-flow predictability; and
the quality of the current assets.
A cash-based retailer can operate differently from a contractor waiting 60 days for customer payments.
Use the ratio as a management tool rather than searching for one magical number.
What Is a "Good" Debt-to-Equity Ratio?
The same principle applies to Debt-to-Equity. There is no universal perfect ratio. Different industries use debt differently.
A company owning expensive vehicles, machinery or property may have a different capital structure from a professional services business that needs relatively few physical assets.
Instead of asking only: "Is my ratio good?"
Ask:
Is it increasing or decreasing?
Can we comfortably service our debt?
Why did we borrow the money?
Is that borrowing producing adequate returns?
How vulnerable would we be if revenue fell?
These questions provide much more useful information.
What Is "Good" Working Capital?
Positive working capital generally provides a short-term financial cushion. But once again, context matters.
Suppose your business has R2 million in positive working capital. That sounds excellent.
But then you discover:
R1.2 million is overdue customer debt;
R500,000 is slow-moving stock; and
only R100,000 is cash.
The quality of the working capital matters. Do not look only at the total.
Understand what creates the number.
Build a Simple Liquidity and Solvency Dashboard
You can add these three metrics to your monthly financial dashboard.
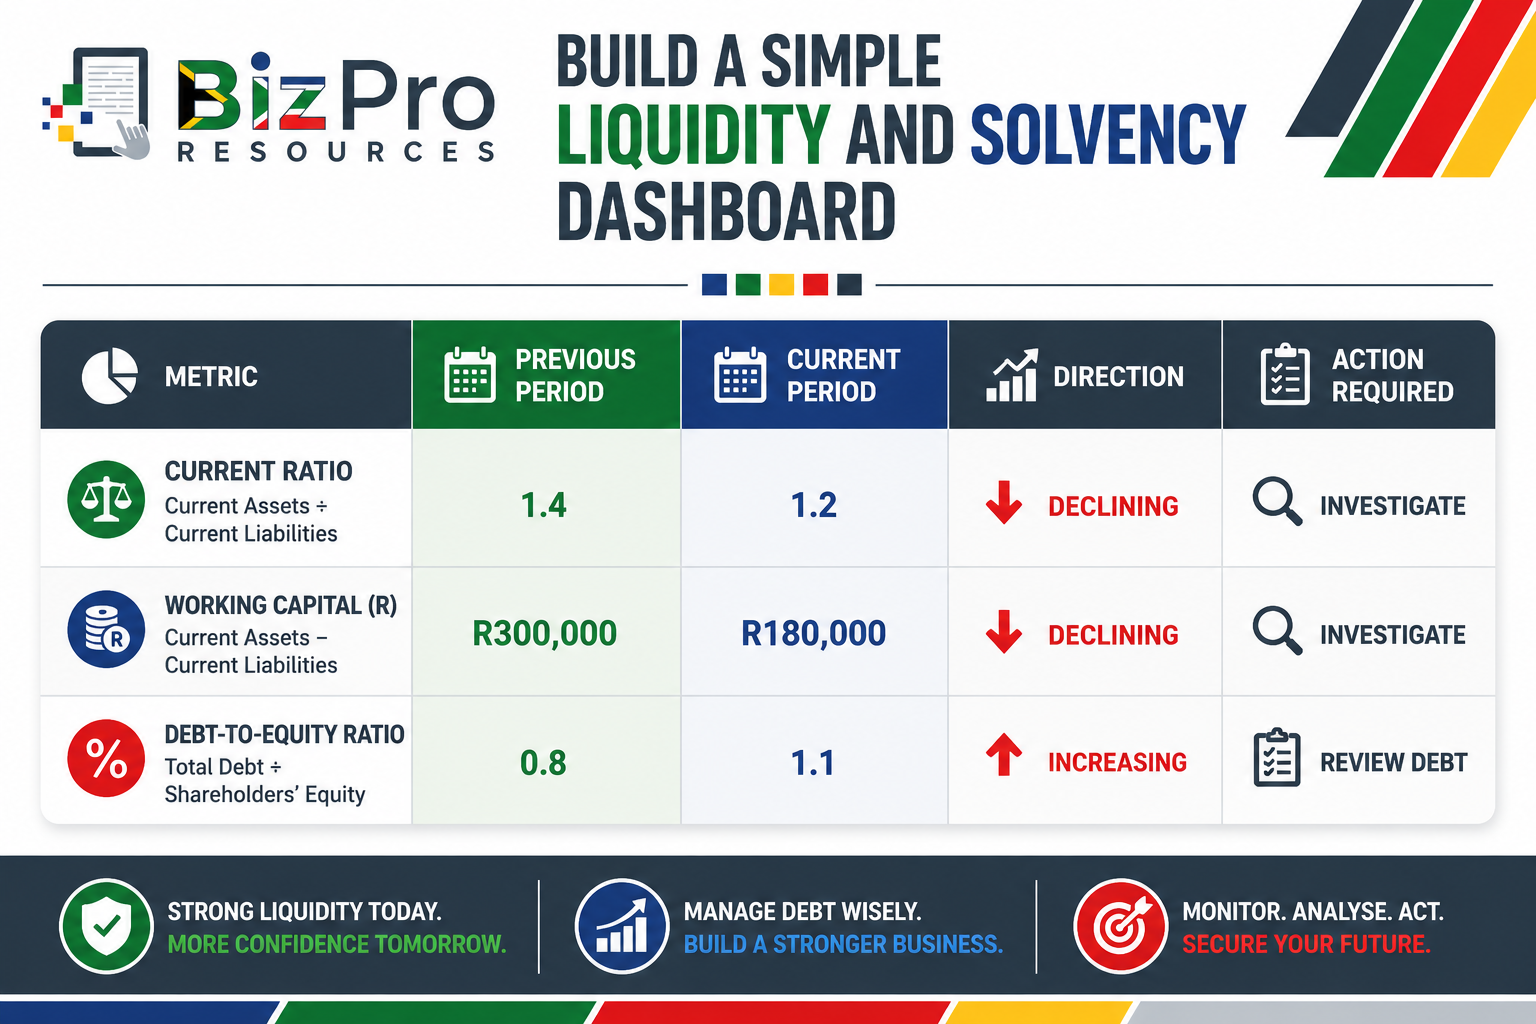
The table itself is not the important part. The discussion that follows is.
Ask:
Why did the Current Ratio fall?
Why did working capital decrease?
Why did debt increase?
There could be a number of different reasons:
Perhaps you purchased equipment.
Perhaps customers are paying slowly.
Perhaps inventory increased.
Perhaps a large supplier payment became due.
Perhaps the company borrowed money to expand.
Find the reason behind the movement.
Warning Signs Small Business Owners Should Watch
Liquidity and solvency problems rarely become easier when ignored.
Some practical warning signs can include:
regularly paying suppliers late;
relying increasingly on an overdraft;
struggling to make payroll;
borrowing money to pay normal operating expenses;
growing customer debtors;
large amounts of slow-moving stock;
rapidly increasing short-term debt;
repeatedly extending supplier payment terms;
increasing loan repayments;
declining working capital; and
a deteriorating Current Ratio.
One warning sign does not necessarily mean that the business is in serious trouble.
Several warning signs appearing together deserve attention.
How to Improve Liquidity
If liquidity is becoming a problem, there are several areas you can investigate.
Collect Customer Accounts Faster
Invoice promptly.
Follow up overdue accounts.
Make payment terms clear.
Consider deposits or progress payments where appropriate.
Manage Inventory Better
Do not unnecessarily trap cash in stock that does not sell.
Negotiate Supplier Terms
Where appropriate, better supplier payment terms can help align cash outflows with customer payments.
Improve Cash-Flow Forecasting
Know what money is expected to enter and leave the business before the payments become due.
Build Cash Reserves
Profitable periods can provide an opportunity to build a financial buffer.
Review Expenses
Identify unnecessary or poorly controlled spending.
Improve Profitability
Stronger margins can eventually contribute to stronger cash generation.
How to Manage Solvency Risk
Long-term financial health requires careful management of debt.
Consider:
how much the business borrows;
why the money is being borrowed;
interest costs;
repayment terms;
the expected return from the investment;
how debt affects cash flow; and
what happens if business conditions deteriorate.
Before taking on major debt, ask: Can we still afford the repayments if sales are lower than expected?
That question can prevent very expensive mistakes.
Do Not Wait Until There Is No Cash
One of the biggest benefits of financial metrics is early warning. Imagine the Current Ratio declines over several periods: 1.8 → 1.6 → 1.4 → 1.1 → 0.9
The business owner who monitors the ratio can start investigating before the situation becomes critical.
The owner who does not measure it may discover the problem only when there is not enough money to pay suppliers.
The same applies to working capital.
If working capital changes: R800,000 → R650,000 → R400,000 → R150,000 → −R100,000, something important is happening.
The numbers are giving you a warning.
Pay attention to it.
Use Metrics Together, Not Separately
No financial metric should be viewed in isolation.
Suppose your company has: Strong profitability but Poor liquidity. You may be making money but collecting it too slowly.
Or: Good liquidity but Very high debt. The company can pay its immediate bills, but long-term financial risk may still be significant.
Or: Low debt but Negative working capital. Debt may not be the problem at all. Perhaps customer collections or inventory management are causing short-term pressure.
This is why the different sections in our Business Performance Metrics series work together:
Profitability metrics help you understand whether the business is making money.
Liquidity metrics help you understand whether the business can meet short-term obligations.
Solvency measures help you understand longer-term financial risk.
Efficiency metrics, which we will discuss next, help you understand how effectively the business is using its resources.
Together, these measurements create a much clearer picture.
Questions to Ask at Your Monthly Management Meeting
When reviewing liquidity and solvency, consider asking:
1. What is our Current Ratio?
2. Is it improving or declining?
3. How much working capital do we have?
4. What is causing working capital to change?
5. How much cash do we have available?
6. How much do customers owe us?
7. How much of that debt is overdue?
8. How much stock are we carrying?
9. How quickly can that stock realistically be converted into cash?
10. What do we owe suppliers?
11. What loan repayments are due?
12. Is our Debt-to-Equity Ratio increasing?
13. Why are we taking on additional debt?
14. Can the business comfortably service that debt?
15. What would happen if sales fell for three months?
These are management questions.
You do not need a finance degree to ask them.
Final Thoughts
Financial health is about more than profit. A strong business also needs the ability to meet its obligations and manage its debt responsibly.
Three useful metrics can help you understand this:
Current Ratio
Current Assets ÷ Current Liabilities: It helps you assess short-term liquidity.
Debt-to-Equity Ratio
Total Debt ÷ Equity: It helps you understand how much debt the business is using relative to owners' equity.
Working Capital
Current Assets − Current Liabilities: It shows the rand difference between short-term assets and short-term obligations.
Do not simply calculate these numbers once and forget about them:
Track them.
Compare them.
Understand what is causing them to change.
Then act when necessary.
A business owner who discovers a liquidity problem early has options:
You can improve collections.
You can reduce unnecessary stock.
You can negotiate payment terms.
You can manage spending.
You can reconsider expansion.
You can restructure financing where appropriate.
You can seek professional financial advice before the situation becomes critical.
A business owner who discovers the problem only when there is no money left has far fewer options.
That is why measuring financial performance matters.
The purpose of a financial metric is not simply to tell you where your business is today.
Its greatest value may be giving you enough warning to change where your business is going tomorrow.
Related Articles in the Finance Metrics Series
Profitability Metrics: The Numbers That Show Whether Your Business Is Really Making Money
Liquidity and Solvency Metrics: Can Your Business Pay Its Bills and Manage Its Debt?
Efficiency Metrics: Is Your Business Making the Best Use of Its Assets and Inventory?
AI Disclaimer
AI Tools were used to assist with research. Remember to always cross-check everything that you read.


