
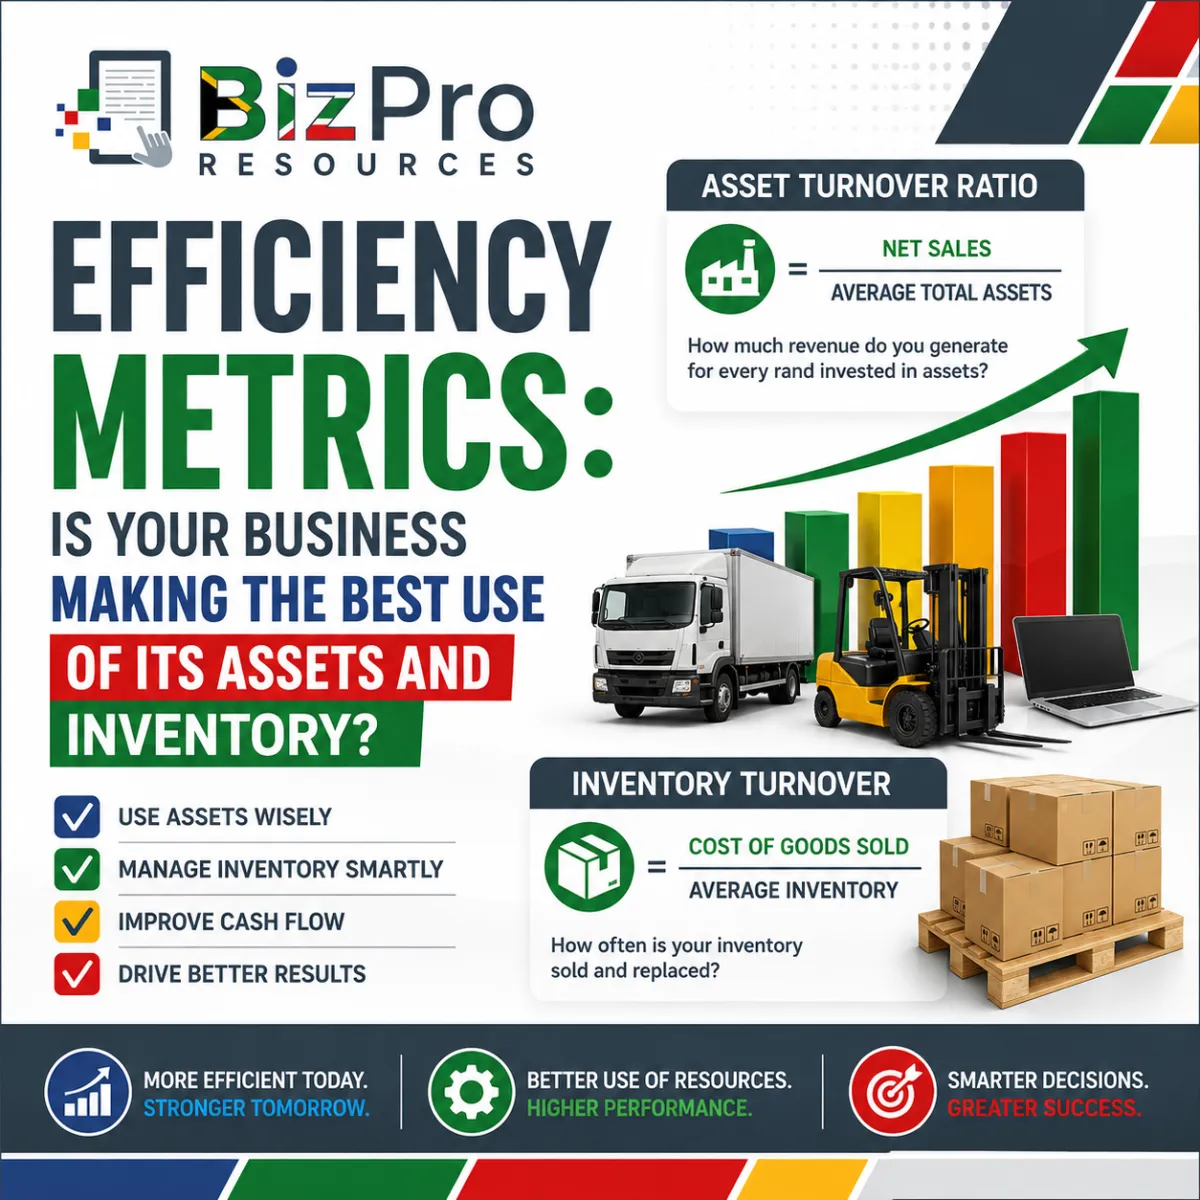
Efficiency Metrics: Is Your Business Making the Best Use of Its Assets and Inventory?
Article #3 of #3 in the FinancePerformance Metrics Series
Introduction
A business can own valuable equipment, vehicles, machinery, stock and other assets. But owning assets does not automatically mean that those assets are being used effectively.
Imagine two businesses that each own R2 million worth of assets:
The first business generates R1 million in annual sales.
The second generates R5 million.
The businesses have similar amounts invested in assets, but they are producing very different levels of revenue.
Now consider two retail businesses that each carry R500,000 worth of inventory:
The first business sells most of its stock quickly and regularly replaces it with new stock.
The second has shelves and storerooms filled with products that have been sitting there for months.
Again, the amount invested may be similar, but the efficiency is very different.
This is what efficiency metrics help us understand.
Efficiency metrics look at how effectively a business uses its resources to generate sales and support its operations.
In this article, we will focus on two important efficiency metrics:
Asset Turnover Ratio
Inventory Turnover
For each metric, we will explain:
what it means;
how it is calculated;
what poor performance can look like;
what good performance can look like; and
what the result may mean for your business.
These metrics can be particularly useful because they encourage small business owners to look beyond a simple question such as: "How much do we own?" and instead ask: "How effectively are we using what we own?"
Why Business Efficiency Matters
Small businesses usually have limited resources.
Every rand invested in:
stock;
vehicles;
machinery;
tools;
equipment;
buildings; or
other business assets
needs to work for the company.
Consider a small plumbing company with five vehicles. If all five vehicles are regularly used by productive teams completing profitable work, they may be contributing strongly to the business.
But what if two vehicles spend most of the week parked at the workshop?
The company still has to deal with costs such as:
insurance;
licensing;
depreciation;
maintenance; and
finance repayments, where applicable.
The question is therefore not only: "Do we have enough assets?"
It is also: "Are those assets being used productively?"
Efficiency metrics help answer questions like this.
Efficiency Is Not the Same as Profitability
Efficiency and profitability are connected, but they are not the same thing. A business can be efficient in one area and still be unprofitable overall. For example, a retailer might sell its inventory extremely quickly.
That sounds efficient.
But if the retailer sells products at margins that are too low, it may still struggle to make enough profit.
Similarly, a business might generate large amounts of revenue from its assets but have extremely high operating expenses.
This is why the metrics in our Business Performance Metrics series should be considered together:
Profitability metrics help answer: Are we making enough profit?
Liquidity metrics help answer: Can we meet our short-term financial obligations?
Solvency metrics help answer: Is our financial structure sustainable?
Efficiency metrics help answer: How effectively are we using our resources?
Let us begin with Asset Turnover Ratio.
1. Asset Turnover Ratio
What Is the Asset Turnover Ratio?
The Asset Turnover Ratio measures how efficiently a business uses its assets to generate sales revenue.
In simple terms, it asks: How much revenue does the business generate for every rand invested in assets?
The basic formula is: Asset Turnover Ratio = Net Sales Revenue ÷ Average Total Assets
Average total assets are commonly used because the amount of assets owned by a business can change during the year.
The ratio can help a business owner understand whether substantial investments in assets are actually supporting revenue generation.
What Are Business Assets?
An asset is a resource controlled by the business that has economic value.
Depending on the business, assets may include:
cash;
customer receivables;
inventory;
vehicles;
machinery;
equipment;
tools;
computers;
furniture;
buildings;
property; and
other resources recorded as assets.
Some businesses require large amounts of assets to operate. Others require relatively few.
This becomes very important when interpreting the Asset Turnover Ratio.
How Is the Asset Turnover Ratio Calculated?
Suppose a small manufacturing company generates: Annual Net Sales Revenue = R4,000,000
Its average total assets during the year are: Average Total Assets = R2,000,000
The calculation is:
Asset Turnover Ratio = R4,000,000 ÷ R2,000,000
Asset Turnover Ratio = 2.0
This means the company generated approximately R2 in sales for every R1 of average assets during the period.
How Do You Calculate Average Total Assets?
A common simplified calculation is: Average Total Assets = (Opening Total Assets + Closing Total Assets) ÷ 2
Suppose the company started the year with: Total Assets = R1,800,000
and ended the year with: Total Assets = R2,200,000
Average total assets would be:
(R1,800,000 + R2,200,000) ÷ 2
= R4,000,000 ÷ 2
= R2,000,000
If annual net sales were R4 million: R4,000,000 ÷ R2,000,000 = 2.0
That is the company's Asset Turnover Ratio.
What Does a Higher Asset Turnover Ratio Mean?
Generally, a higher Asset Turnover Ratio means that the company is generating more revenue relative to the assets it uses.
That can indicate greater asset efficiency.
For example:
Company A
Sales: R5 million
Average Assets: R5 million
Asset Turnover:
R5 million ÷ R5 million = 1.0
Company B
Sales: R5 million
Average Assets: R2 million
Asset Turnover:
R5 million ÷ R2 million = 2.5
Company B is generating the same revenue while using a much smaller asset base. Based only on this metric, Company B appears to be using its assets more efficiently.
But there is an important warning: A higher Asset Turnover Ratio is not automatically better in every situation.
We need context.
Example of Poor Asset Turnover Performance
Imagine a small manufacturing company owns: Average Total Assets = R4,000,000 but generates only: Annual Net Sales = R2,000,000
Its Asset Turnover Ratio is: R2,000,000 ÷ R4,000,000 = 0.5
The business generates only 50 cents of sales for every R1 of average assets. This may indicate that the company is not using its assets effectively.
Possible reasons could include:
machinery standing idle;
unused production capacity;
vehicles not being fully utilised;
expensive equipment that produces too little work;
excess inventory;
weak sales;
unnecessary assets;
poor operational planning; or
recent investment in assets that has not yet produced additional revenue.
The metric does not tell management exactly which problem exists.
It tells management: "We need to investigate whether our asset base is producing enough revenue."
What Poor Asset Efficiency Can Mean for a Company
Poor asset efficiency can have several consequences.
Money Is Tied Up
Assets require investment. If the business owns resources that are not producing enough revenue, money may be tied up unnecessarily.
Financing Costs May Be Higher
If equipment or vehicles were financed, the company may still be paying interest and instalments even when those assets are underused.
Maintenance Costs Continue
An underused asset can still require:
insurance;
servicing;
storage;
licensing; and
maintenance.
Profitability Can Suffer
If the company has too much productive capacity relative to its sales, fixed costs can place pressure on profit.
Cash Could Have Been Used Elsewhere
Money invested in unnecessary assets might have been used for:
marketing;
employee development;
debt reduction;
working capital; or
other growth opportunities.
This is why asset utilisation matters.
Example of Good Asset Turnover Performance
Suppose the same manufacturing company improves its sales and makes better use of its equipment.
Its average assets remain: R4,000,000
but annual net sales increase to: R8,000,000
The Asset Turnover Ratio becomes: R8,000,000 ÷ R4,000,000 = 2.0
The company now generates R2 of sales for every R1 of average assets.
Compared with its previous ratio of 0.5, this represents a major improvement in asset efficiency.
Perhaps management:
increased production;
won new customers;
reduced machinery downtime;
improved employee scheduling;
sold unused assets;
increased vehicle utilisation; or
improved capacity planning.
The business is now generating substantially more revenue from its asset base.
But Be Careful with a Very High Asset Turnover Ratio
A very high Asset Turnover Ratio can sometimes look impressive while hiding another problem.
Imagine a business has very few assets because it has failed to replace old equipment:
Its machines are constantly breaking.
Vehicles are unreliable.
Computers are outdated.
The asset base may be small, which can make the turnover ratio look strong. But the business may actually be underinvesting.
This could eventually cause:
production delays;
poor customer service;
higher repair costs;
safety problems;
lost sales; and
reduced productivity.
Metrics require judgment. Do not simply try to make every ratio as high as possible.
Ask whether the business has the right assets and is using them effectively.
Asset Turnover Varies by Industry
This is particularly important with the Asset Turnover Ratio. Different industries require very different amounts of assets.
Consider:
Accounting Practice
An accounting firm may need:
computers;
office equipment;
software;
furniture; and
perhaps office premises.
It may not need millions of rands in machinery.
Manufacturing Business
A manufacturer may need:
production machinery;
factory equipment;
forklifts;
vehicles;
inventory; and
buildings.
Its asset base can be much larger.
Security Company
A security company may require:
vehicles;
communication equipment;
monitoring equipment;
computers; and
specialised technology.
Plumbing Business
A plumbing business may require:
service vehicles;
tools;
specialised equipment; and
stock.
These businesses should not automatically expect the same Asset Turnover Ratio.
A useful comparison is often: Your business this year vs your business last year or: Your business vs similar businesses in your industry rather than comparing completely different industries.
Questions to Ask When Asset Turnover Is Poor
If your Asset Turnover Ratio is declining, investigate.
Ask:
Are sales falling? If the asset base has remained the same but sales are declining, the ratio will weaken.
Have we purchased significant new assets? Perhaps you recently invested in machinery or vehicles that have not yet reached full productive capacity.
Are assets sitting unused? Look for idle vehicles, equipment or property.
Do we have excess inventory? Inventory forms part of total assets and may be tying up money.
Is our production capacity being used? Perhaps machines can produce much more than current sales require.
Do we need every asset we own? Some assets may be sold, leased differently or redeployed.
Are operational problems reducing output? Breakdowns, poor scheduling and employee shortages can reduce the revenue produced by assets.
These questions turn a financial ratio into a management tool.
2. Inventory Turnover
What Is Inventory Turnover?
The second efficiency metric in this article is Inventory Turnover. This metric is particularly important for businesses that hold stock. Inventory Turnover measures how often a business sells and replaces its inventory during a particular period.
In simple terms, it asks: How quickly is our stock moving through the business?
The common formula is: Inventory Turnover = Cost of Goods Sold ÷ Average Inventory
You may also see Cost of Goods Sold referred to as COGS or cost of sales.
Why Use Cost of Goods Sold Instead of Sales Revenue?
Inventory is normally recorded at cost rather than at the selling price. Using Cost of Goods Sold therefore gives a more appropriate comparison with the cost value of inventory.
Suppose you buy an item for R500 and sell it for R800. The inventory value is based on the cost of the item, not necessarily the R800 selling price.
This is why COGS is commonly used when calculating Inventory Turnover.
How Is Inventory Turnover Calculated?
Suppose an automotive parts business has: Annual Cost of Goods Sold = R3,000,000
Average inventory during the year is: R600,000
The calculation is:
Inventory Turnover = R3,000,000 ÷ R600,000
Inventory Turnover = 5
This means the business turned over its average inventory approximately five times during the year.
How Do You Calculate Average Inventory?
A common simplified formula is: Average Inventory = (Opening Inventory + Closing Inventory) ÷ 2
Suppose the business starts the year with: Inventory = R500,000
and ends the year with: Inventory = R700,000
Average inventory is:
(R500,000 + R700,000) ÷ 2
= R1,200,000 ÷ 2
= R600,000
If Cost of Goods Sold is R3 million: R3,000,000 ÷ R600,000 = 5
Inventory Turnover is therefore approximately 5 times per year.
What Does Inventory Turnover Tell You?
Inventory costs money. When you purchase stock, cash leaves the business. You then need to sell the stock before that investment can be recovered through customer sales.
The longer stock remains unsold, the longer money can remain tied up. This can create several problems.
Inventory can:
become damaged;
become obsolete;
go out of fashion;
expire;
be stolen;
require storage;
require insurance; and
tie up working capital.
Inventory Turnover helps you understand how efficiently stock is moving.
Example of Poor Inventory Turnover Performance
Suppose a hardware business has:
Annual Cost of Goods Sold = R2,000,000
Average Inventory = R1,000,000
Inventory Turnover is: R2,000,000 ÷ R1,000,000 = 2
The business turns its average inventory approximately twice per year. Is that poor? It might be, depending on the type of inventory and the industry.
Suppose the business previously achieved turnover of 5 times per year and similar competitors generally move comparable products much faster.
A fall to 2 could indicate a problem.
Possible reasons include:
too much stock was purchased;
certain products are no longer popular;
sales have declined;
poor products were selected;
stock levels are not being managed;
old stock is accumulating;
purchasing is not aligned with customer demand; or
prices are too high.
The business should investigate.
What Poor Inventory Turnover Can Mean
Cash Is Trapped in Stock
Imagine R500,000 worth of products sitting in a storeroom for months.
That R500,000 cannot easily be used to:
pay salaries;
pay suppliers;
reduce debt;
fund marketing; or
buy faster-selling products.
Storage Costs Increase
More inventory may require more storage space.
Risk of Damage or Theft Increases
The longer goods remain in storage, the greater the exposure can become.
Products May Become Obsolete
This is especially important for:
technology;
electronics;
fashion;
certain vehicle parts;
seasonal products; and
products with changing specifications.
Working Capital Comes Under Pressure
Excess inventory can make a business look asset-rich while leaving it short of cash.
This connects directly with the Working Capital discussion in our previous article.
Example of Good Inventory Turnover Performance
Suppose the hardware business improves stock management.
It now has:
Annual Cost of Goods Sold = R3,600,000
Average Inventory = R600,000
Inventory Turnover becomes: R3,600,000 ÷ R600,000 = 6
The business now turns its average inventory approximately six times per year.
This may indicate that:
stock is selling faster;
purchasing better matches customer demand;
less money is trapped in inventory;
slow-moving items have been reduced; and
inventory management has improved.
If the business can achieve this without regularly running out of important products, this could represent a much more efficient inventory position.
A High Inventory Turnover Is Not Always Good
This is another example of why metrics need context. Imagine your Inventory Turnover becomes extremely high because you keep very little stock. That might appear efficient.
But customers repeatedly hear: "Sorry, we don't have that item."
Now the business may lose sales.
Customers may start buying from competitors.
Employees may spend time dealing with stock shortages.
Emergency orders may increase delivery costs.
So the goal is not: "Keep as little inventory as possible."
The goal is: "Hold enough of the right inventory to meet customer demand without unnecessarily tying up cash."
That is a much better management objective.
Inventory Turnover and Days Inventory Outstanding
Some business owners find it easier to think about inventory in terms of days. A related calculation can estimate approximately how many days inventory remains on hand.
A simple formula is: Days Inventory Outstanding = 365 ÷ Inventory Turnover
Suppose Inventory Turnover is: 5
Then: 365 ÷ 5 = 73 days
This suggests that average inventory is held for approximately 73 days under the simplified calculation.
If Inventory Turnover increases to: 10
then: 365 ÷ 10 = 36.5 days
Inventory is moving much faster. This can make the concept easier to understand.
Instead of saying: "Our turnover is 5."
you can think: "On average, inventory represents roughly 73 days of stock movement under this calculation."
Example: Why Slow-Moving Stock Matters
Imagine an electrical wholesaler has R800,000 in inventory.
Management discovers:
R300,000 is fast-moving stock.
R200,000 sells reasonably regularly.
R150,000 moves slowly.
R150,000 has barely sold during the past year.
The total inventory number does not tell the full story. The business needs to understand which products are moving.
This could lead to actions such as:
reducing future orders of slow-moving items;
negotiating returns with suppliers where possible;
discounting obsolete stock;
bundling slow-moving products;
improving stock forecasting; or
focusing purchasing on products customers actually want.
A business can improve inventory efficiency not only by selling more but also by buying more intelligently.
Inventory Turnover for Service Businesses
Not every business carries significant inventory:
An accounting firm may have almost no stock.
A legal practice may have almost no inventory.
A consulting company may not find Inventory Turnover particularly useful.
On the other hand, it can be extremely important for:
retailers;
wholesalers;
manufacturers;
motor workshops;
automotive parts businesses;
hardware stores;
restaurants;
construction suppliers;
plumbing suppliers;
electrical suppliers; and
other stock-based businesses.
One of the most important lessons from our Business Performance Metrics series is: Not every metric applies equally to every business.
Choose metrics that help you manage your business.
Asset Turnover and Inventory Turnover Work Together
Inventory is an asset. This means inefficient inventory management can also affect overall asset efficiency.
Suppose a business has: Total Assets = R3 million and Inventory = R1.2 million
If a large portion of that stock barely sells, the business has a substantial amount of its asset base tied up in an unproductive resource.
This can contribute to:
poor Inventory Turnover;
poor Asset Turnover;
weaker working capital;
cash-flow pressure; and
lower profitability.
One problem can therefore affect several metrics.
This is why financial measurements become much more useful when viewed together.
A Practical Example: Two Retail Businesses
Consider two South African retailers.
Both generate: Annual Sales = R6 million At first glance, their performance looks identical. But look deeper.
Retailer A:
Average Total Assets: R4 million
Asset Turnover: R6 million ÷ R4 million = 1.5
Cost of Goods Sold: R4 million
Average Inventory: R1 million
Inventory Turnover: R4 million ÷ R1 million = 4
Retailer B:
Average Total Assets: R2.5 million
Asset Turnover: R6 million ÷ R2.5 million = 2.4
Cost of Goods Sold: R4 million
Average Inventory: R500,000
Inventory Turnover: R4 million ÷ R500,000 = 8
Both businesses generate R6 million in sales. But Retailer B generates those sales using a smaller asset base and less average inventory. Based on these two efficiency metrics alone, Retailer B appears to use its resources more efficiently.
But we still need to investigate other measures:
Perhaps Retailer B regularly experiences stock shortages.
Perhaps Retailer A owns its property while Retailer B rents.
Perhaps their profit margins are different.
Metrics provide clues.
They do not provide the entire story.
Poor Efficiency Can Hide Inside a Growing Business
Growth can sometimes hide inefficiency.
Imagine sales increase:
Year 1: R3 million
Year 2: R4 million
Year 3: R5 million
Excellent.
But total assets increase:
Year 1: R1.5 million
Year 2: R2.5 million
Year 3: R4 million
Asset Turnover changes:
Year 1: R3 million ÷ R1.5 million = 2.0
Year 2: R4 million ÷ R2.5 million = 1.6
Year 3: R5 million ÷ R4 million = 1.25
Sales are growing. But asset efficiency is declining. The company requires increasingly more assets to generate each rand of sales.
That deserves investigation.
Perhaps this is temporary because the business is investing ahead of future growth. Or perhaps the company is becoming inefficient.
Without measuring the ratio, management may not notice.
Good Efficiency Can Improve Cash Flow
Efficiency is not only about making your financial ratios look better. It can have a practical effect on cash. Consider inventory.
If a business reduces unnecessary average inventory from: R1,000,000 to R700,000 while maintaining customer service and sales, it may free up a significant amount of cash over time, depending on how purchases and sales occur.
That cash can potentially be used for:
working capital;
paying suppliers;
reducing borrowing;
buying productive equipment;
marketing;
expansion; or
building reserves.
Efficiency helps you get more value from the resources already inside the business.
Build a Simple Efficiency Dashboard
You can add these metrics to your Business Performance Metrics dashboard.
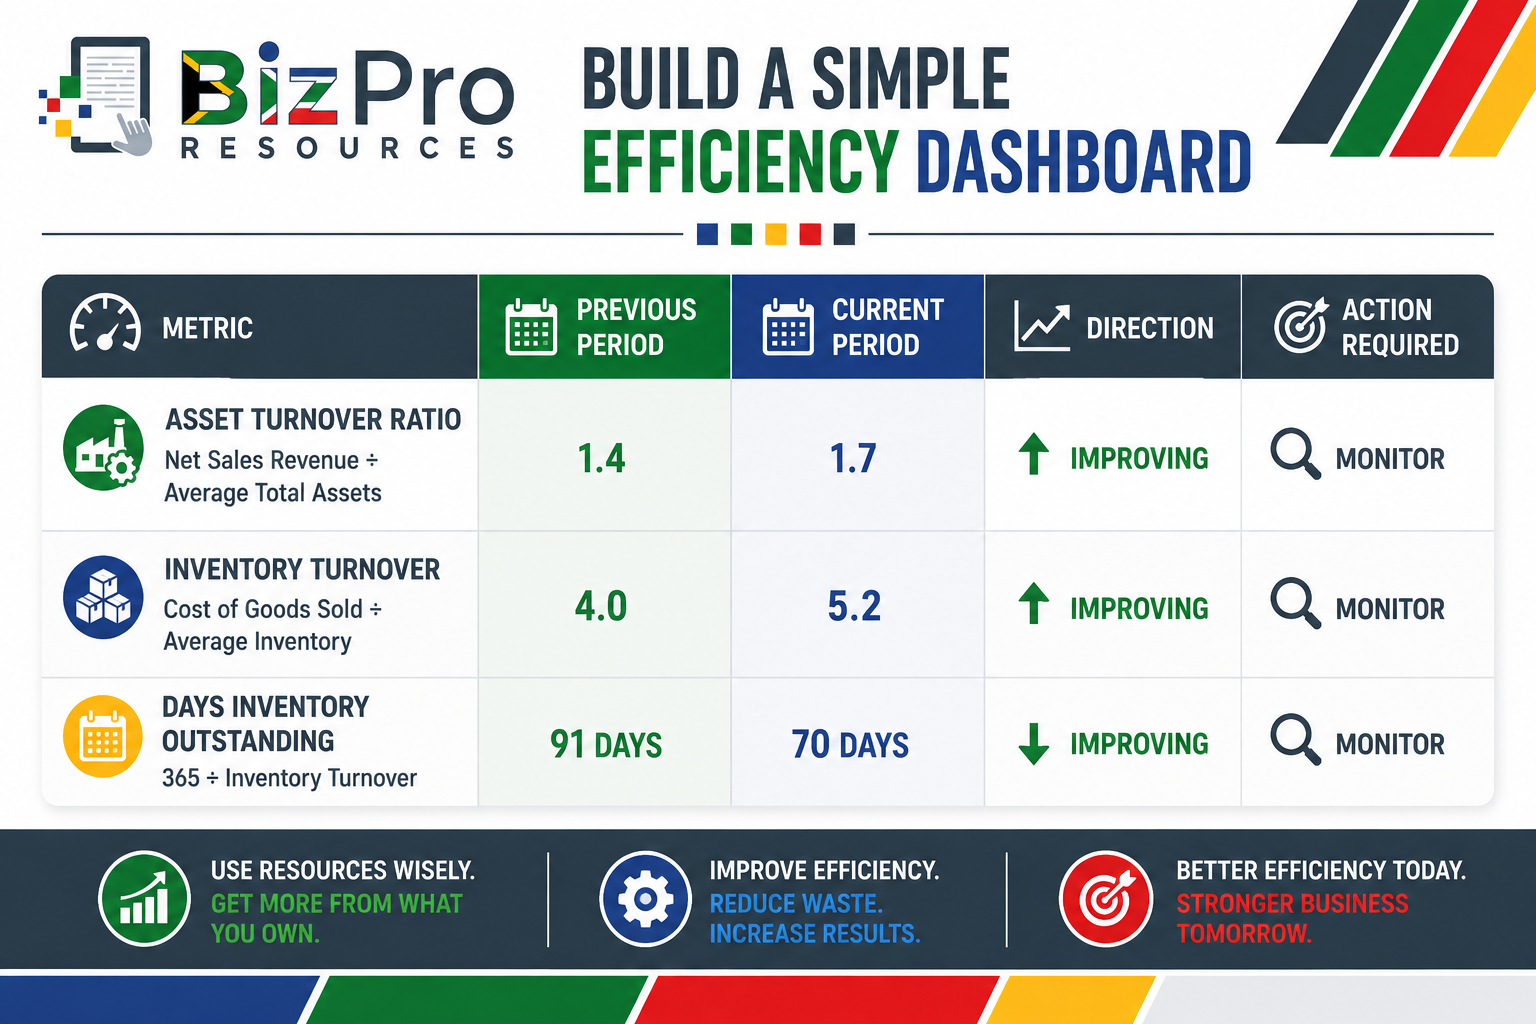
Do not stop at the table.
Ask:
Why did Asset Turnover improve? Perhaps sales increased without requiring major new assets.
Why did Inventory Turnover improve? Perhaps stock management became better.
Why did Days Inventory Outstanding decrease? Perhaps slow-moving products were reduced.
Now ask the most important question: Did these improvements also support profitability, cash flow and customer service?
If yes, the business may genuinely be becoming more efficient.
What Should You Compare Your Efficiency Metrics Against?
There is no universal Asset Turnover Ratio or Inventory Turnover figure that is correct for every business.
Use meaningful comparisons.
Compare with Previous Periods: Is the ratio improving or declining?
Compare with Your Budget: Did actual efficiency match what you expected?
Compare with Your Targets: Are management improvements producing results?
Compare with Similar Businesses: Where reliable industry information is available, compare yourself with businesses that operate in a similar way.
Do not compare a consulting company with a supermarket and expect the ratios to mean the same thing.
Common Asset Efficiency Problems to Investigate
If your Asset Turnover Ratio is weaker than expected, look for:
unused vehicles;
idle machinery;
excess production capacity;
empty or underused property;
excessive inventory;
outdated equipment;
weak sales;
unnecessary assets;
poor scheduling; and
operational downtime.
The solution depends on the cause.
You might need to:
increase sales;
sell unused assets;
improve scheduling;
reduce downtime;
improve maintenance;
increase productive capacity utilisation; or
reconsider future asset purchases.
Common Inventory Efficiency Problems to Investigate
If Inventory Turnover is poor, look for:
slow-moving products;
obsolete stock;
over-ordering;
weak demand forecasting;
excessive product ranges;
falling sales;
poor purchasing decisions;
incorrect pricing;
poor stock records; and
seasonal stock that was not sold.
Possible actions could include:
reducing order quantities;
improving stock forecasting;
identifying slow-moving products earlier;
negotiating better supplier arrangements;
reviewing pricing;
clearing obsolete stock;
improving marketing for appropriate products; and
setting minimum and maximum stock levels.
Do Not Improve Efficiency by Damaging the Business
Efficiency targets can create problems if they are managed badly.
Suppose management tells a warehouse manager: "Reduce inventory by 50%."
The manager does exactly that.
Inventory Turnover improves dramatically. But now important products are constantly out of stock. Sales fall. Customers become frustrated.
The metric improved. The business became worse.
Or suppose management sells two service vehicles because Asset Turnover appears too low. The remaining teams now cannot reach customers quickly enough.
Jobs are delayed. Customer complaints increase.
Again:
The metric improved.
The business became worse.
This is why business performance metrics should guide decisions rather than control them blindly.
Always consider the wider business impact.
Efficiency Should Support the Customer
One useful way to think about efficiency is: Remove waste without removing value.
Customers do not benefit because you own unnecessary stock. They benefit because the product they need is available when they need it. Customers do not benefit because three unused vehicles are parked outside your office.
They benefit because a technician can reach them when required. Customers do not care how impressive your machinery looks.
They care whether you can produce the right product:
at the right quality;
at the right price; and
at the right time.
Good efficiency helps the business deliver customer value while using resources responsibly.
Questions to Ask at Your Monthly Management Meeting
When reviewing efficiency, consider asking:
1. What is our Asset Turnover Ratio?
2. Is it improving or declining?
3. Have we purchased significant new assets?
4. Are those assets producing the expected additional revenue?
5. Which assets are underused?
6. Are vehicles, equipment or machinery standing idle?
7. Do we own assets that the business no longer needs?
8. How much inventory are we carrying?
9. What is our Inventory Turnover?
10. Is inventory moving faster or slower than before?
11. Which products are slow-moving?
12. Which products have not sold for several months?
13. Are we regularly running out of fast-moving stock?
14. Is too much cash tied up in inventory?
15. Can we improve efficiency without damaging customer service?
These questions turn ratios into practical business management.
Use Efficiency Metrics with the Other Financial Metrics
We have now discussed three important areas of financial performance.
Profitability Metrics
These help you understand whether the business is generating profit and financial returns.
They include measurements such as:
Gross Profit Margin;
Net Profit Margin;
Return on Equity;
Sales Revenue;
Net Cash Flow; and
Net Burn Rate.
Liquidity and Solvency Metrics
These help you understand short-term financial strength and debt risk.
They include:
Current Ratio;
Debt-to-Equity Ratio; and
Working Capital.
Efficiency Metrics
These help you understand how effectively resources are being used.
They include:
Asset Turnover Ratio; and
Inventory Turnover.
Together, these measurements give you a much more useful picture of financial performance.
For example: Sales Revenue is increasing. Good.
But: Gross Profit Margin is falling. Investigate.
Inventory Turnover is falling. Investigate further.
Working Capital is becoming weaker. Now a possible story starts to appear.
Perhaps the business is generating more sales but carrying too much inventory and earning weaker margins.
One metric alone would not have shown this clearly.
Together, the metrics tell a story.
The Goal Is Better Use of Your Resources
Small businesses cannot afford to waste resources:
Every vehicle matters.
Every machine matters.
Every rand of stock matters.
Every piece of equipment matters.
Every rand invested in the business needs to contribute towards building a stronger company.
Asset Turnover helps you ask: Are our assets producing enough revenue?
Inventory Turnover helps you ask: Is our stock moving efficiently, or is cash sitting on our shelves?
Those are simple questions.
But they can lead to powerful management decisions.
Final Thoughts
Efficiency is not about forcing employees to work faster or cutting every possible cost. Good business efficiency means using resources intelligently.
You want:
productive assets;
appropriate capacity;
enough stock;
less waste;
fewer unnecessary resources;
better use of working capital; and
strong customer service.
Two useful metrics can help you measure this.
Asset Turnover Ratio
Net Sales Revenue ÷ Average Total Assets
This helps you understand how much sales revenue the business generates relative to its asset base.
Inventory Turnover
Cost of Goods Sold ÷ Average Inventory
This helps you understand how frequently your average inventory is sold and replaced during a period.
Neither metric should be judged in isolation. Compare your results over time. Compare them with appropriate targets and industry information where available.
Then investigate the reason behind changes:
If Asset Turnover falls, ask why.
If Inventory Turnover slows, ask why.
If either ratio improves, understand what caused the improvement so that good practices can continue.
Most importantly, remember why we are measuring these numbers in the first place:
The objective is not to produce another spreadsheet.
The objective is to make better decisions.
Your business has limited resources.
Efficiency metrics help you understand whether those resources are working as hard for your business as your business is working for them.
Related Articles in the Finance Metrics Series
Profitability Metrics: The Numbers That Show Whether Your Business Is Really Making Money
Liquidity and Solvency Metrics: Can Your Business Pay Its Bills and Manage Its Debt?
Efficiency Metrics: Is Your Business Making the Best Use of Its Assets and Inventory?
AI Disclaimer
AI Tools were used to assist with research. Remember to always cross-check everything that you read.


