
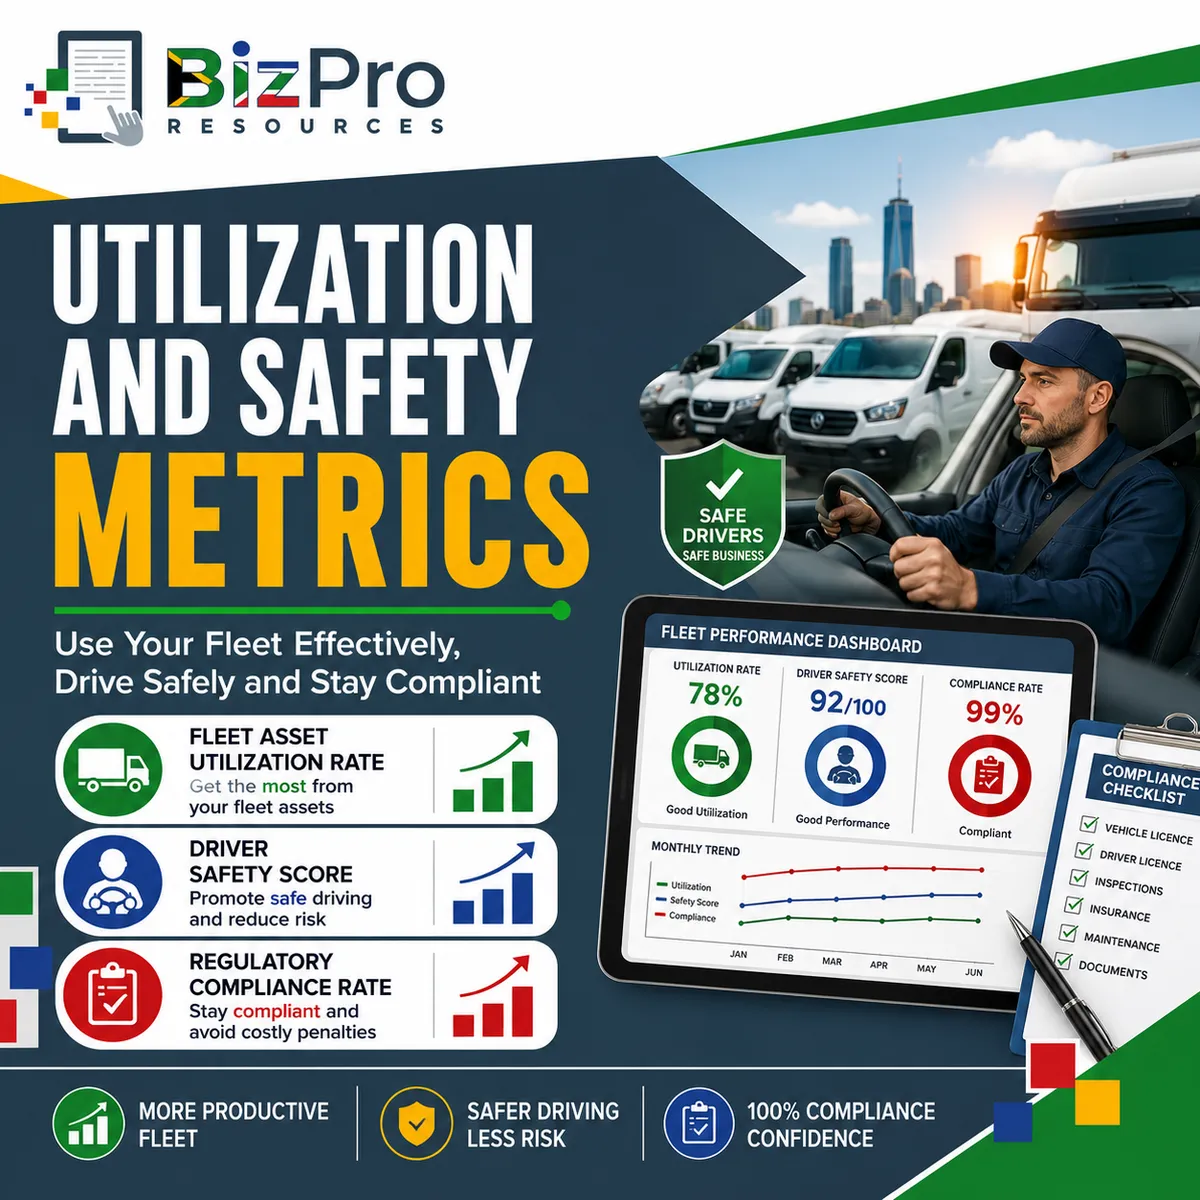
Fleet Utilization and Safety Metrics: Measuring Vehicle Use, Driver Safety and Compliance
Article #3 of #3 in the Fleet Management Metrics Series
Introduction
A business can control fuel costs and maintain its vehicles properly, but that does not automatically mean the fleet is being managed effectively.
Management also needs to know:
Are we actually using the vehicles we own?
Are our drivers operating those vehicles safely?
Are our vehicles, drivers and fleet operations meeting the required legal and regulatory requirements?
These questions move fleet management beyond simply measuring costs and maintenance.
They focus on three important areas:
Fleet Asset Utilization Rate
Driver Safety Score
Regulatory Compliance Rate
Together, these metrics help management understand whether the fleet is productive, safe and compliant.
This is particularly important for South African small and medium-sized businesses.
A fleet may represent a substantial investment. Every vehicle requires capital, insurance, licensing, maintenance and administration. At the same time, unsafe driving can result in accidents, injuries, vehicle damage and reputational harm, while regulatory failures can expose the company to fines, operational disruption and other consequences.
Good fleet management therefore requires balance. The objective is not simply to use vehicles as much as possible.
It is to use the right number of vehicles efficiently, safely and legally.
1. Fleet Asset Utilization Rate
What Is Fleet Asset Utilization?
Fleet Asset Utilization Rate measures how effectively the vehicles in a fleet are being used. A business may own 20 vehicles, but that does not necessarily mean all 20 are required.
Some vehicles may:
Travel every day
Spend most of the week parked
Be assigned to employees who rarely need them
Be kept as backup vehicles
Be unavailable because of maintenance
Be used only during busy periods
Perform work that could be completed by fewer vehicles
Utilization helps management identify the difference between owning a vehicle and productively using a vehicle. This matters because an underutilised vehicle still costs money.
Even while parked, the business may continue paying for:
Finance
Insurance
Licensing
Depreciation
Tracking systems
Administration
Scheduled maintenance
A vehicle therefore does not have to travel many kilometres to cost the company money.
How Is Fleet Asset Utilization Rate Calculated?
There are several ways to calculate vehicle utilization. The most appropriate method depends on the type of fleet and the work performed.
One simple method is based on days used: Fleet Asset Utilization Rate = Actual Days Used ÷ Available Working Days × 100
Suppose a service vehicle is available for 22 working days during the month:
It is actually used for productive work on 18 days
The calculation is: 18 ÷ 22 × 100 = 81.8%
The vehicle's utilization rate is approximately: 82%
This means the vehicle was productively used on approximately 82% of the days it was available.
Calculating Utilization Using Hours
Some businesses may find operating hours more useful.
The formula becomes: Utilization Rate = Productive Operating Hours ÷ Available Operating Hours × 100
Suppose a vehicle could have been productively used for 180 hours during the month.
It was actually used for 126 hours
The calculation is: 126 ÷ 180 × 100 = 70%
The utilization rate is: 70%
Utilization Can Also Be Measured Using Kilometres
Another approach is to compare actual kilometres travelled with a reasonable productive target.
For example: Utilization Rate = Actual Productive Kilometres ÷ Target Productive Kilometres × 100
Suppose a delivery vehicle is expected to complete approximately 4,000 productive kilometres per month:
It completes: 3,200 km
The calculation is: 3,200 ÷ 4,000 × 100 = 80%
This method can be useful, but it must be applied carefully.
More kilometres do not automatically mean better performance.
A vehicle travelling unnecessary kilometres because of poor route planning may appear highly utilised while actually wasting fuel and driver time.
For this reason, productive hours or productive days are often easier to interpret.
Define What "Productive Use" Means
Before calculating utilization, management should define what counts as productive use.
For example, productive use could include:
Travelling to customers
Completing deliveries
Transporting employees to jobs
Transporting equipment
Responding to service calls
Performing operational patrols
Completing authorised business travel
It may exclude:
Unnecessary personal travel
Excessive idling
Unauthorised trips
Time parked at the office
Time unavailable because of avoidable breakdowns
Without a clear definition, utilization data can become misleading.
Example of Poor Fleet Asset Utilization
Imagine an accounting and business services company owns 10 company vehicles.
Management reviews usage over three months.
It discovers:
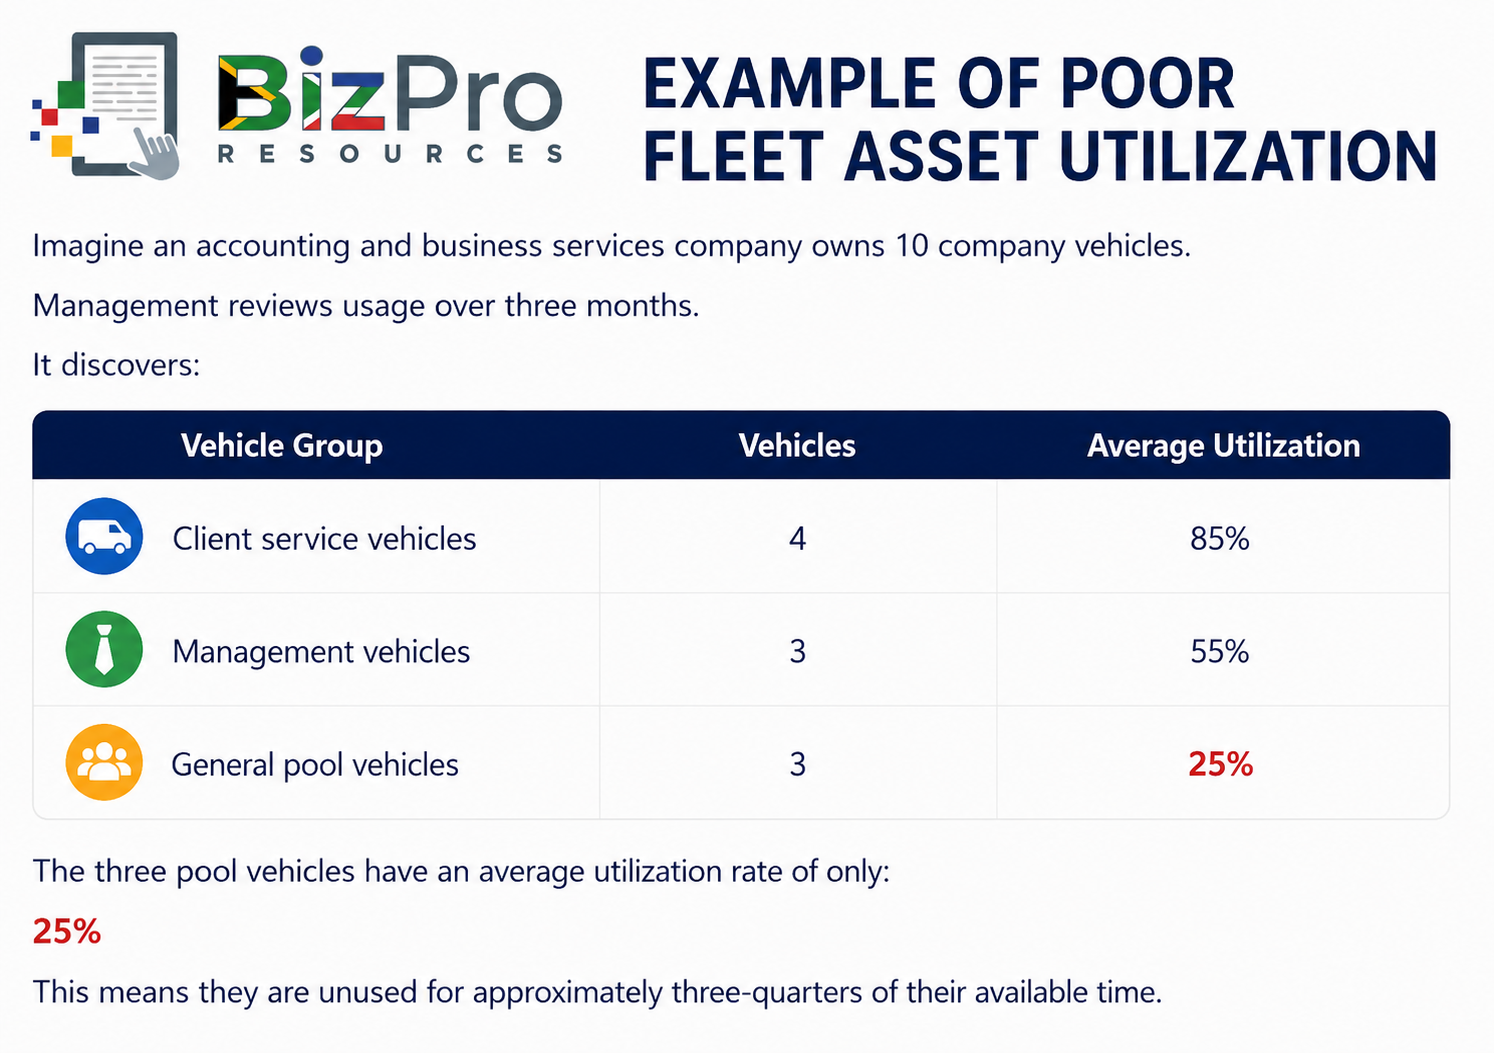
The three pool vehicles have an average utilization rate of only: 25%
This means they are unused for approximately three-quarters of their available time.
Yet the business continues paying:
Insurance
Licensing
Depreciation
Tracking fees
Maintenance
Finance costs where applicable
What Does This Mean for the Company?
The company may have more vehicles than it needs.
Management should investigate questions such as:
Do we need all three pool vehicles?
Could two vehicles perform the same work?
Could employees share vehicles more effectively?
Would occasional vehicle rental be cheaper?
Could one vehicle be transferred to another branch?
Should an underutilised vehicle be sold?
Low utilization can indicate capital tied up in unproductive assets.
The Financial Cost of Underutilization
Suppose one underutilised vehicle costs the company approximately R9,000 per month in finance, insurance, depreciation, tracking and other fixed costs.
But the vehicle is productively used only 5 days out of 20 available working days
Its utilization rate is 5 ÷ 20 × 100 = 25%
The company is paying approximately R108,000 per year in fixed ownership-related costs for an asset that spends most of its available time unused.
If the fleet contains several vehicles like this, the financial impact can become significant.
Example of Good Fleet Asset Utilization
Management restructures the pool fleet. One unnecessary vehicle is sold, and the remaining two are managed through a booking system.
The two remaining vehicles now achieve average utilization of: 75%
Employees still have access to transport when required, but the company no longer carries the cost of the unnecessary third vehicle.
What Does This Mean for the Company?
Improved utilization can result in:
Lower fleet ownership costs
Better use of capital
Fewer unnecessary vehicles
Reduced insurance costs
Lower depreciation exposure
Better visibility of fleet requirements
However, management should not automatically aim for 100% utilization.
A fleet operating at maximum capacity all the time may have no flexibility for:
Emergencies
Unexpected customer demand
Maintenance
Breakdowns
Seasonal peaks
The objective is therefore appropriate utilization, not maximum utilization at any cost.
2. Driver Safety Score
What Is a Driver Safety Score?
Vehicles do not operate themselves.
Driver behaviour has a direct effect on:
Accident risk
Fuel consumption
Vehicle wear
Maintenance costs
Tyre life
Insurance claims
Company reputation
A Driver Safety Score combines selected driving-behaviour measures into a score that helps management identify safer and higher-risk driving patterns.
Modern telematics and vehicle tracking systems can often monitor behaviours such as:
Speeding
Harsh braking
Harsh acceleration
Harsh cornering
Excessive speed
Seatbelt use, where supported
Driver fatigue indicators, where available
Distracted-driving indicators, where available
After-hours or unauthorised vehicle use
Businesses may also include:
Accidents
Traffic violations
Vehicle inspection compliance
Driver training completion
Customer or public complaints
There is no single universal Driver Safety Score formula used by every fleet.
The business or telematics provider needs to define the calculation clearly.
How Is a Driver Safety Score Calculated?
A simple company-designed system might begin with 100 points and deduct points for unsafe events.
For example:
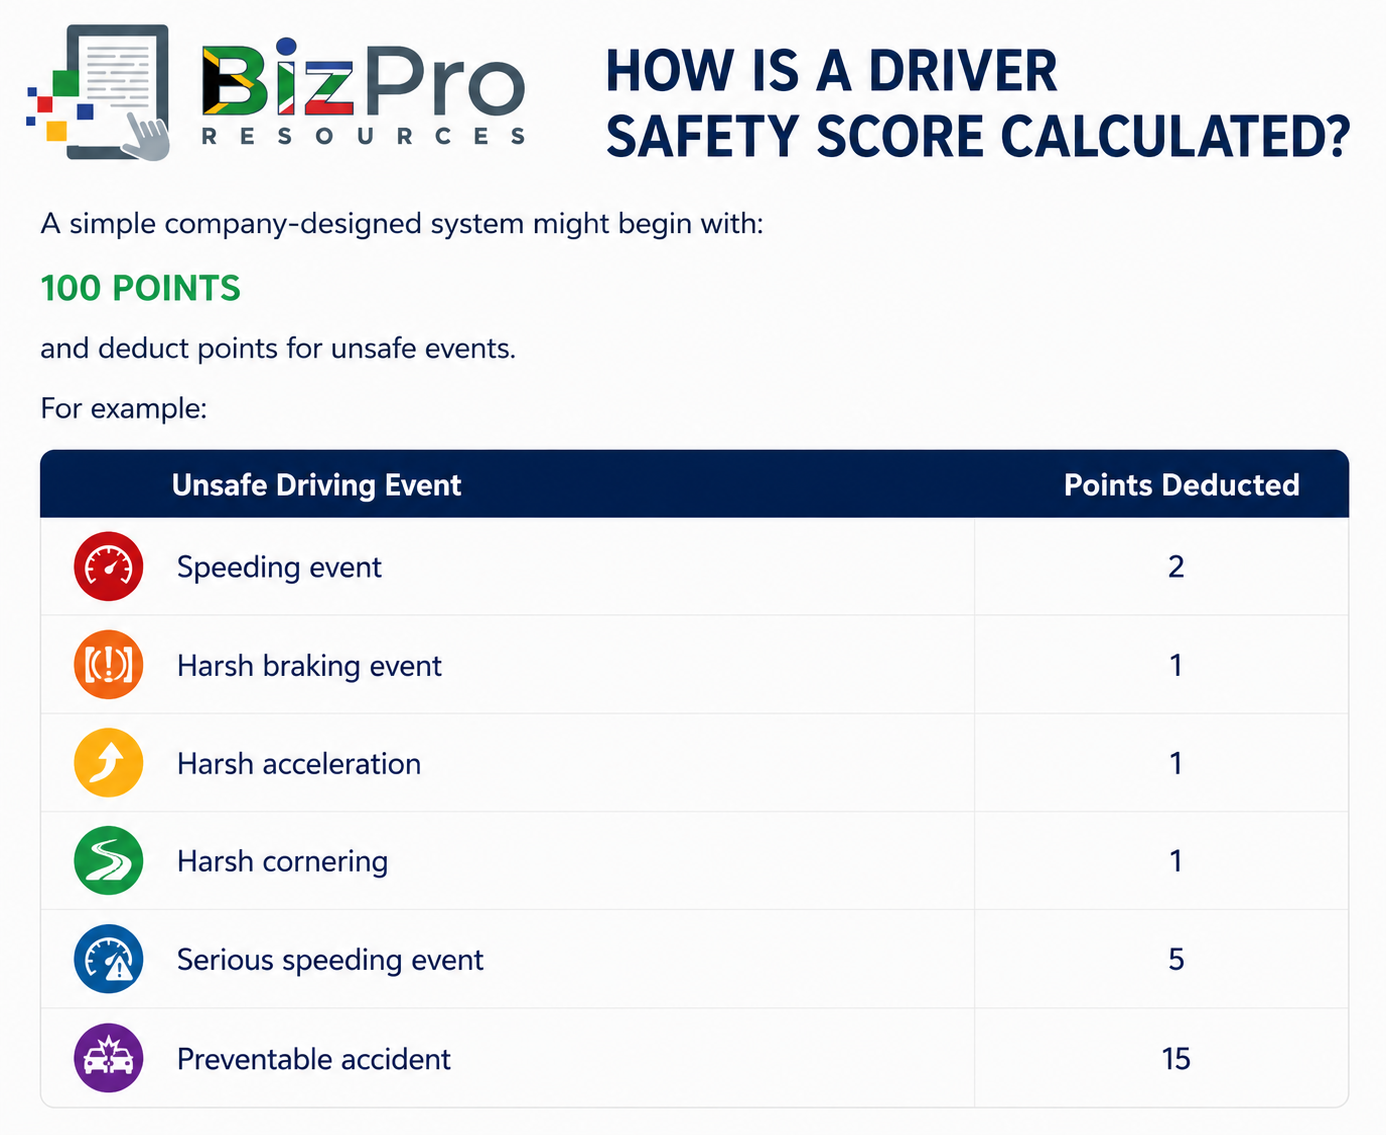
Suppose a driver starts the month with: 100 points
During the month, the driver records:
3 speeding events = minus 6 points
4 harsh braking events = minus 4 points
2 harsh acceleration events = minus 2 points
Total deductions: 12 points
Driver Safety Score: 100 − 12 = 88
The driver's score is: 88/100
The company could then establish categories such as:
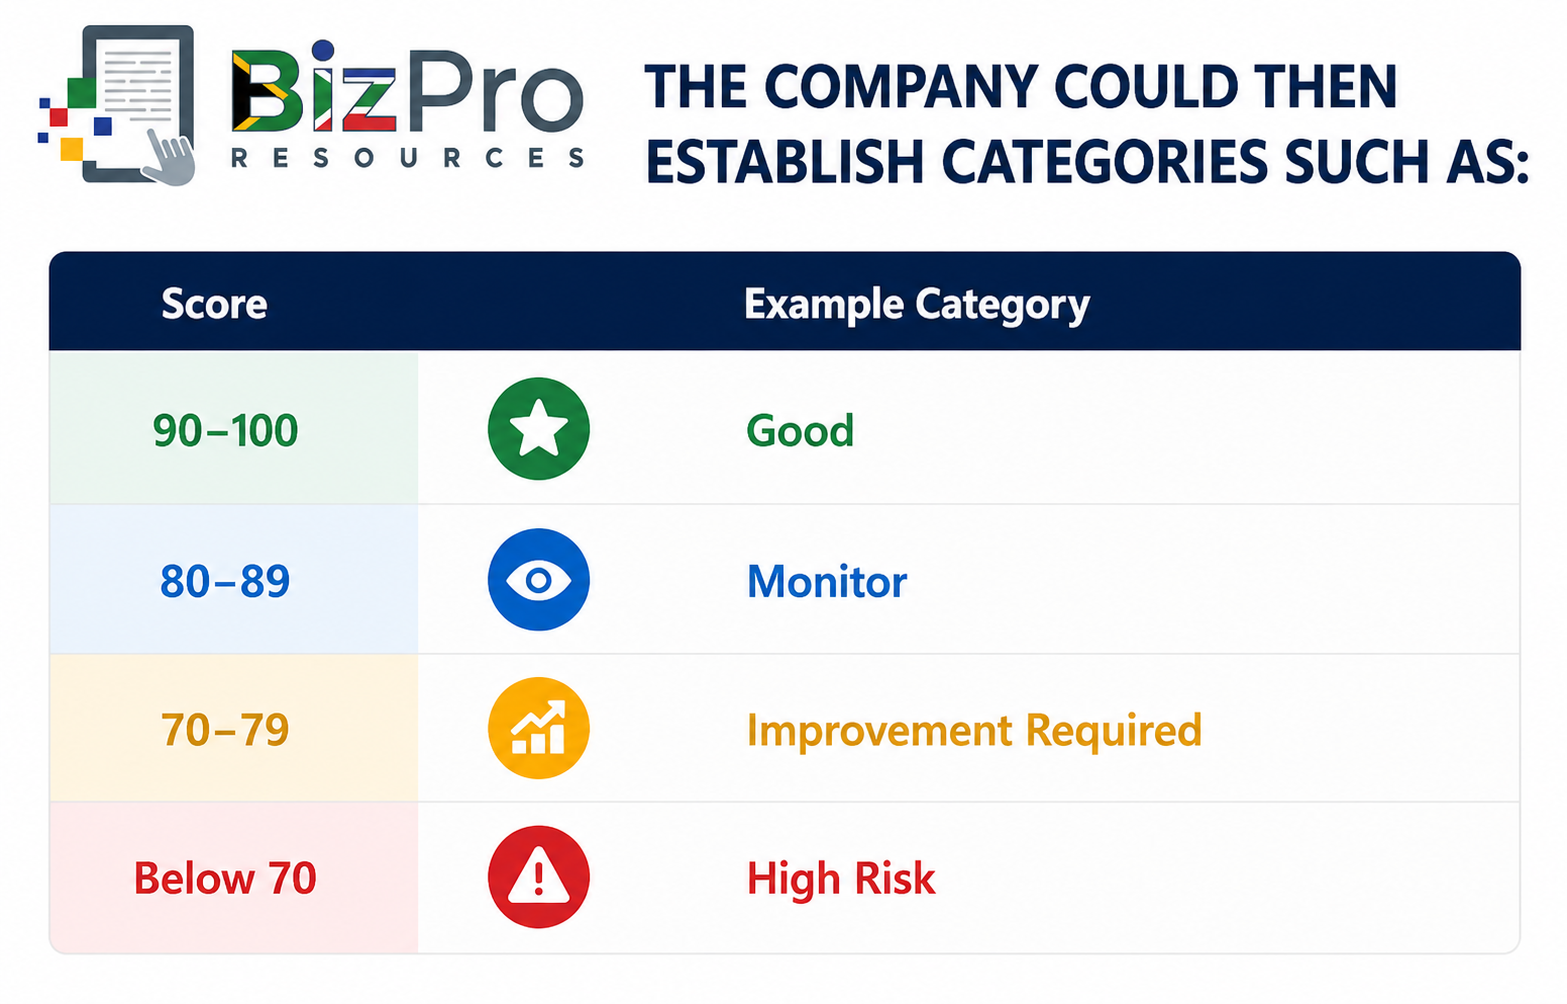
These are only example categories. Each business should establish appropriate scoring rules for its fleet and operating environment.
Normalise Safety Data Where Possible
Raw event counts can sometimes be unfair. Consider two drivers:
Driver A travels 1,000 km and records 5 harsh braking events.
Driver B travels 5,000 km and records 10 harsh braking events.
Driver B has twice as many events, but also travels five times further.
Management may therefore calculate safety events per 1,000 kilometres:
For Driver A: 5 ÷ 1,000 × 1,000 = 5 events per 1,000 km
For Driver B: 10 ÷ 5,000 × 1,000 = 2 events per 1,000 km
When exposure is considered, Driver B may actually have the better result.
This makes comparisons between drivers more meaningful.
Example of Poor Driver Safety Performance
Imagine a security company monitors a response driver.
During one month, the driver records:
18 speeding events
12 harsh braking events
9 harsh acceleration events
6 harsh cornering events
The company's scoring system produces a safety score of 62/100.
Other drivers performing similar work average 89/100.
What Does This Mean for the Company?
The low score suggests that the driver's behaviour requires investigation.
Possible risks include:
Increased accident risk
Increased tyre wear
Higher brake wear
Higher fuel consumption
Vehicle damage
Insurance claims
Injury to the driver or others
Reputational damage
Management should not simply assume that every event is the driver's fault.
Operational context matters. For example, security response drivers may sometimes operate differently from ordinary delivery drivers.
Management should compare drivers performing similar work under similar conditions.
However, a consistently poor score is a warning sign that should not be ignored.
Responding to a Poor Driver Safety Score
A poor score should trigger investigation and improvement.
Management could:
Review telematics data
Discuss the results with the driver
Identify recurring behaviours
Provide defensive-driving training
Review route and scheduling pressure
Set improvement targets
Monitor progress
Apply disciplinary procedures where serious or repeated misconduct occurs
The objective should be to improve safety, not simply collect scores.
Example of Good Driver Safety Performance
Suppose the driver receives coaching and training. Management also discovers that unrealistic response schedules were contributing to speeding.
The company improves dispatch planning and reinforces safe-driving requirements.
Three months later, the driver records:
3 minor speeding events
2 harsh braking events
1 harsh acceleration event
No preventable accidents
The driver's score improves from: 62 to 94
What Does This Mean for the Company?
The improvement may indicate:
Safer driving behaviour
Reduced accident exposure
Lower vehicle wear
Better fuel efficiency
Lower risk of damage
Improved driver awareness
The company has turned safety data into practical improvement.
Do Not Use Driver Safety Scores as the Only Safety Measure
A high safety score does not guarantee that a driver is completely safe. Telematics systems cannot always measure every risk.
For example, depending on the technology being used, they may not reliably detect:
Driver distraction
Mobile phone use
Fatigue
Poor judgement
Unsafe following distance
Dangerous behaviour outside monitored events
Driver Safety Scores should therefore support a wider fleet safety programme that includes:
Driver training
Licence checks
Vehicle inspections
Accident investigations
Safety policies
Supervision
Driver communication
3. Regulatory Compliance Rate
What Is Regulatory Compliance Rate?
Fleet operations are subject to various legal, safety, licensing and administrative requirements.
The exact requirements depend on:
Vehicle type
Business activity
Driver
Load
Route
Industry
Applicable South African legislation and regulations
Fleet Regulatory Compliance Rate measures the percentage of required compliance items that have been successfully completed or remain valid.
The metric helps management answer: Are our vehicles and drivers meeting the compliance requirements that apply to our fleet?
What Can Fleet Compliance Include?
Depending on the operation, management may need to monitor items such as:
Vehicle licences
Driver licences
Professional driving permits where required
Roadworthiness requirements
Required inspections
Vehicle documentation
Maintenance records
Driver documentation
Insurance requirements
Load-related requirements
Industry-specific requirements
Company safety requirements
Because regulatory requirements can change and vary according to vehicle and operation, businesses should confirm the requirements that apply to their specific fleet.
How Is Regulatory Compliance Rate Calculated?
A simple formula is: Regulatory Compliance Rate = Compliant Items ÷ Total Required Compliance Items × 100.
Suppose a fleet compliance audit checks 120 required items.
Of these: 114 are fully compliant.
The calculation is: 114 ÷ 120 × 100 = 95%
The Regulatory Compliance Rate is: 95%
This means that 5% of the required items checked were not compliant.
Compliance Can Also Be Measured by Vehicle
Suppose a company operates 25 vehicles.
During a monthly compliance review: 23 vehicles meet all required fleet compliance checks
The calculation is: 23 ÷ 25 × 100 = 92%
The fleet's vehicle-level compliance rate is: 92%
However, management should also identify exactly why the remaining two vehicles failed.
A percentage alone is not enough.
Example of Poor Regulatory Compliance Performance
Imagine a construction company conducts a compliance review across its fleet:
It checks: 100 required compliance items
Only: 82 are compliant
The calculation is: 82 ÷ 100 × 100 = 82%
The Regulatory Compliance Rate is: 82%
Problems identified include:
Expired vehicle licences
Missing inspection records
Driver documentation requiring renewal
Incomplete maintenance records
Outstanding vehicle defects
What Does This Mean for the Company?
An 82% compliance rate means that nearly one in five items checked did not meet the required standard.
Depending on the nature and seriousness of the failures, the company could face:
Fines or penalties
Vehicles being prevented from operating
Increased accident exposure
Insurance complications
Customer concerns
Contractual problems
Reputational damage
Operational disruption
Some compliance failures may be administrative. Others may create immediate safety or legal risks.
Management should therefore classify non-compliance according to severity.
Not All Compliance Failures Are Equal
Consider two failures:
Failure A: A filing document is stored in the wrong folder.
Failure B: A driver is operating without a legally required valid document.
Both may appear as non-compliant items in a simple calculation. But they do not represent the same level of risk.
Businesses should therefore consider categorising findings as:
Critical
Major
Minor
Critical non-compliance should receive immediate attention. This prevents a high overall percentage from hiding a serious individual problem.
For example, a fleet could have: 99% compliance but the remaining 1% might involve a serious safety or legal issue.
The overall percentage looks excellent.
The individual failure may still be unacceptable.
Example of Good Regulatory Compliance Performance
Suppose the construction company introduces:
A central compliance register
Automated expiry reminders
Monthly document checks
Driver licence monitoring
Vehicle licence tracking
Clear responsibility for compliance
Regular internal audits
At the next review: 198 out of 200 required items are compliant
The calculation is: 198 ÷ 200 × 100 = 99%
Regulatory Compliance Rate is: 99%
The two outstanding issues are minor administrative matters and are corrected immediately.
What Does This Mean for the Company?
Strong compliance performance can help the company:
Reduce legal and regulatory risk
Avoid preventable operational interruptions
Maintain better records
Improve safety management
Protect customer relationships
Improve readiness for audits
Demonstrate better fleet governance
Compliance becomes proactive rather than something management only considers after a problem occurs.
Create a Fleet Compliance Register
Even a small business can maintain a simple compliance register.
For example:
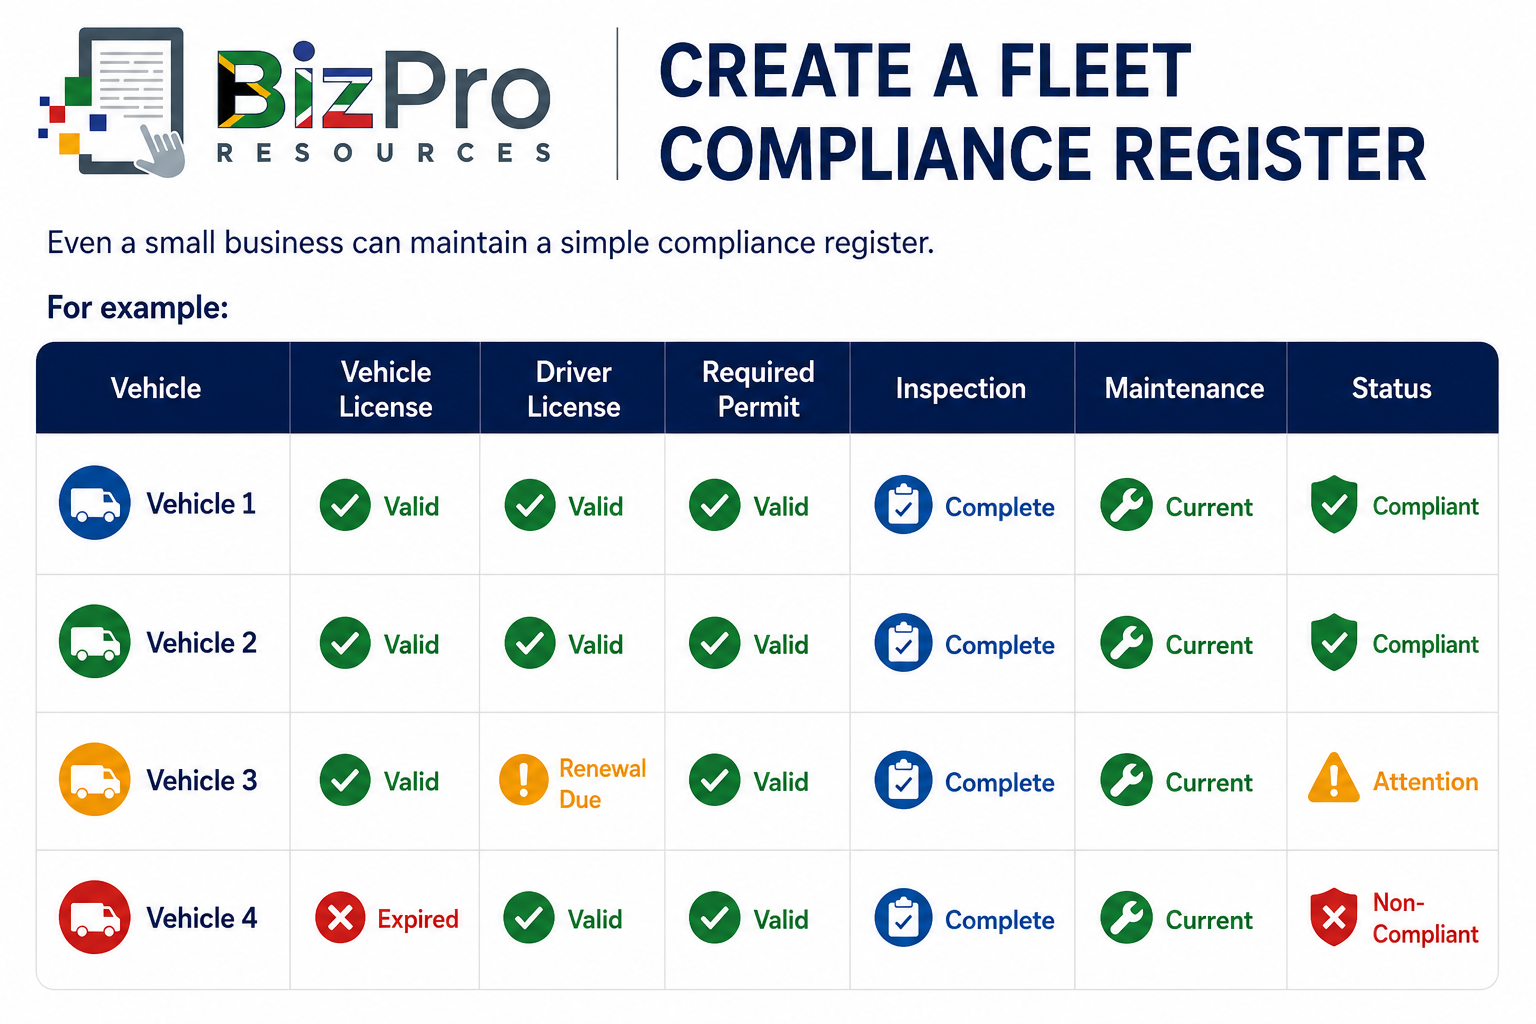
Management can review the register regularly and address upcoming expiry dates before they become compliance failures.
The important principle is: Do not wait for documents to expire before taking action.
How the Three Utilization and Safety Metrics Work Together
Fleet Asset Utilization, Driver Safety Score and Regulatory Compliance Rate measure different aspects of fleet performance. But they are connected.
Imagine a company discovers:
Fleet Utilization: 55%
Average Driver Safety Score: 72/100
Regulatory Compliance: 84%
Management now has three different concerns:
The fleet appears to have underutilised assets.
Driver behaviour shows elevated safety risk.
Compliance performance requires improvement.
Simply reducing the number of vehicles will not solve the safety or compliance problems. Similarly, improving driver safety will not automatically solve underutilization.
Each problem requires its own action.
However, management should also consider how decisions affect the other metrics.
For example, suppose the company sells too many underutilised vehicles:
The remaining fleet could become overloaded.
Drivers may then face greater scheduling pressure.
Vehicles may be used excessively.
Maintenance windows may become harder to schedule.
Driver fatigue or speeding pressure could increase.
Utilization could improve while safety and reliability deteriorate.
This is why fleet metrics should be managed as a balanced system.
Example: Improving Utilization, Safety and Compliance Together
Consider an electrical services company operating 25 vehicles.
Its fleet dashboard shows:
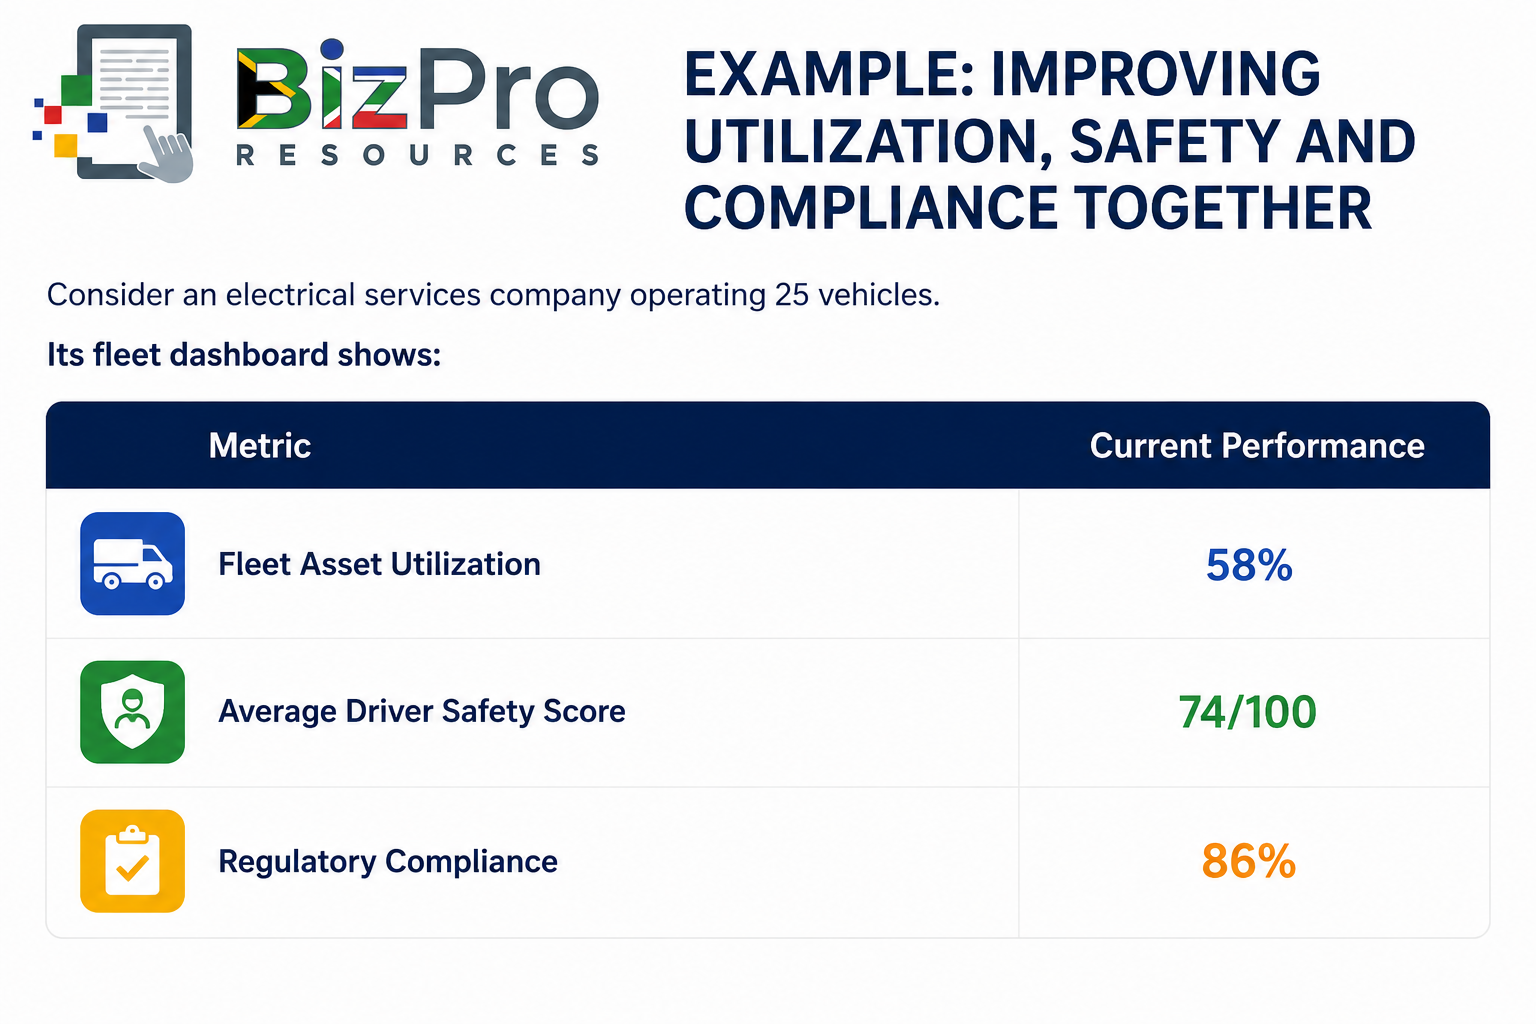
Management investigates.
It discovers:
Several vehicles are rarely used
Drivers frequently exceed company speed limits
Some licence renewals are being handled late
Vehicle inspection records are inconsistent
The company introduces:
A vehicle booking system
Monthly utilization reviews
Driver safety coaching
Telematics monitoring
A compliance register
Automated renewal reminders
Monthly fleet performance meetings
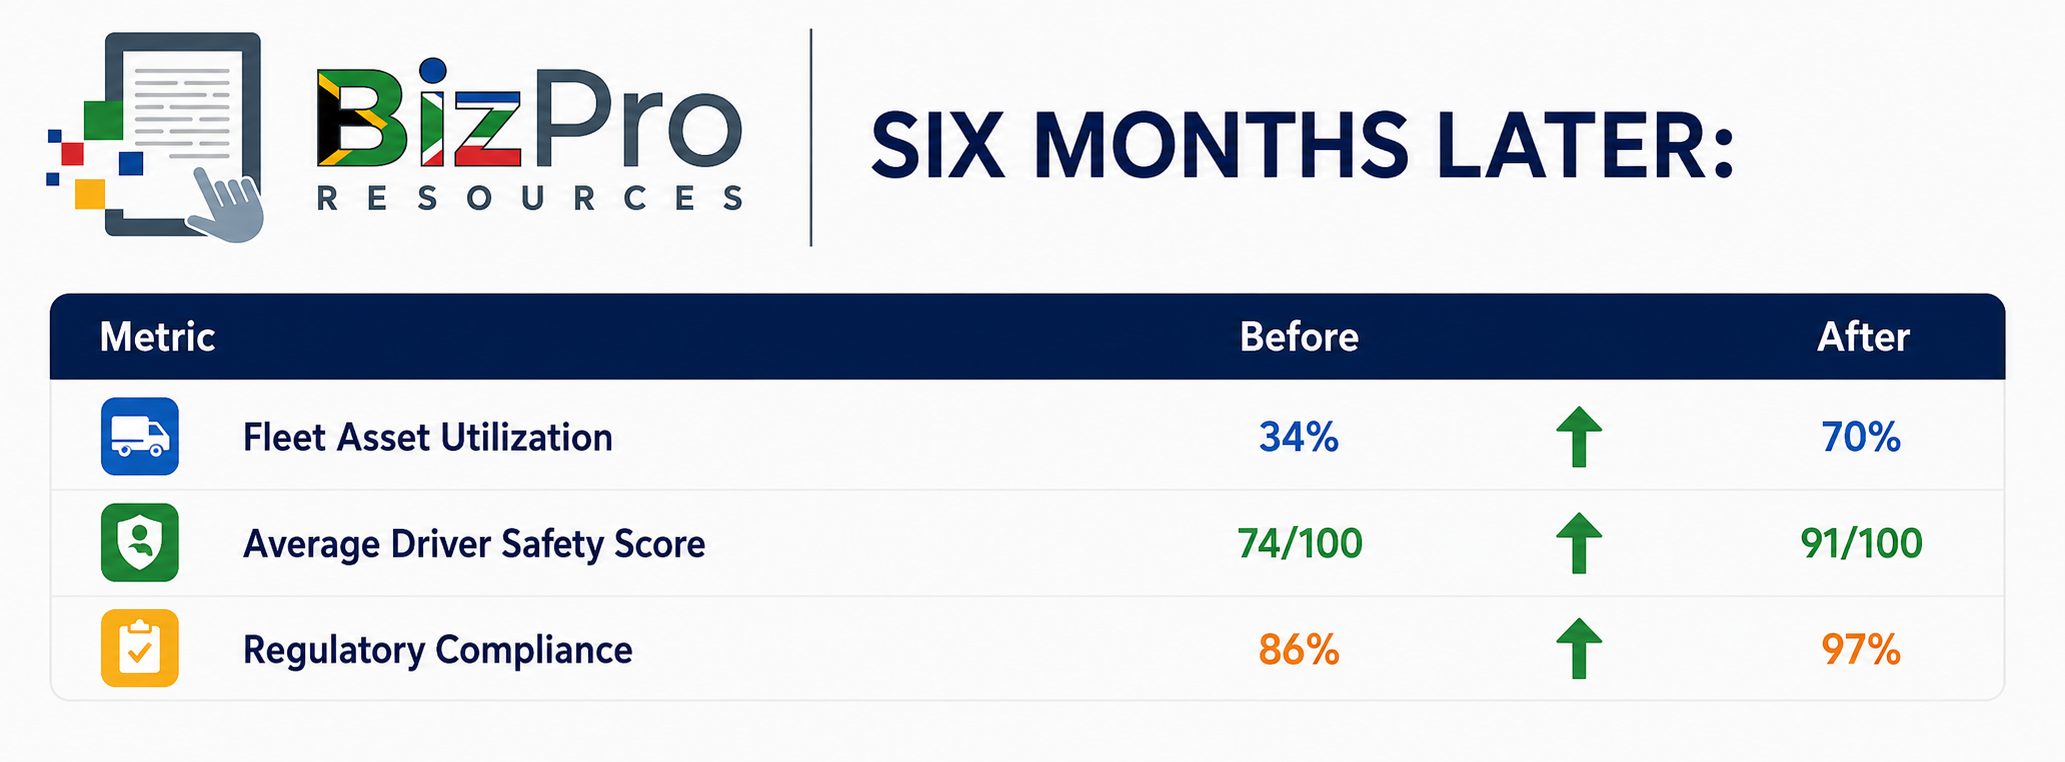
Six months later:
The fleet is now being used more effectively.
Drivers are demonstrating safer behaviour.
Compliance management has improved substantially.
This is a stronger fleet operation.
Build a Simple Utilization and Safety Dashboard
Management can track the three metrics monthly.
For example:
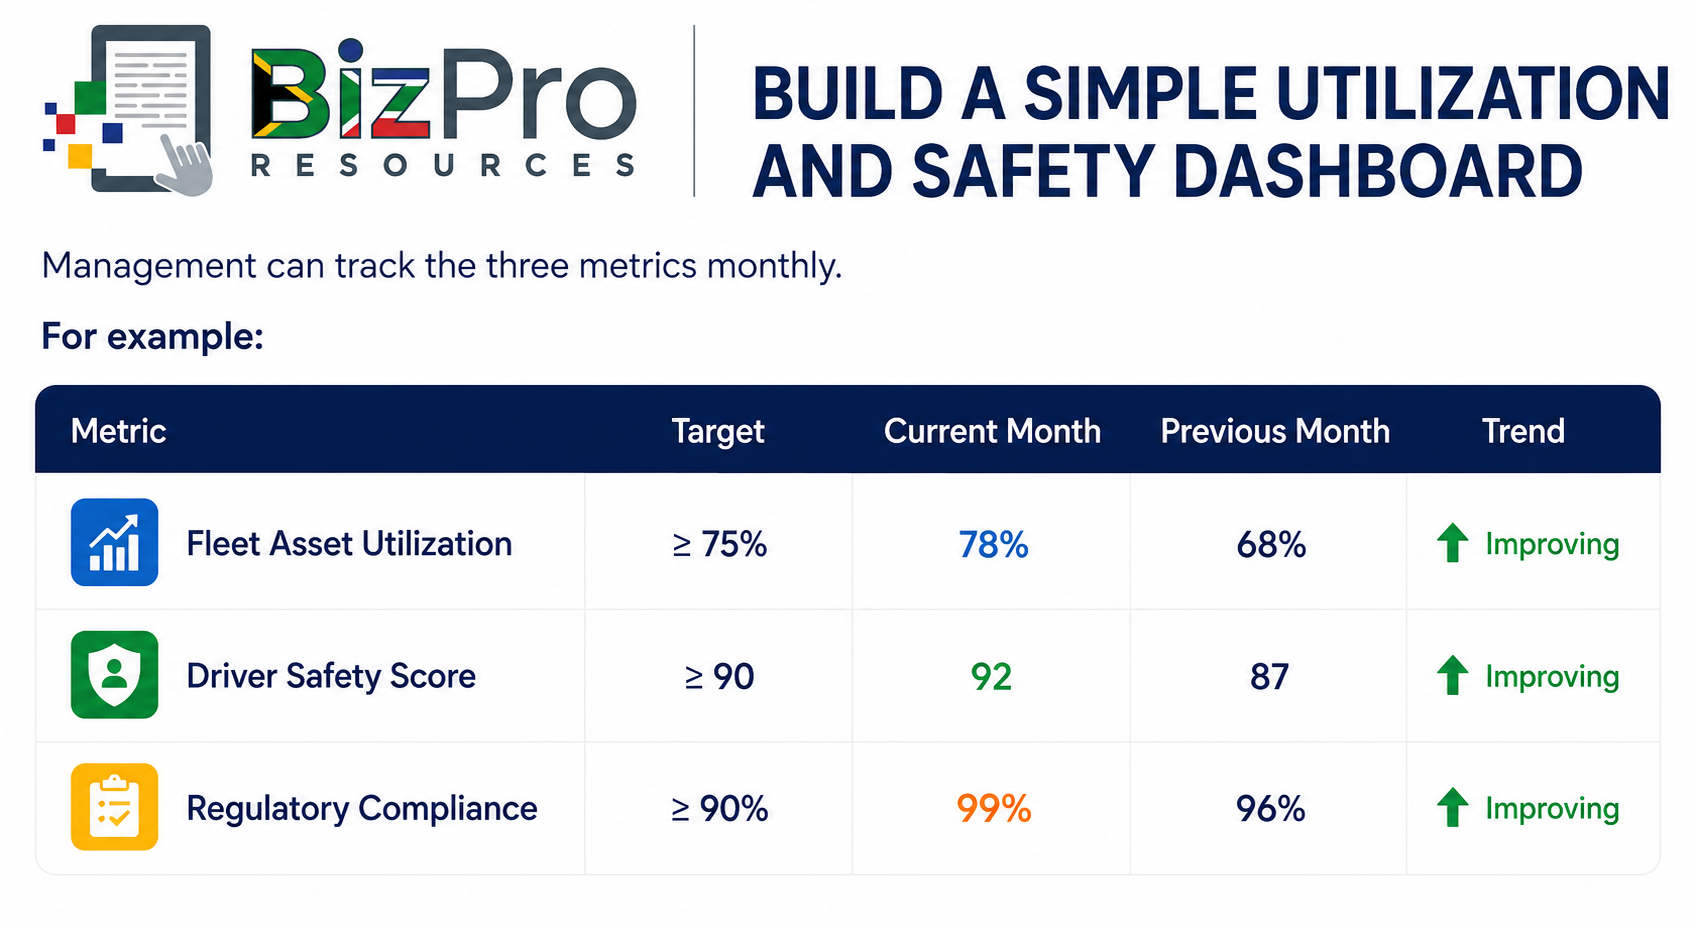
The dashboard immediately gives management a high-level view.
But the numbers should lead to further investigation:
If utilization is 72%, ask: Which vehicles are underutilised?
If the Driver Safety Score is 92, ask: Which drivers are below the target?
If compliance is 99%, ask: What is the remaining 1%, and does it include anything critical?
This turns a dashboard into a management tool.
Look at Individual Vehicles and Drivers
Fleet averages can hide poor performers.
Suppose five vehicles have the following utilization:
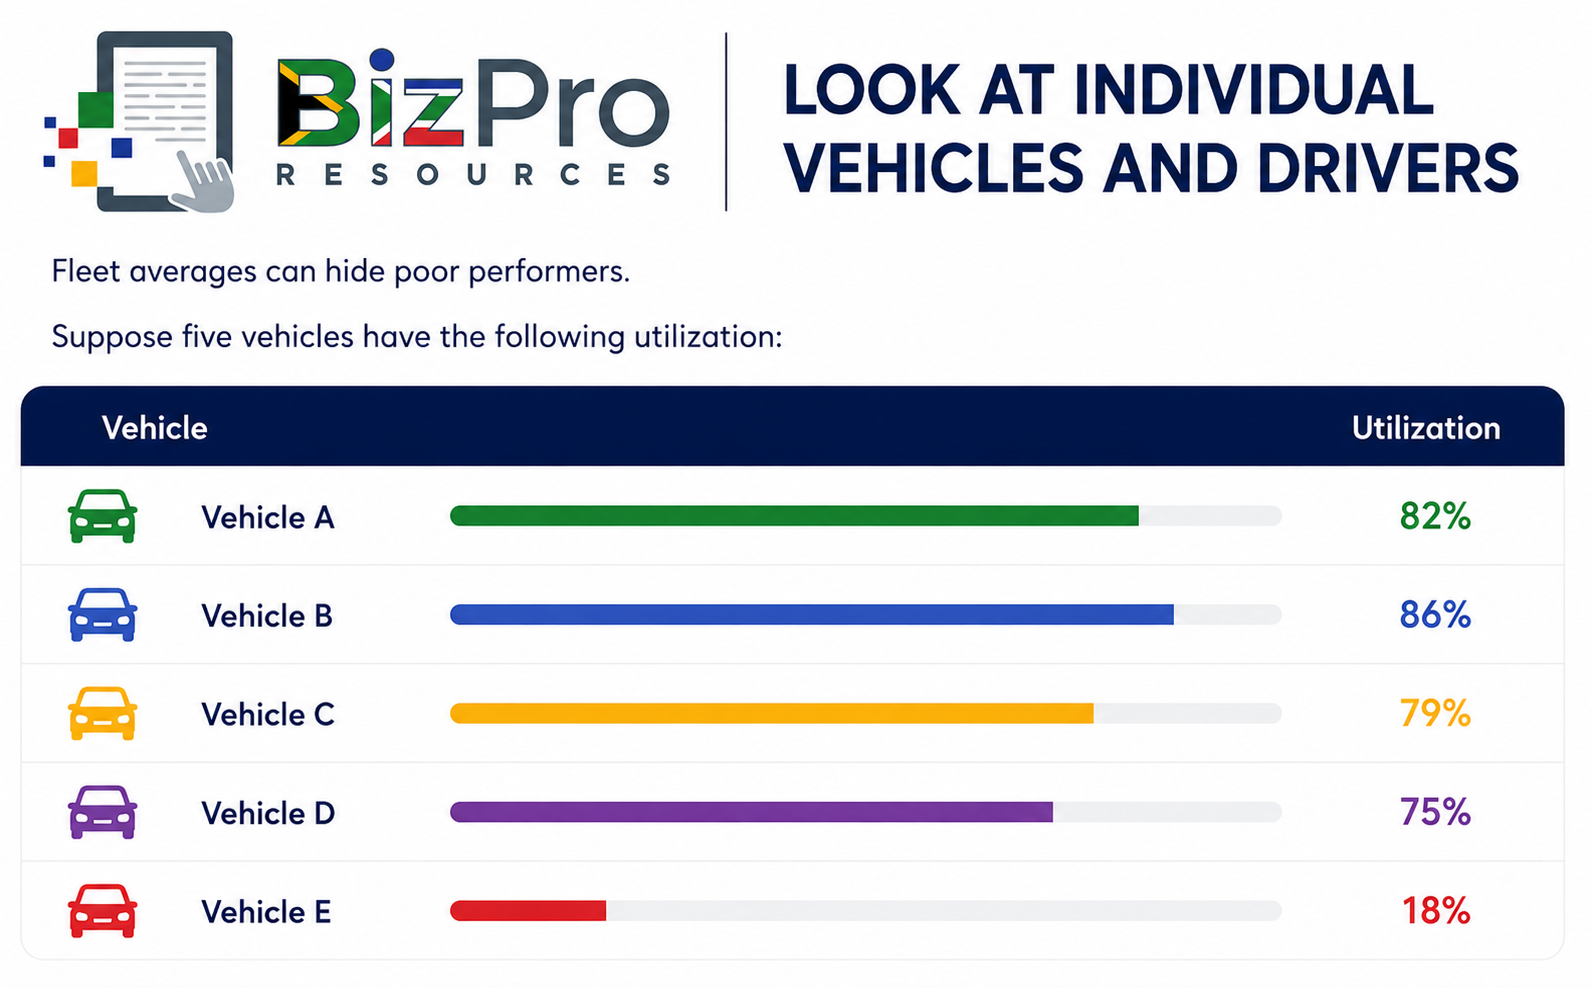
The average is: 68%. Vehicle E clearly deserves investigation.
The same applies to driver safety.
Suppose the fleet average Driver Safety Score is: 91
But individual scores are:
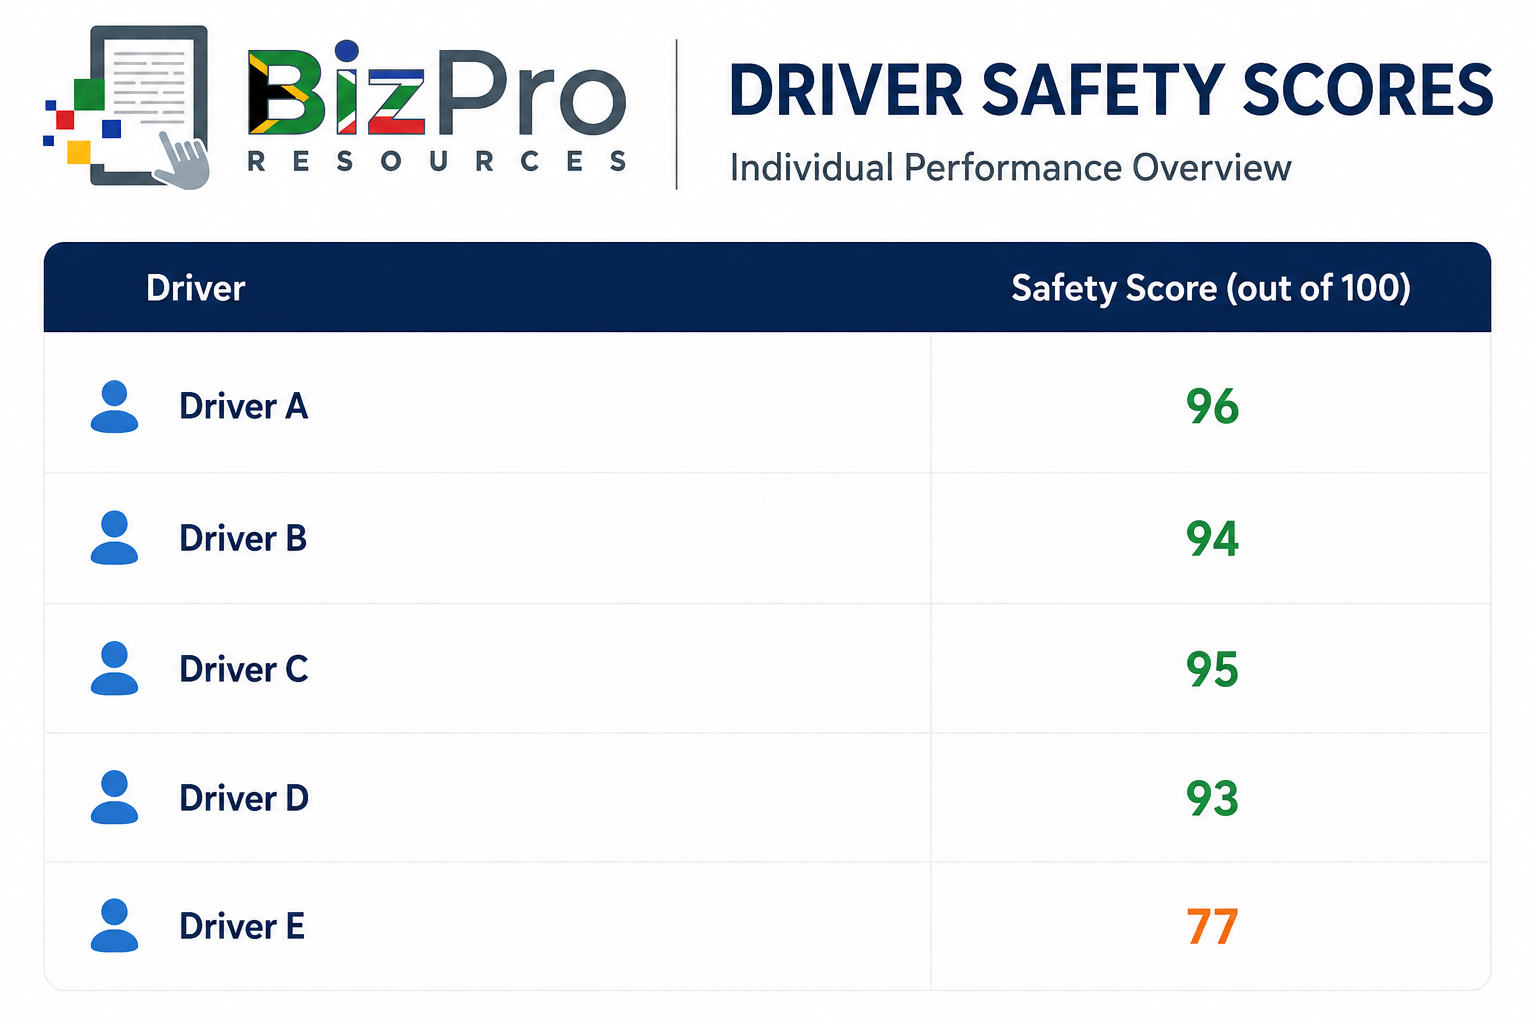
The fleet average may appear reasonably strong, but Driver E requires attention.
Good fleet management therefore requires both: Fleet-level metrics and Individual-level investigation.
Use Trends Rather Than One-Off Results
One month's performance can sometimes be unusual. A better approach is to monitor trends.
For example:
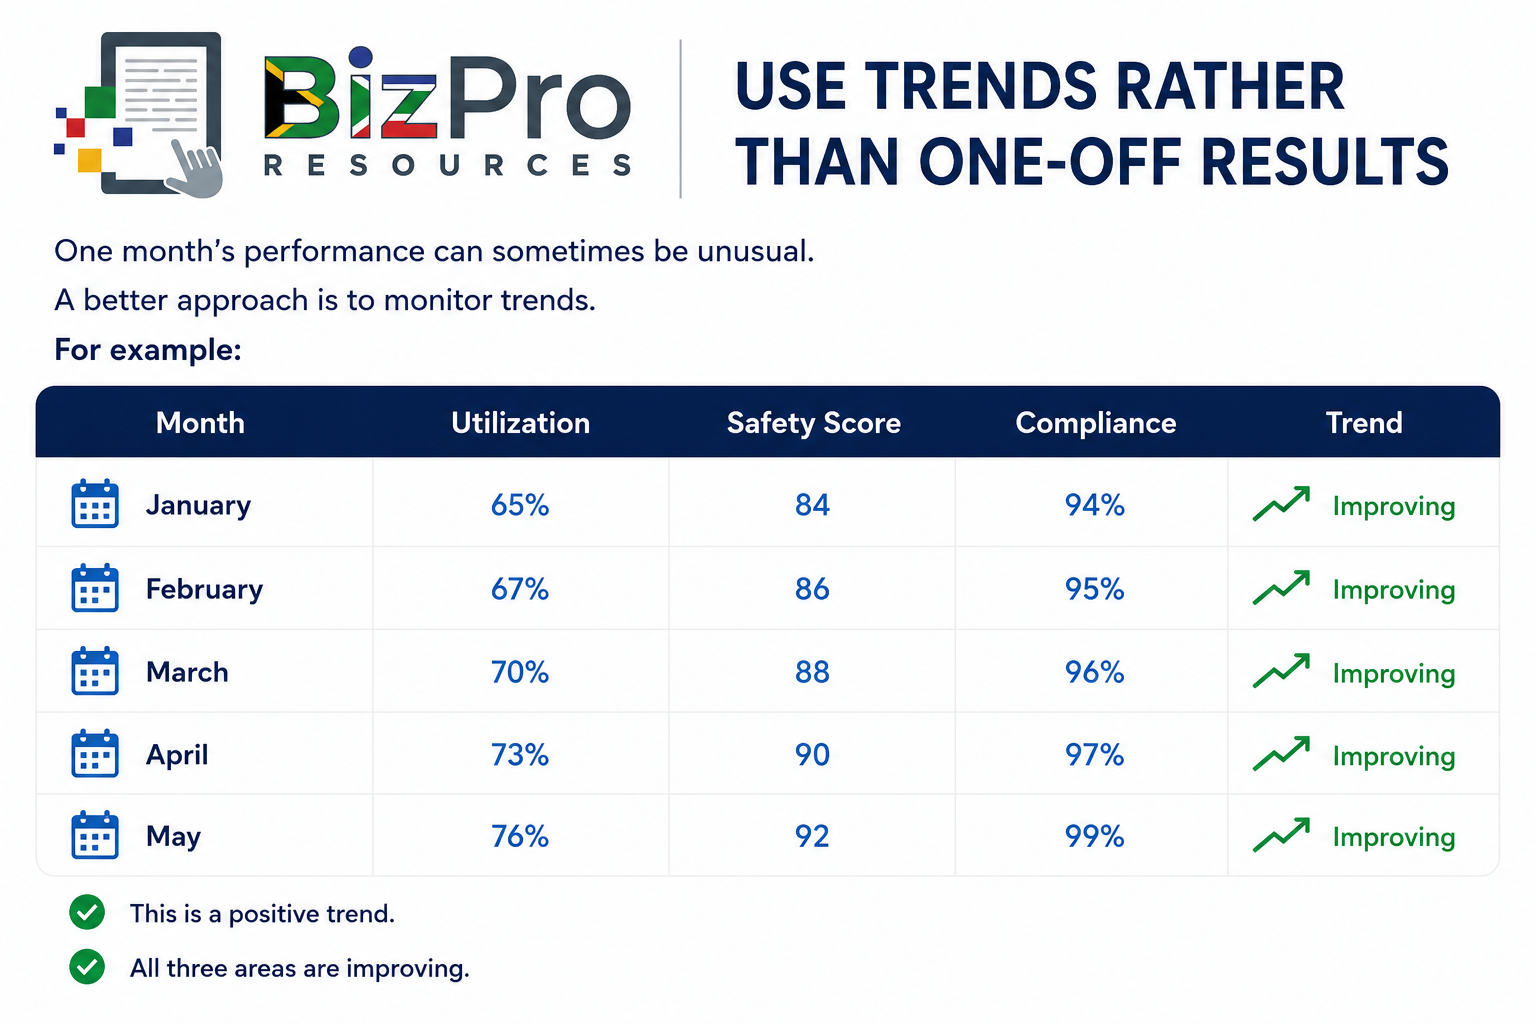
This is a positive trend. All three areas are improving.
Now consider:
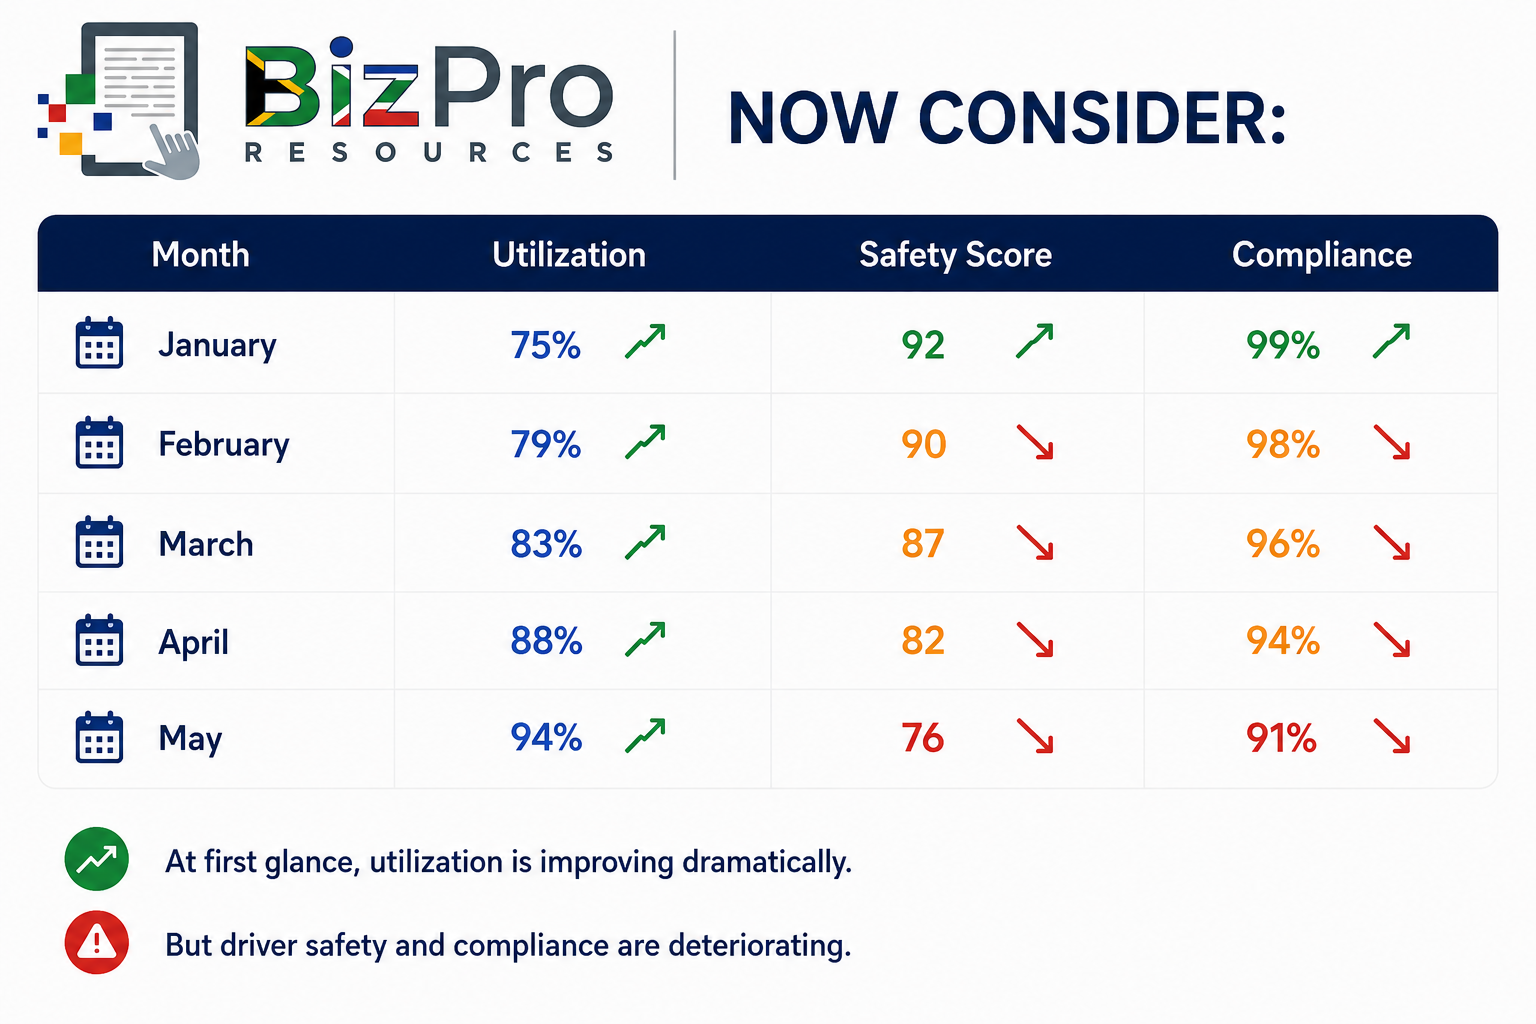
At first glance, utilization is improving dramatically. But driver safety and compliance are deteriorating. This could indicate that the fleet is being pushed too hard.
Management should investigate whether:
Drivers are under excessive pressure
Vehicles are overloaded
Maintenance is being delayed
Compliance checks are being skipped
The fleet has become too small for operational demand
Higher utilization is not automatically good if it creates unacceptable safety or compliance risks.
What Does Good Utilization and Safety Performance Look Like?
There is no single utilization rate or Driver Safety Score that suits every fleet.
Different businesses operate differently:
A security company may intentionally keep spare response vehicles available.
A construction company may have specialist vehicles used only for certain jobs.
A delivery business may require very high daily vehicle availability.
A business should therefore establish targets appropriate to its operation.
Good management generally means the company can answer questions such as:
Which vehicles are being underutilised?
Which vehicles are heavily utilised?
Do we have too many vehicles?
Do we have enough vehicles for peak demand?
Which drivers consistently demonstrate risky behaviour?
What types of unsafe events occur most frequently?
Are safety interventions improving driver behaviour?
Are all required licences and permits current?
Are compliance inspections being completed?
Are any critical compliance issues outstanding?
Are we improving utilization without increasing safety risk?
Is the fleet appropriately sized for the work it performs?
These questions turn fleet data into management information.
Turning Utilization and Safety Data into Action
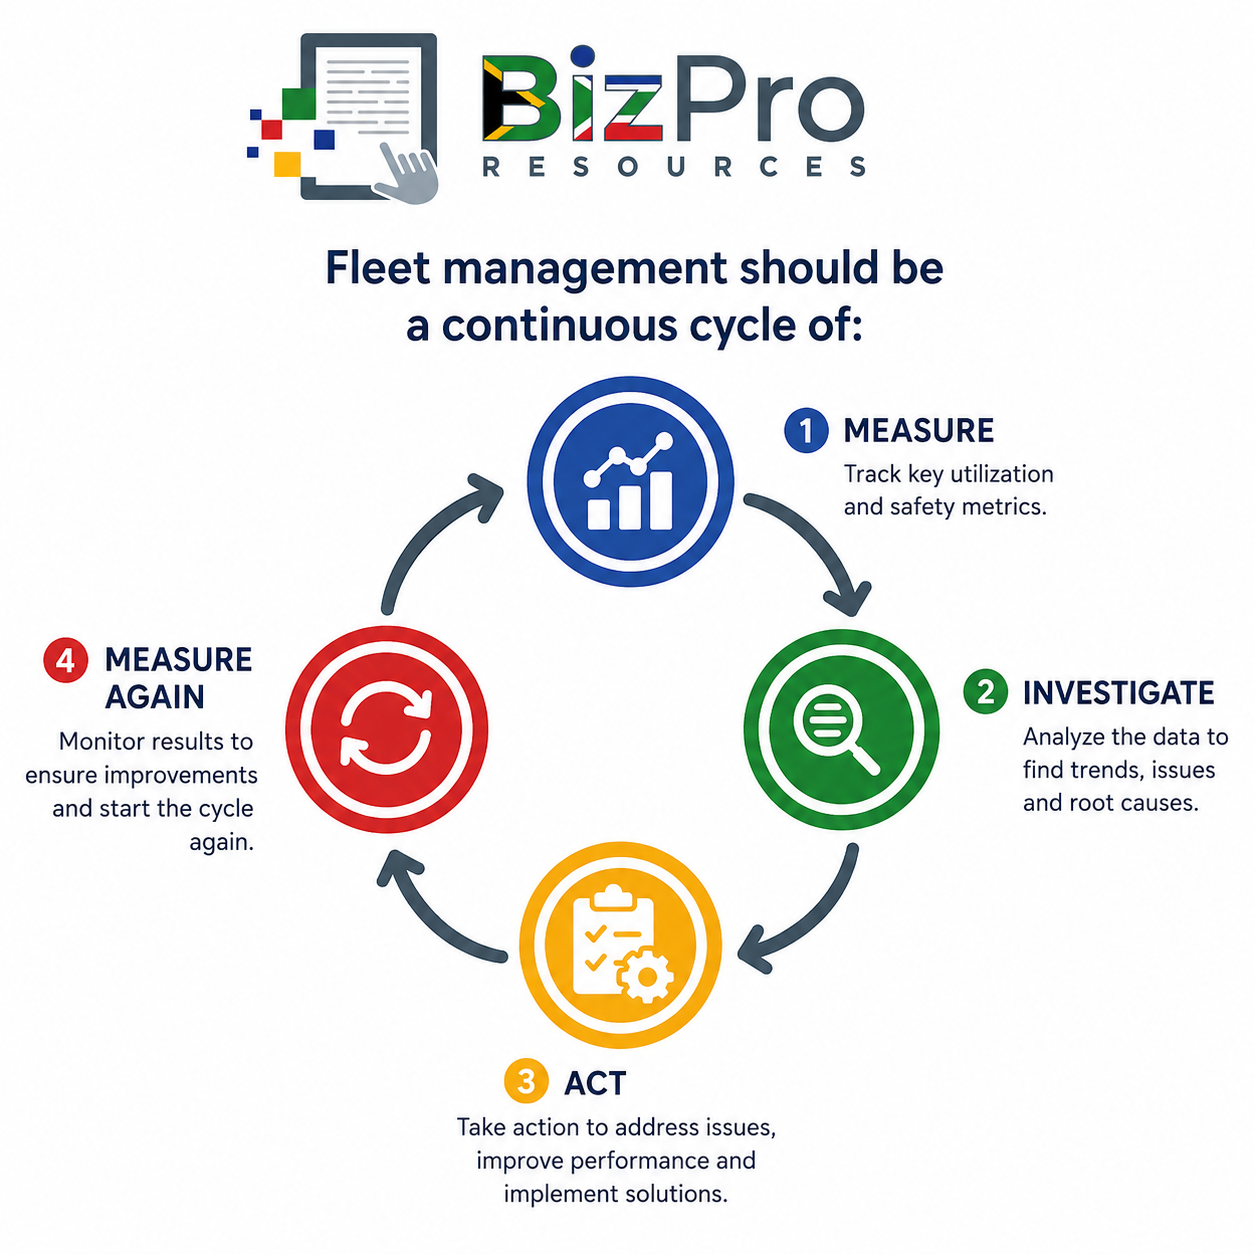
A useful process is:
1. Measure Utilization
Identify how often each vehicle is being productively used.
2. Measure Driver Safety
Track relevant driver behaviour and safety events.
3. Measure Compliance
Maintain a register of required licences, inspections, permits and other obligations.
4. Compare
Compare:
Vehicles
Drivers
Branches
Months
Internal targets
5. Investigate Exceptions
Look for:
Underutilised vehicles
Overutilised vehicles
High-risk drivers
Expiring documents
Non-compliant vehicles
6. Take Corrective Action
Possible actions include:
Reallocating vehicles
Selling unnecessary assets
Driver coaching
Safety training
Adjusting schedules
Improving compliance administration
Renewing licences or permits
Correcting vehicle defects
7. Measure Again
Determine whether the intervention worked. Fleet management should be a continuous cycle of:
Bringing All Fleet Management Metrics Together
Across this Fleet Management Metrics series, we have examined three major areas.
Cost Control Metrics
Total Cost per Kilometre
Total Cost of Ownership
Fuel Efficiency and Idling Costs
These metrics help management understand:
What does our fleet cost?
Maintenance and Availability Metrics
Vehicle Downtime Percentage
Preventative Maintenance Compliance
Mean Time Between Failures
These metrics help management understand:
Is our fleet reliable and available?
Utilization and Safety Metrics
Fleet Asset Utilization Rate
Driver Safety Score
Regulatory Compliance Rate
These metrics help management understand:
Are we using our fleet effectively, safely and responsibly?
Together, these metrics create a much more complete picture of fleet performance.
A vehicle could have a low operating cost but poor safety performance.
Another vehicle could have excellent reliability but very low utilization.
Another could be highly utilised but expensive to operate.
This is why one fleet metric should never become the entire management strategy.
Final Thoughts
A successful fleet is not simply a collection of vehicles that are running.
It is a group of business assets that should be:
Cost-effective
Reliable
Available
Productive
Safe
Compliant
Fleet Asset Utilization Rate helps management understand whether vehicles are being used effectively and whether the business may have too many or too few assets.
Driver Safety Scores help identify risky driving behaviour and create opportunities for coaching, training and improved safety.
Regulatory Compliance Rate helps management identify whether fleet-related legal, administrative and safety requirements are being managed properly.
Each metric answers a different question. Together, they help management make better decisions.
The objective is not to achieve the highest possible utilization regardless of consequences. It is not to create a Driver Safety Score simply so that drivers can be ranked. And it is not to maintain compliance records simply to complete paperwork.
The objective is to operate a fleet that supports the business without creating unnecessary cost or unacceptable risk.
For a South African small or medium-sized business, that means knowing:
Which vehicles are needed.
How effectively they are being used.
How safely they are being driven.
Whether the business is meeting its fleet compliance responsibilities.
When management measures these areas consistently and acts on what the numbers reveal, fleet management becomes more than vehicle administration.
It becomes an important part of cost control, risk management, productivity and overall business performance.
Related Articles in the Fleet Management Metrics Series
Fleet Cost Control Metrics: How to Measure and Reduce Vehicle Operating Costs
Fleet Utilization and Safety Metrics: Measuring Vehicle Use, Driver Safety and Compliance
AI Disclaimer
AI Tools were used to assist with research. Remember to always cross-check everything that you read.


