

Fleet Maintenance and Availability Metrics: Measuring Downtime, PM Compliance and Vehicle Reliability
Article #2 of #3 in the Fleet Management Metrics Series
Introduction
A vehicle only creates value for a business when it is available to do the work it was purchased for:
A delivery vehicle that is standing in a workshop cannot make deliveries.
A plumber's bakkie with an engine problem cannot transport the plumber to customers.
A security response vehicle waiting for repairs cannot respond to an alarm.
A truck with overdue maintenance may still be operating today, but it could be creating a much larger breakdown tomorrow.
This is why effective fleet management is not only about controlling fuel and vehicle costs. Businesses also need to measure vehicle reliability, maintenance performance and availability.
Three particularly useful metrics are:
Vehicle Downtime Percentage
Preventative Maintenance (PM) Compliance
Mean Time Between Failures (MTBF)
Together, these metrics help management answer three important questions:
How much time are our vehicles unavailable?
Are we completing preventative maintenance when we should?
How reliably are our vehicles operating between failures?
These questions are closely connected because:
Poor preventative maintenance can contribute to more breakdowns.
More breakdowns can reduce the time between failures.
More failures can increase vehicle downtime.
More downtime can disrupt operations and increase costs.
For a small or medium-sized business, understanding these relationships can help prevent fleet problems before they become serious operational and financial problems.
1. Vehicle Downtime Percentage
What Is Vehicle Downtime?
Vehicle downtime is the period during which a vehicle is unavailable to perform its normal business function.
A vehicle may be unavailable because of:
Mechanical breakdowns
Repairs
Accident damage
Scheduled servicing
Tyre problems
Electrical faults
Parts shortages
Inspections
Maintenance delays
Other technical or administrative problems
Not all downtime is bad.
A vehicle that is temporarily unavailable because it is receiving a properly scheduled service is undergoing planned downtime. That planned maintenance may actually prevent much more expensive unplanned downtime later.
The more concerning form is usually unplanned downtime caused by breakdowns, failures, accidents or maintenance problems.
What Is Vehicle Downtime Percentage?
Vehicle Downtime Percentage measures how much of the time that a vehicle should have been available for work it was actually unavailable.
For example, suppose a vehicle should have been available for 200 working hours during the month. It was unavailable for 20 hours because of repairs.
The vehicle's downtime percentage is: 10%.
This means the company lost 10% of the vehicle's potential operating availability during that period.
The metric can be calculated for:
One vehicle
A group of similar vehicles
A branch
A department
The entire fleet
How Is Vehicle Downtime Percentage Calculated?
A simple formula is: Vehicle Downtime Percentage = Downtime Hours ÷ Total Scheduled Available Hours × 100
Suppose a delivery vehicle is scheduled to be available for: 200 hours per month
During the month, it experiences: 16 hours of downtime
The calculation is: 16 ÷ 200 × 100 = 8%
The vehicle's downtime percentage is therefore: 8%
This means the vehicle was unavailable for 8% of the time it was scheduled to be available.
Measuring Downtime Across a Fleet
The same calculation can be used across multiple vehicles.
Suppose a company operates 10 vehicles. Each vehicle is expected to be available for 200 hours during the month.
Total scheduled fleet availability is therefore: 10 × 200 = 2,000 vehicle-hours
During the month, the fleet experiences: 140 hours of downtime
The calculation is: 140 ÷ 2,000 × 100 = 7%
The fleet's downtime percentage is therefore: 7%
Management can then compare this result with previous months or internal targets.
Planned and Unplanned Downtime Should Be Separated
A business should ideally distinguish between:
Planned Downtime
This includes:
Scheduled services
Planned tyre replacements
Routine inspections
Planned repairs
Preventative maintenance
Unplanned Downtime
This includes:
Breakdowns
Unexpected mechanical failures
Emergency repairs
Accident damage
Unexpected tyre failures
Other unscheduled problems
This distinction is important.
Suppose Fleet A records 5% downtime because vehicles are receiving scheduled preventative maintenance. Fleet B also records 5% downtime, but almost all of it is caused by unexpected breakdowns.
The percentages are identical, but the management situation is very different:
Fleet A may be following a good maintenance programme.
Fleet B may have a serious reliability problem.
Example of a High Downtime Cycle
Imagine an electrical contracting company operates 15 service vehicles:
Each vehicle should be available for approximately: 200 hours per month
Total potential availability is: 15 × 200 = 3,000 vehicle-hours
During the month, the fleet records: 450 hours of downtime
The calculation is: 450 ÷ 3,000 × 100 = 15%
The company's Vehicle Downtime Percentage is: 15%
This means that approximately 15% of the fleet's scheduled available time has been lost.
What Does This Mean for the Company?
A 15% downtime rate could create serious operational problems.
Technicians may:
Arrive late at customer sites
Miss appointments
Share vehicles
Reschedule jobs
Spend time waiting for transport
Use expensive temporary or rental vehicles
The business may also experience:
Lost revenue
Overtime
Customer complaints
Higher repair costs
Reduced productivity
Pressure on the remaining vehicles
There is another hidden problem. When several vehicles are unavailable, the remaining vehicles often have to work harder. They travel more kilometres and carry more of the workload.
That can accelerate wear on those vehicles and potentially create even more maintenance problems.
High downtime can therefore create a cycle:
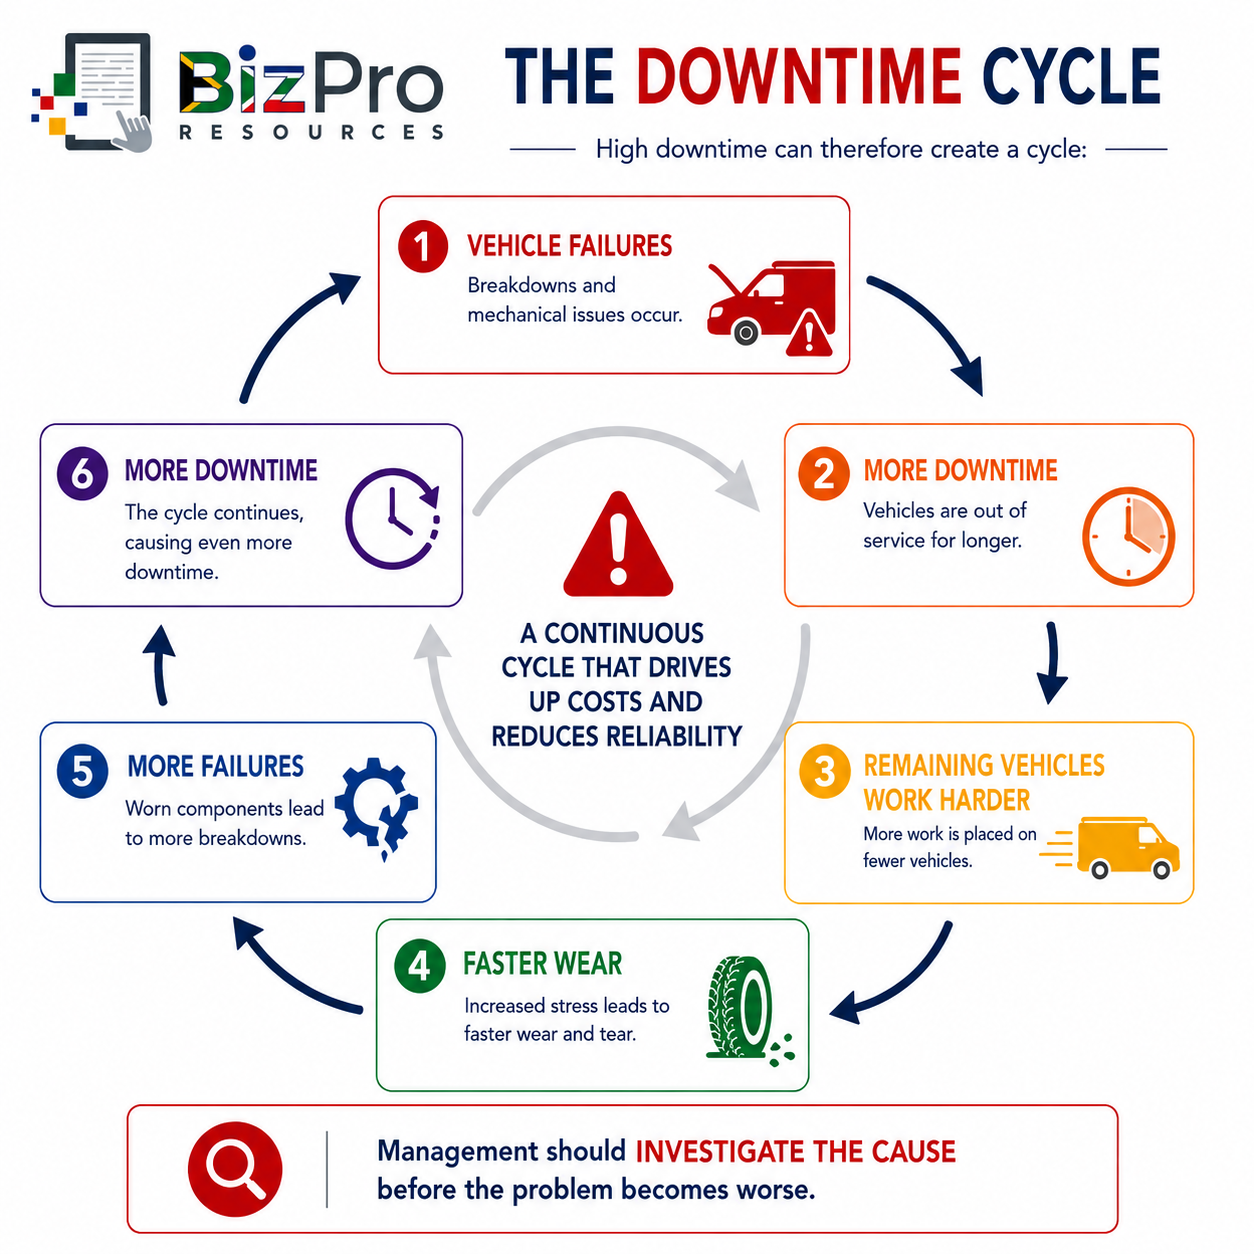
Management should investigate the cause before the problem becomes worse.
Example of Good Vehicle Downtime Performance
Suppose the company introduces:
Better preventative maintenance
Daily driver vehicle checks
Faster repair approval
Better spare-parts planning
Maintenance scheduling during quieter periods
Improved breakdown reporting
Several months later, fleet downtime falls to: 90 hours per month
The calculation becomes: 90 ÷ 3,000 × 100 = 3%
Downtime has decreased from: 15% to 3%
What Does This Mean for the Company?
The fleet is available for productive work much more consistently.
The company may experience:
More reliable customer service
Fewer cancelled jobs
Less need for rental vehicles
Higher employee productivity
Lower disruption
Better use of fleet assets
However, management should still understand what makes up the remaining 3%. Some of that downtime may be necessary planned maintenance. The objective should not automatically be zero downtime.
Vehicles need servicing, inspections and repairs.
The objective is to minimise avoidable and unplanned downtime while completing necessary maintenance properly.
2. Preventative Maintenance (PM) Compliance
What Is Preventative Maintenance?
Preventative maintenance is maintenance performed before a vehicle suffers a serious failure. Instead of waiting for something to break, the business follows a planned maintenance schedule.
Preventative maintenance may include:
Oil and filter changes
Brake inspections
Tyre inspections
Fluid checks
Battery inspections
Cooling-system checks
Suspension inspections
Belt and hose inspections
Manufacturer-specified services
Safety inspections
Maintenance may be scheduled according to:
Kilometres travelled
Time
Engine hours
Manufacturer recommendations
Vehicle operating conditions
For example, a vehicle may require servicing every: 15,000 kilometres or 12 months depending on the manufacturer's requirements and operating conditions.
What Is PM Compliance?
Preventative Maintenance Compliance measures the percentage of scheduled preventative maintenance activities completed when required.
It answers a simple question: Are we actually completing the maintenance we planned?
A business can have an excellent maintenance schedule on paper and still have poor fleet maintenance if services are repeatedly missed or delayed.
PM Compliance therefore measures execution, not simply planning.
How Is PM Compliance Calculated?
A basic formula is: PM Compliance = Preventative Maintenance Tasks Completed on Time ÷ Total Scheduled PM Tasks × 100
Suppose a fleet has: 40 scheduled preventative maintenance activities during a quarter.
Of these: 36 are completed on time
The calculation is: 36 ÷ 40 × 100 = 90%
PM Compliance is therefore: 90%
This means that 90% of scheduled preventative maintenance activities were completed on time.
The remaining 10% were late or missed.
Define What "On Time" Means
Before measuring PM Compliance, management needs to define what counts as an on-time service.
For example, the company might decide that maintenance must occur:
By the scheduled date
Before the required kilometre interval is exceeded
Within an approved tolerance
Whatever rule the business chooses, it should be clear and consistently applied. Without a clear definition, the metric becomes unreliable.
One branch might consider a service 1,000 km late to be compliant while another considers it overdue.
The data would then not be comparable.
Example of Poor PM Compliance
Suppose a security company operates 30 vehicles:
During one month: 20 preventative maintenance activities are scheduled.
Only: 13 are completed on time.
PM Compliance is: 13 ÷ 20 × 100 = 65%
This means: 35% of scheduled maintenance was late or missed.
What Does This Mean for the Company?
Poor PM Compliance can indicate:
Weak maintenance planning
Poor vehicle scheduling
Drivers not reporting vehicles for service
Managers prioritising operations over maintenance
Poor communication
Workshop capacity problems
Parts shortages
Weak fleet administration
The short-term temptation may be to keep vehicles working rather than sending them for maintenance.
For example: "We are too busy this week. Let us service the vehicle next month."
This may seem practical.
But delaying preventative maintenance can increase the risk of:
Mechanical failures
Brake problems
Engine damage
Tyre failures
Unexpected breakdowns
More expensive repairs
Safety incidents
Longer downtime
A relatively inexpensive scheduled service may prevent a much more expensive failure.
The Hidden Cost of Skipping Maintenance
Suppose a vehicle requires a scheduled service costing: R4,500. Management delays the service because the vehicle is needed for operations. Several weeks later, a mechanical problem develops.
The resulting costs include:
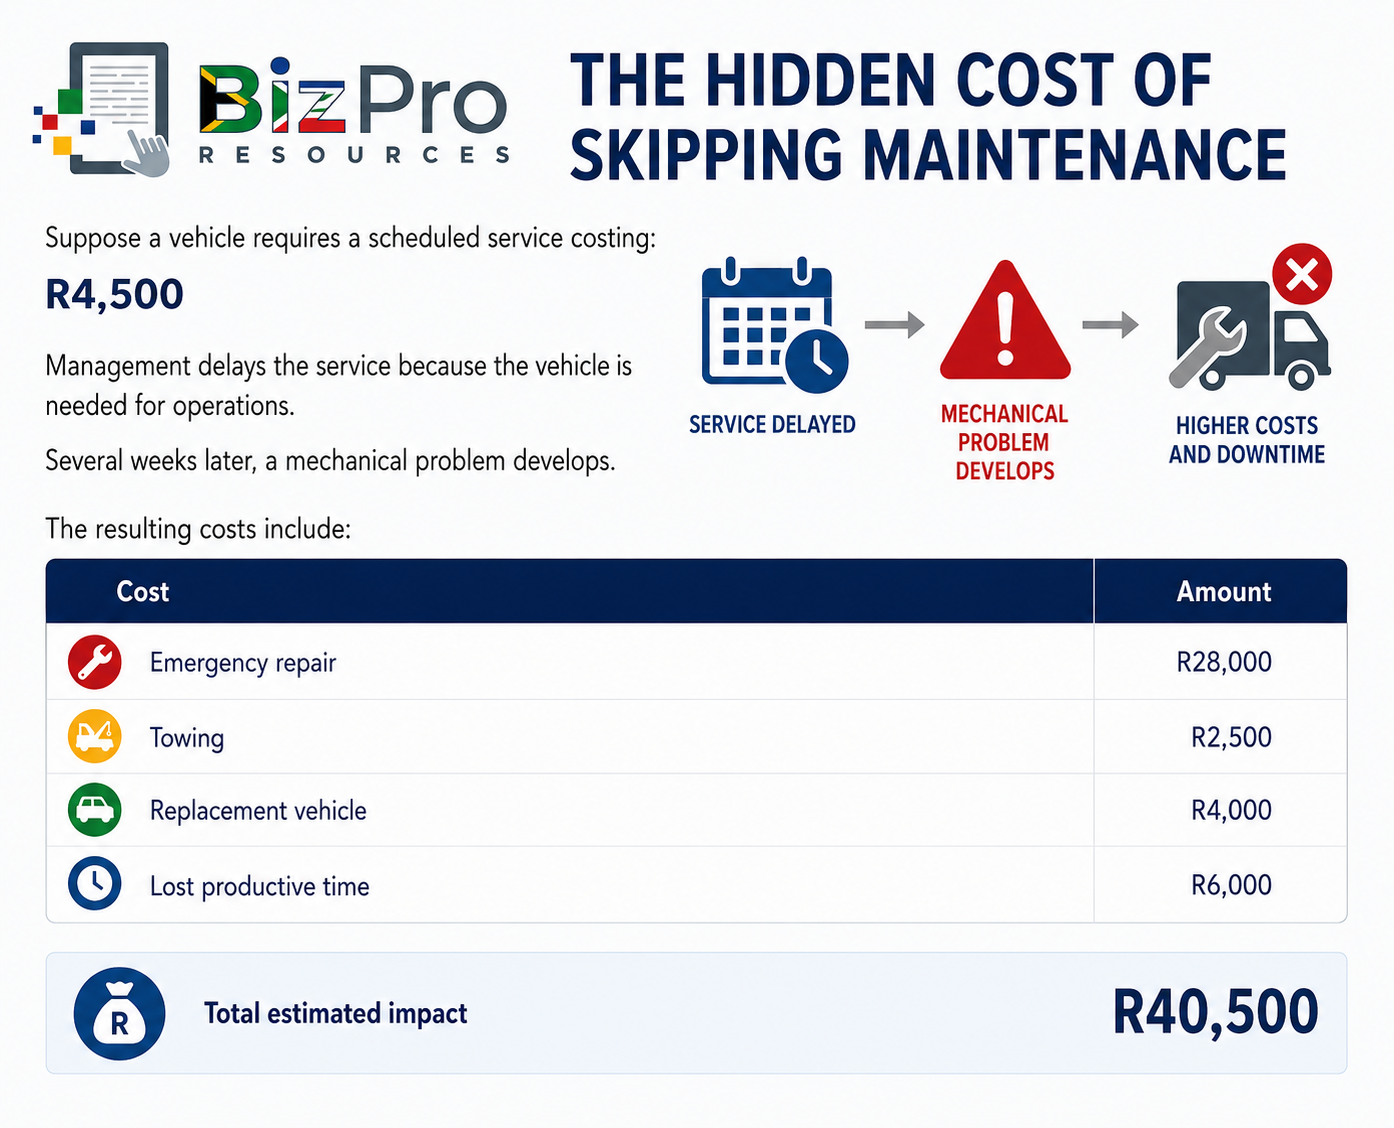
The company avoided a R4,500 service temporarily but potentially created a R40,500 problem.
This does not mean every late service will cause a major breakdown.
It demonstrates why preventative maintenance should be treated as a business control rather than simply an expense.
Example of Good PM Compliance
Suppose the same security company improves its maintenance process.
It introduces:
Automated service reminders
Weekly maintenance reports
Driver notifications
Maintenance bookings in advance
Clear responsibility for overdue vehicles
Better coordination with operations
During the next month:
24 preventative maintenance activities are scheduled.
23 are completed on time.
The calculation is: 23 ÷ 24 × 100 = 95.8%
PM Compliance is approximately: 96%
What Does This Mean for the Company?
High PM Compliance suggests that the maintenance programme is being implemented consistently.
Potential benefits include:
Fewer unexpected breakdowns
Better vehicle reliability
Longer vehicle life
Improved safety
Better maintenance planning
Lower emergency repair costs
More predictable downtime
It can also improve management's ability to plan operations because maintenance is happening when expected rather than after vehicles fail unexpectedly.
High PM Compliance Does Not Automatically Mean Good Maintenance
There is an important warning. A fleet could report 100% PM Compliance while still experiencing poor reliability. Why?
Because the maintenance programme itself might be inadequate.
For example:
Service intervals may be too long
Inspections may be poorly performed
Faults may not be repaired properly
The wrong maintenance tasks may be scheduled
Vehicles may be operating under unusually harsh conditions
PM Compliance therefore answers: Did we perform the scheduled maintenance on time?
It does not automatically answer: Was the maintenance programme effective?
This is why PM Compliance should be measured together with downtime and vehicle reliability metrics such as MTBF.
3. Mean Time Between Failures (MTBF)
What Is Mean Time Between Failures?
Mean Time Between Failures, usually shortened to MTBF, measures how long a repairable vehicle or component operates, on average, between failures. In fleet management, MTBF helps management understand vehicle reliability.
The principle is simple:
Longer periods between failures generally indicate better reliability.
Shorter periods between failures generally indicate poorer reliability.
MTBF can be measured using:
Operating hours
Kilometres travelled
Days of operation
For vehicle fleets, kilometres or operating hours can often be particularly useful.
The important point is to use the same measurement consistently when comparing performance.
How Is MTBF Calculated?
A simple formula is: MTBF = Total Operating Time ÷ Number of Failures.
Suppose a vehicle operates for: 1,200 hours during a period and experiences 4 failures.
The calculation is: 1,200 ÷ 4 = 300 hours
MTBF is: 300 operating hours
This means the vehicle operates for an average of approximately 300 hours between failures.
Calculating MTBF Using Kilometres
For many fleets, kilometres may be easier to understand.
Suppose five delivery vehicles collectively travel: 100,000 km during a measurement period.
During that period, they experience: 10 qualifying mechanical failures.
The calculation is: 100,000 ÷ 10 = 10,000 km.
MTBF is therefore: 10,000 km between failures.
In other words, the fleet experiences approximately one qualifying failure for every 10,000 km travelled.
Define What Counts as a Failure
This is extremely important. Management should clearly define what will count as a failure in the MTBF calculation.
For example, should the following count?
Engine breakdown?
Flat tyre?
Battery failure?
Air-conditioning fault?
Broken headlight?
Accident damage?
Scheduled replacement of a worn component?
If different managers use different definitions, the metric becomes unreliable.
A company might decide that a qualifying failure is: An unplanned mechanical or electrical fault that prevents the vehicle from performing its normal operational function and requires repair.
The exact definition can vary according to the business.
What matters is consistency.
Example of Poor MTBF Performance
Suppose a courier company operates a group of delivery vans:
During one quarter, the vans travel 180,000 km and experience 30 qualifying failures.
MTBF is: 180,000 ÷ 30 = 6,000 km
The fleet therefore averages: 6,000 km between failures
Management compares this with the previous year, when the same vehicle group averaged: 15,000 km between failures
Reliability has deteriorated significantly.
What Does This Mean for the Company?
The declining MTBF could indicate:
Ageing vehicles
Poor preventative maintenance
Inadequate repairs
Harsh driving conditions
Driver abuse
Overloading
Poor-quality replacement parts
Repeated failure of particular components
Vehicles being kept beyond their economical operating life
The company may also experience:
Higher downtime
More towing costs
More emergency repairs
Missed deliveries
Customer complaints
Higher maintenance expenditure
Lower productivity
Management should investigate why failures are becoming more frequent.
MTBF Can Help Identify Problem Vehicles
Fleet-wide averages are useful, but individual vehicle data can be even more valuable.
Consider:
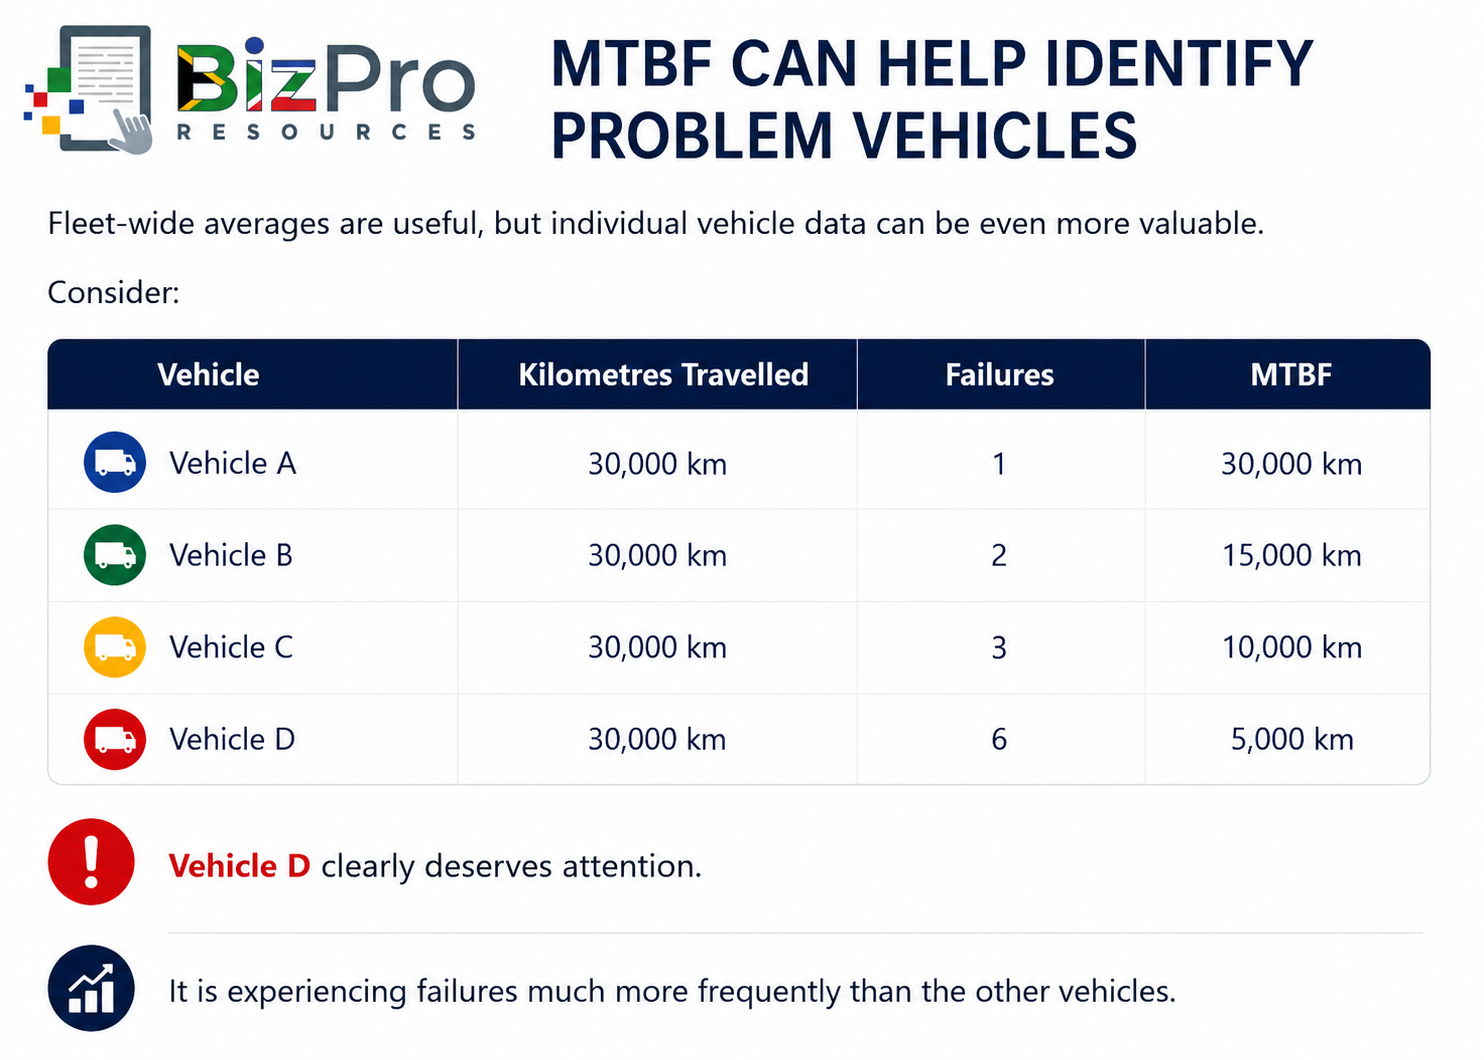
Vehicle D clearly deserves attention. It is experiencing failures much more frequently than the other vehicles.
Management can investigate:
What is failing?
Are the same components failing repeatedly?
Is the vehicle being repaired properly?
Is the driver operating the vehicle differently?
Is it carrying heavier loads?
Is it operating on worse roads?
Has the vehicle become too old?
Would replacement be cheaper than continuing repairs?
MTBF helps turn a general feeling that: "This vehicle is always breaking down"
into measurable evidence.
Example of Good MTBF Performance
Suppose the courier company responds to its reliability problems by:
Improving preventative maintenance
Replacing unreliable components
Training drivers
Removing overloaded vehicles from unsuitable routes
Improving workshop quality control
Replacing several ageing vehicles
Six months later, the fleet travels: 240,000 km and experiences 12 qualifying failures.
The calculation is: 240,000 ÷ 12 = 20,000 km
MTBF has improved from: 6,000 km to 20,000 km between failures
What Does This Mean for the Company?
Vehicles are operating much longer between failures.
This can indicate:
Improved reliability
Better preventative maintenance
More effective repairs
Better vehicle selection
Improved driver behaviour
More appropriate vehicle replacement
The company may also experience:
Less downtime
Lower emergency repair costs
Better customer service
More predictable operations
Improved fleet productivity
How the Three Maintenance Metrics Work Together
Vehicle Downtime Percentage, PM Compliance and MTBF become much more useful when management looks at them together.
Imagine a company reports:
PM Compliance: 68%
MTBF: 7,000 km
Vehicle Downtime: 14%
These numbers tell a story. Low PM Compliance suggests that scheduled maintenance is frequently being missed. At the same time, vehicles are experiencing failures relatively frequently. Those failures are contributing to high downtime.
The possible relationship is:
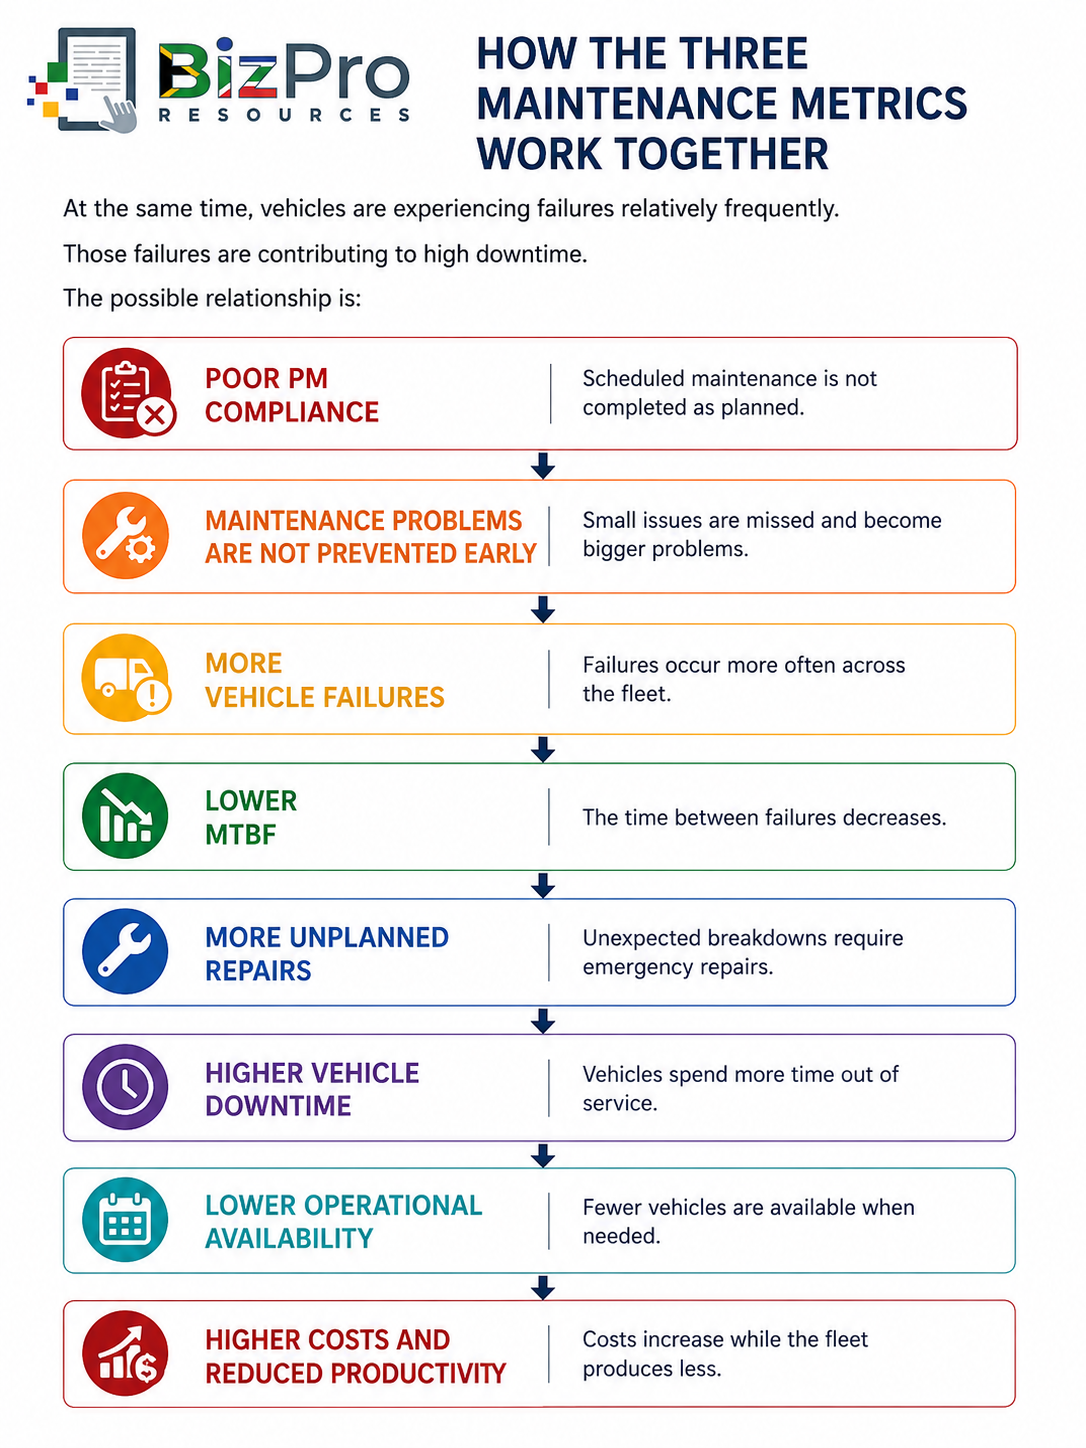
Management now has a clear area to investigate.
Example: Improving Maintenance Across a Fleet
Consider a plumbing business operating 20 service bakkies.
At the beginning of the year, management records:
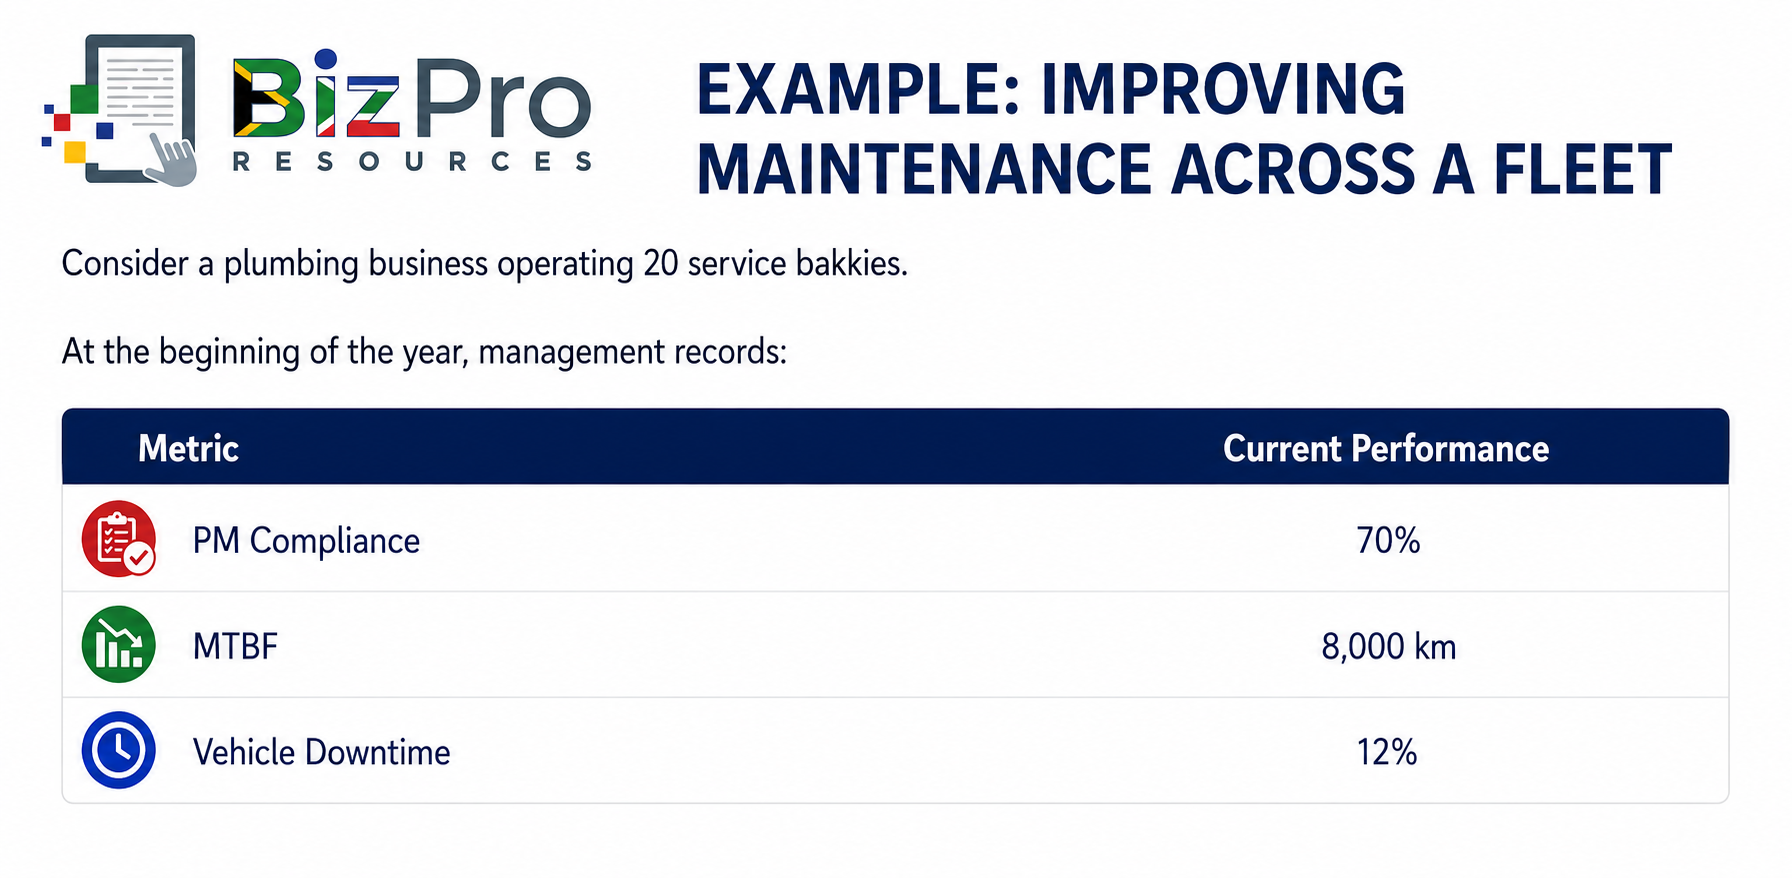
The company regularly experiences breakdowns. Plumbers sometimes arrive late because vehicles are unavailable.
Management introduces:
Scheduled maintenance reminders
Weekly vehicle inspections
Driver defect reporting
Approved maintenance suppliers
Faster repair approvals
Monthly reliability reviews
Maintenance records for every vehicle
Six months later:
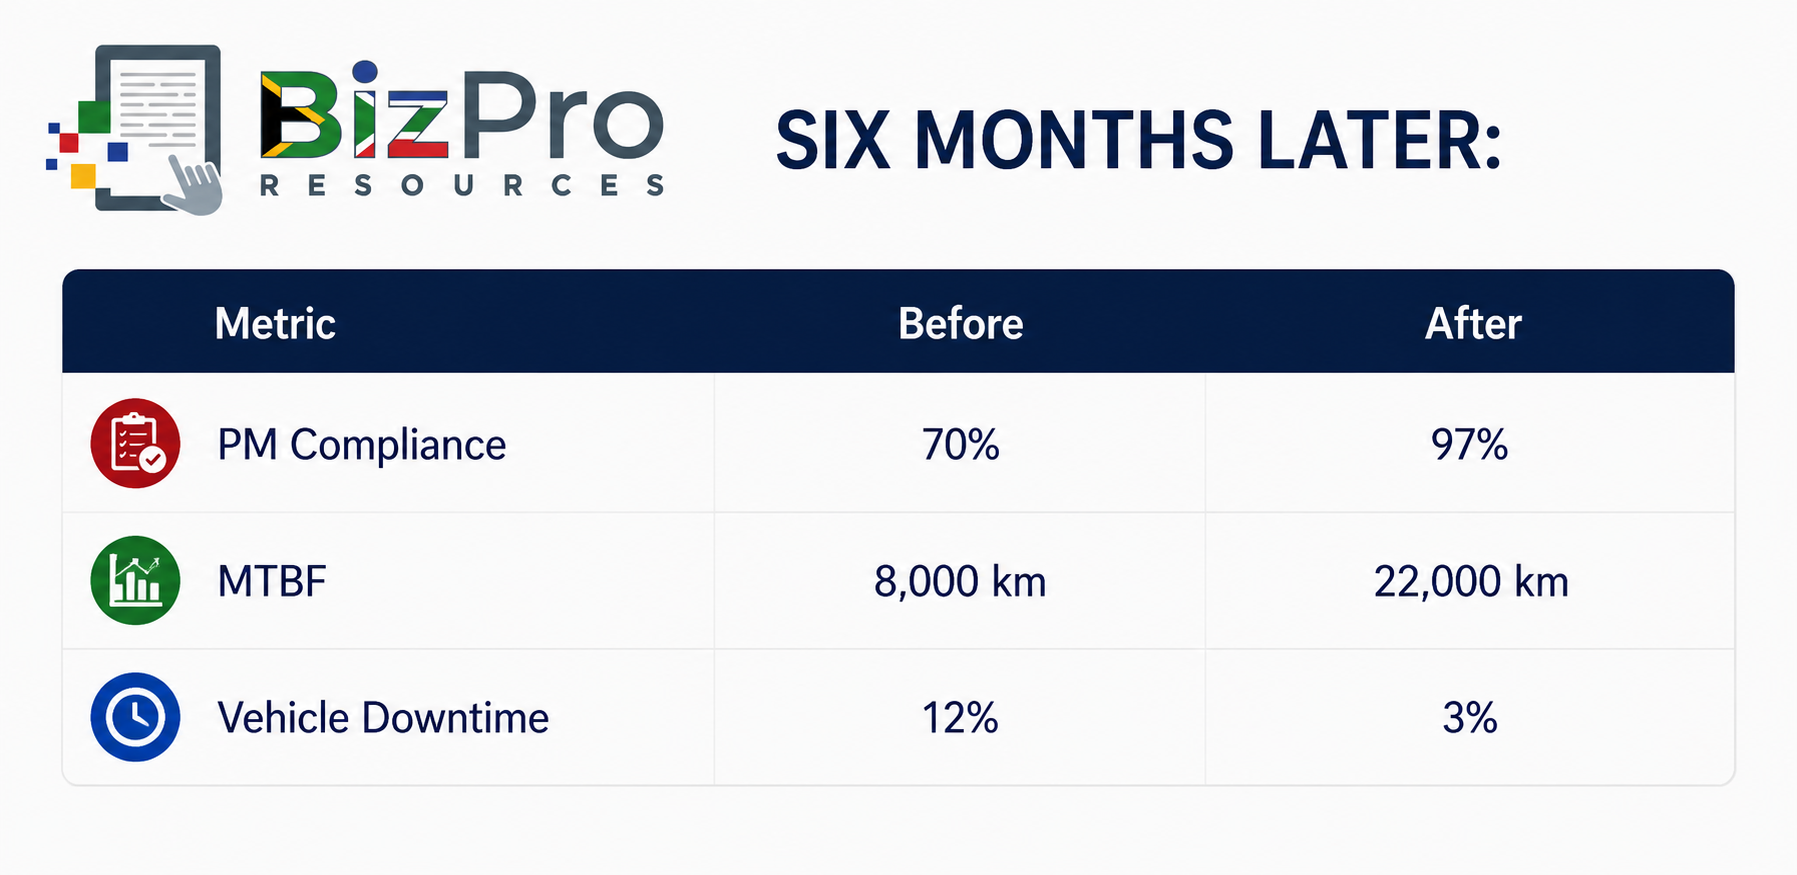
This is a much stronger maintenance picture.:
Preventative maintenance is being completed more consistently.
Vehicles are travelling much further between failures.
Downtime has decreased substantially.
The result is not simply "better maintenance." It can improve the entire business operation.
The Financial Impact of Better Vehicle Availability
Availability has a financial value.
Suppose a technician and vehicle together generate approximately: R4,000 of productive work per working day.
If vehicle breakdowns cause the technician to lose 3 days per month the potential productivity impact is 3 × R4,000 = R12,000 per month.
Over a year: R12,000 × 12 = R144,000.
And that is only one vehicle. If similar problems occur across five vehicles, the potential impact becomes much larger.
This is why maintenance should not only be viewed as a cost.
Effective maintenance helps protect the company's ability to generate revenue.
Build a Simple Maintenance and Availability Dashboard
Businesses can track these three metrics in a simple monthly dashboard.
For example:
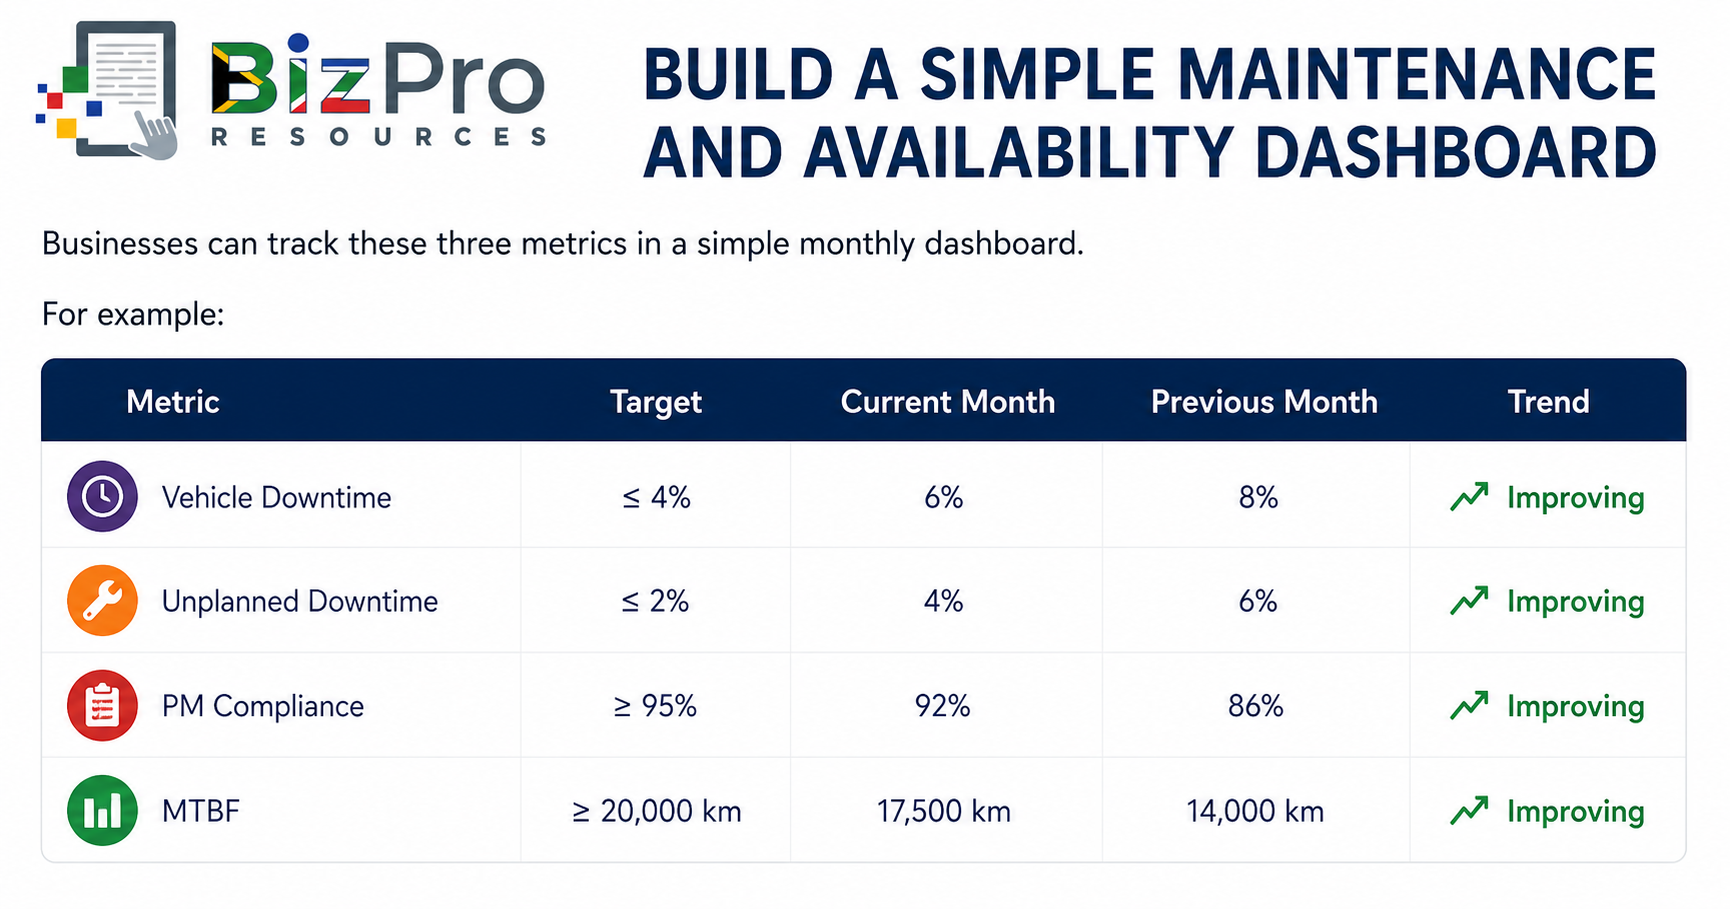
The fleet has not yet reached all its targets. However, all three metrics are moving in the right direction.
That tells management something important: The maintenance improvements may be working.
The company should continue monitoring the trend.
Look Beyond Fleet Averages
Fleet averages can hide individual problems. Suppose the company's overall downtime percentage is: 4%. That may appear acceptable.
But individual vehicle performance shows:
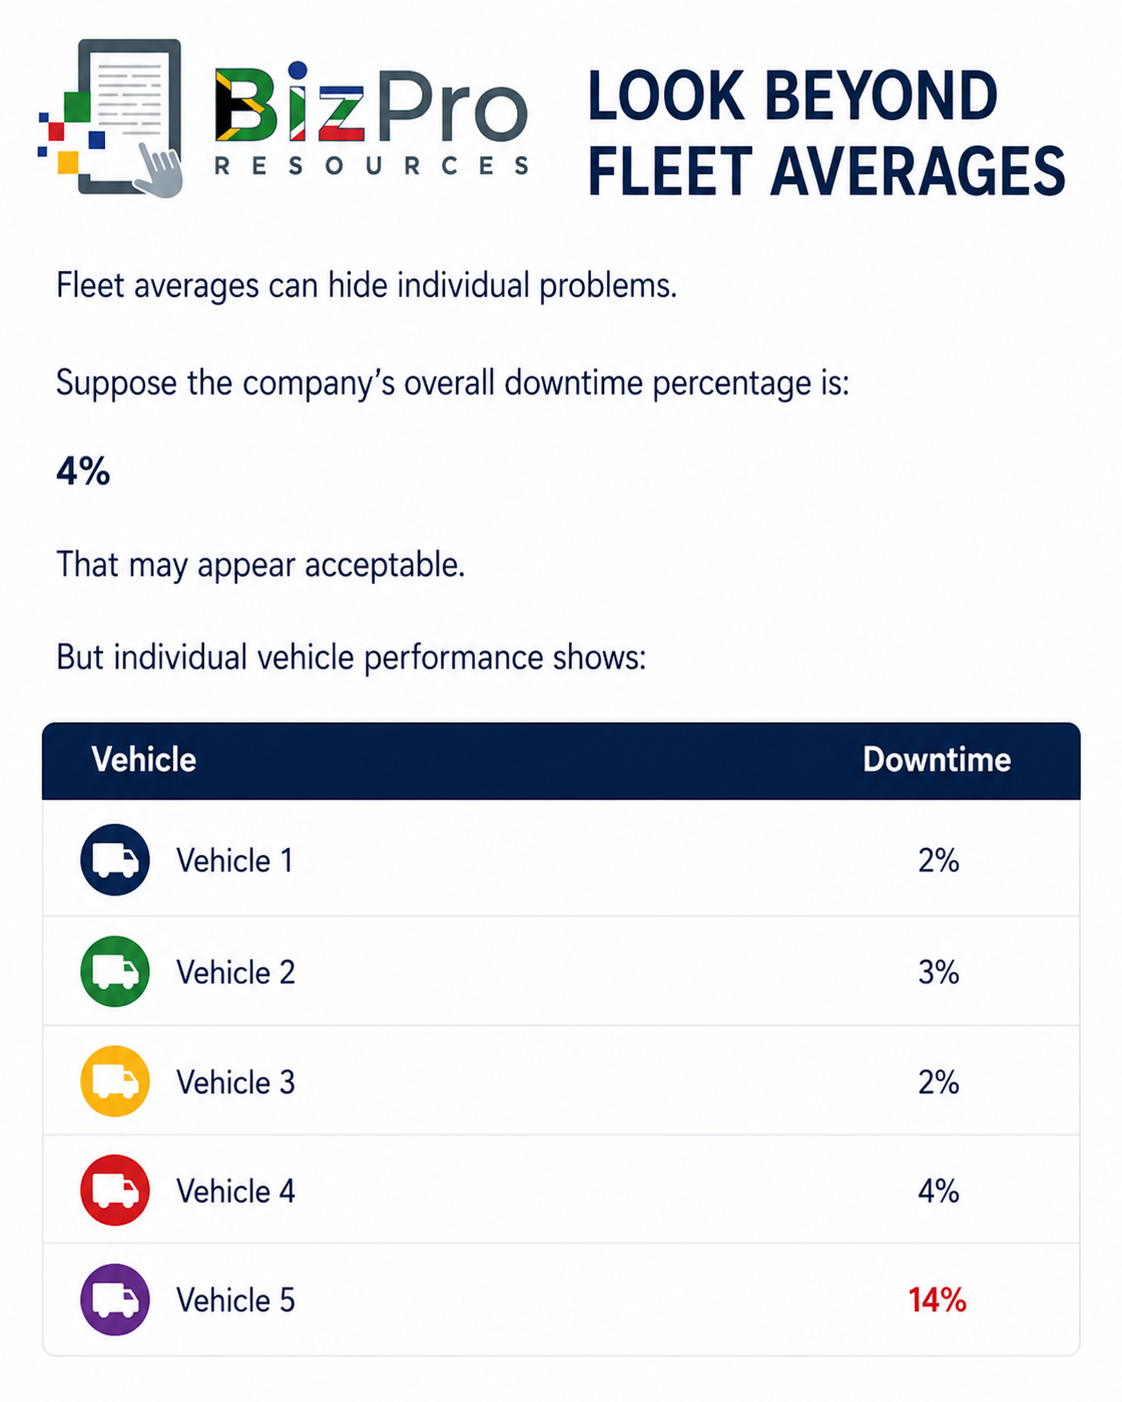
Vehicle 5 is clearly a problem. If management only looks at the fleet average, this vehicle may not receive enough attention.
The same principle applies to MTBF.
Management should therefore monitor: Fleet-level performance and Individual vehicle performance.
Track the Reason for Every Breakdown
Counting breakdowns is useful. Understanding them is more useful. Every significant failure should ideally be categorised.
For example:
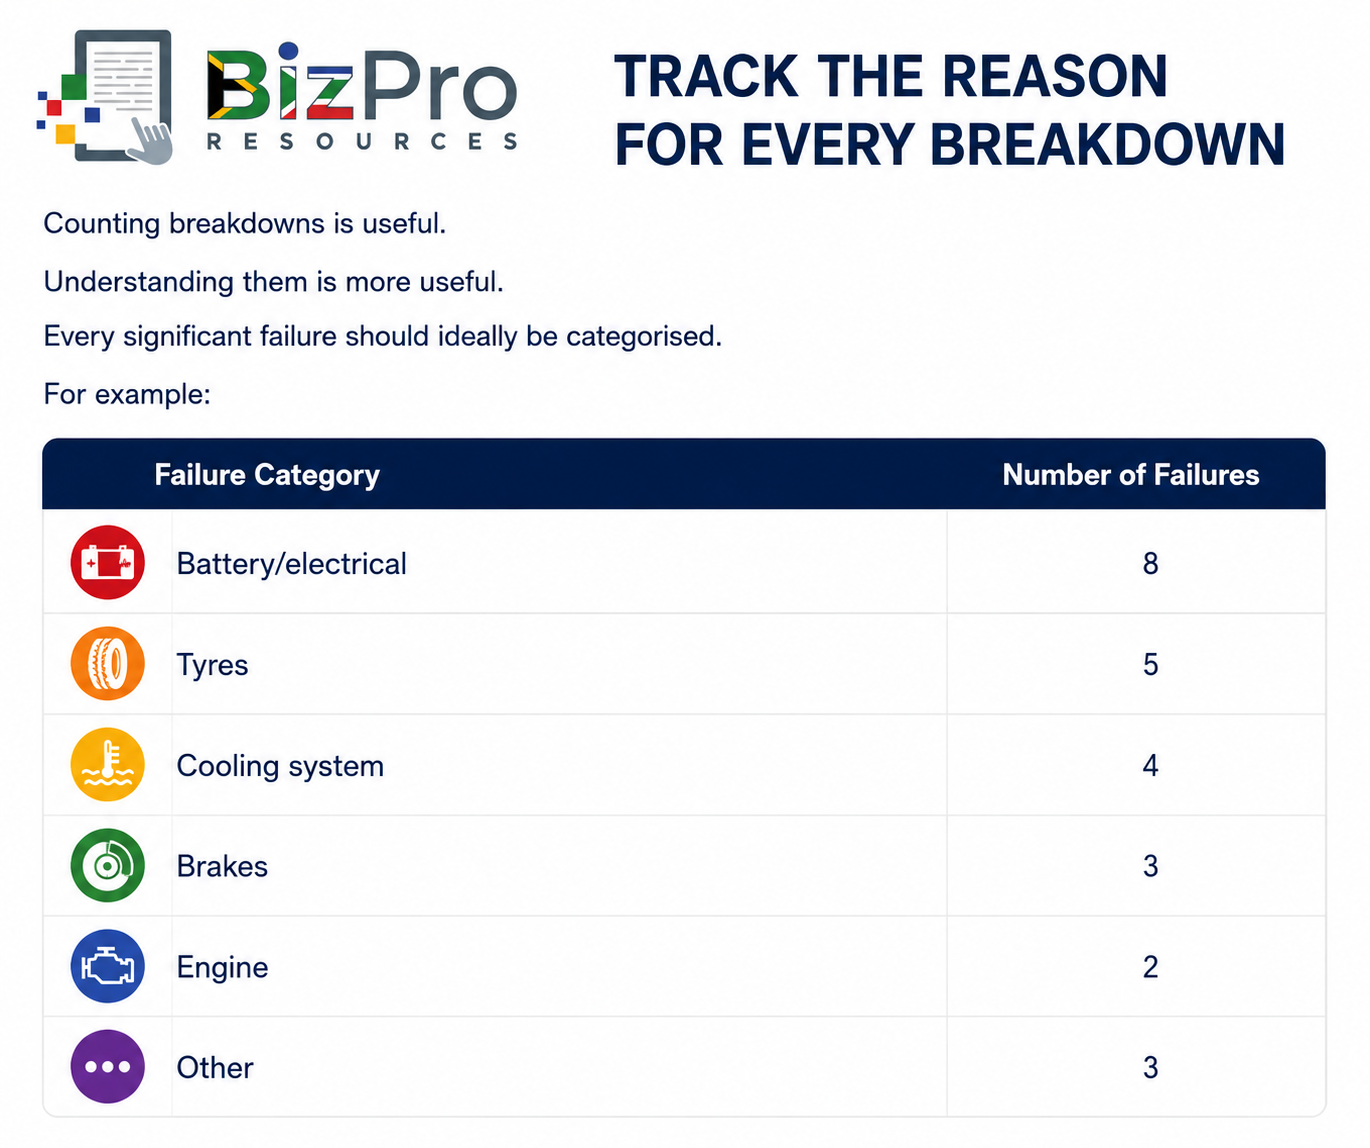
This allows management to identify patterns.
If battery failures suddenly increase, management can investigate:
Battery quality
Replacement intervals
Charging systems
Vehicle usage
Supplier quality
If tyre failures dominate, management can investigate:
Tyre pressure
Wheel alignment
Driver behaviour
Road conditions
Vehicle loads
Tyre selection
Fleet metrics should therefore lead to deeper questions.
Do Not Punish Drivers for Reporting Problems
A maintenance system depends on drivers reporting defects.
Drivers are often the first people to notice:
Strange noises
Warning lights
Steering problems
Brake changes
Tyre damage
Fluid leaks
Engine performance changes
If drivers believe they will be blamed for reporting problems, they may stay quiet. A small problem can then become a major failure. Businesses should encourage drivers to report vehicle defects early.
The message should be: Report problems early so that we can fix them before they become expensive or dangerous.
Driver accountability is still important. Negligence, reckless driving and vehicle abuse should be addressed.
But genuine defect reporting should be encouraged.
Maintenance Records Matter
Reliable metrics depend on reliable information.
For each vehicle, the business should ideally record:
Vehicle identification
Current kilometre reading
Service dates
Service kilometre readings
Scheduled maintenance
Completed maintenance
Breakdown dates
Failure type
Repair costs
Downtime hours or days
Parts replaced
Workshop or supplier
Return-to-service date
Even a small business can start with a spreadsheet.
As the fleet grows, specialised fleet management software or telematics systems may make this process easier.
The important point is to start collecting consistent information.
Use the Metrics to Make Vehicle Replacement Decisions
Maintenance metrics can also help management decide when a vehicle should be replaced. Imagine a seven-year-old bakkie. Its finance agreement has been fully paid.
Management therefore considers it a "cheap vehicle."
But the data shows:
Downtime: 18%
PM Compliance: 100%
MTBF: 4,500 km
Repair costs increasing every quarter
This tells management something important:
The company is maintaining the vehicle properly, but it is still failing frequently.
The problem may no longer be poor maintenance.
The vehicle may simply be reaching the end of its economical working life.
A replacement vehicle might have:
Higher monthly finance costs
Lower repair costs
Less downtime
Better fuel economy
Higher reliability
This is where maintenance metrics should be considered together with Total Cost of Ownership.
Keeping an old vehicle because it is paid off is not automatically the cheapest option.
What Does Good Maintenance Performance Look Like?
There is no single downtime percentage, PM Compliance target or MTBF figure that is appropriate for every fleet:
A heavy truck travelling long distances operates under different conditions from a small urban delivery vehicle.
A security response vehicle has different operational demands from an accountant's company car.
Management should establish appropriate targets based on:
Vehicle type
Vehicle age
Manufacturer requirements
Operating environment
Workload
Historical performance
Safety requirements
Business needs
Good maintenance management generally means the company can answer questions such as:
Which vehicles experience the most downtime?
How much downtime is planned?
How much downtime is unplanned?
Why are vehicles unavailable?
Are scheduled services being completed on time?
Which vehicles regularly miss maintenance?
How frequently are vehicles failing?
Which vehicles have the lowest MTBF?
Which components fail most frequently?
Are maintenance improvements actually reducing breakdowns?
Which vehicles should be considered for replacement?
If management cannot answer these questions, the fleet maintenance programme may not be measured closely enough.
Turning Maintenance Data into Management Action
A practical process is:
1. Measure Availability
Record when vehicles are unavailable and why.
2. Measure Maintenance Compliance
Track whether scheduled preventative maintenance is completed on time.
3. Measure Reliability
Calculate how long or how far vehicles operate between failures.
4. Compare
Compare:
Similar vehicles
Branches
Months
Years
Internal targets
5. Investigate Poor Performance
Ask questions such as: Why does Vehicle 12 have twice as much downtime as similar vehicles?
or: Why has MTBF decreased for our delivery vans?
6. Correct the Cause
Possible actions could include:
Better maintenance
Driver training
Changing suppliers
Improving repair quality
Replacing unreliable components
Changing maintenance intervals
Replacing ageing vehicles
7. Measure Again
Check whether the action improved the metric.
This creates a continuous improvement process.
Final Thoughts
A fleet should not only be affordable to operate. It also needs to be reliable and available when the business needs it.
Three maintenance and availability metrics provide management with a practical way to measure this:
Vehicle Downtime Percentage shows how much potential operating time is being lost because vehicles are unavailable.
Preventative Maintenance Compliance shows whether scheduled maintenance is actually being completed when required.
Mean Time Between Failures shows how reliably vehicles operate between breakdowns or qualifying failures.
Each metric provides useful information on its own. Together, they provide a much stronger picture:
Poor PM Compliance can contribute to more failures.
More failures can reduce MTBF.
Frequent failures can increase downtime.
Higher downtime can reduce productivity, disrupt customers and increase operating costs.
The opposite can also happen:
Better preventative maintenance can improve reliability.
Improved reliability can increase the time between failures.
Fewer failures can reduce unplanned downtime.
Lower downtime can increase vehicle availability and business productivity.
The objective is therefore not simply to repair vehicles when they break.
It is to build a fleet maintenance system that helps prevent failures, improve reliability and keep vehicles productively on the road.
For a small or medium-sized business, this can have a direct impact on costs, customer service, employee productivity and profitability.
A well-maintained fleet is not simply a fleet with clean service records. It is a fleet that is safe, reliable, available and ready to work when the business needs it.
Related Articles in the Fleet Management Metrics Series
Fleet Cost Control Metrics: How to Measure and Reduce Vehicle Operating Costs
Fleet Utilization and Safety Metrics: Measuring Vehicle Use, Driver Safety and Compliance
AI Disclaimer
AI Tools were used to assist with research. Remember to always cross-check everything that you read.


