
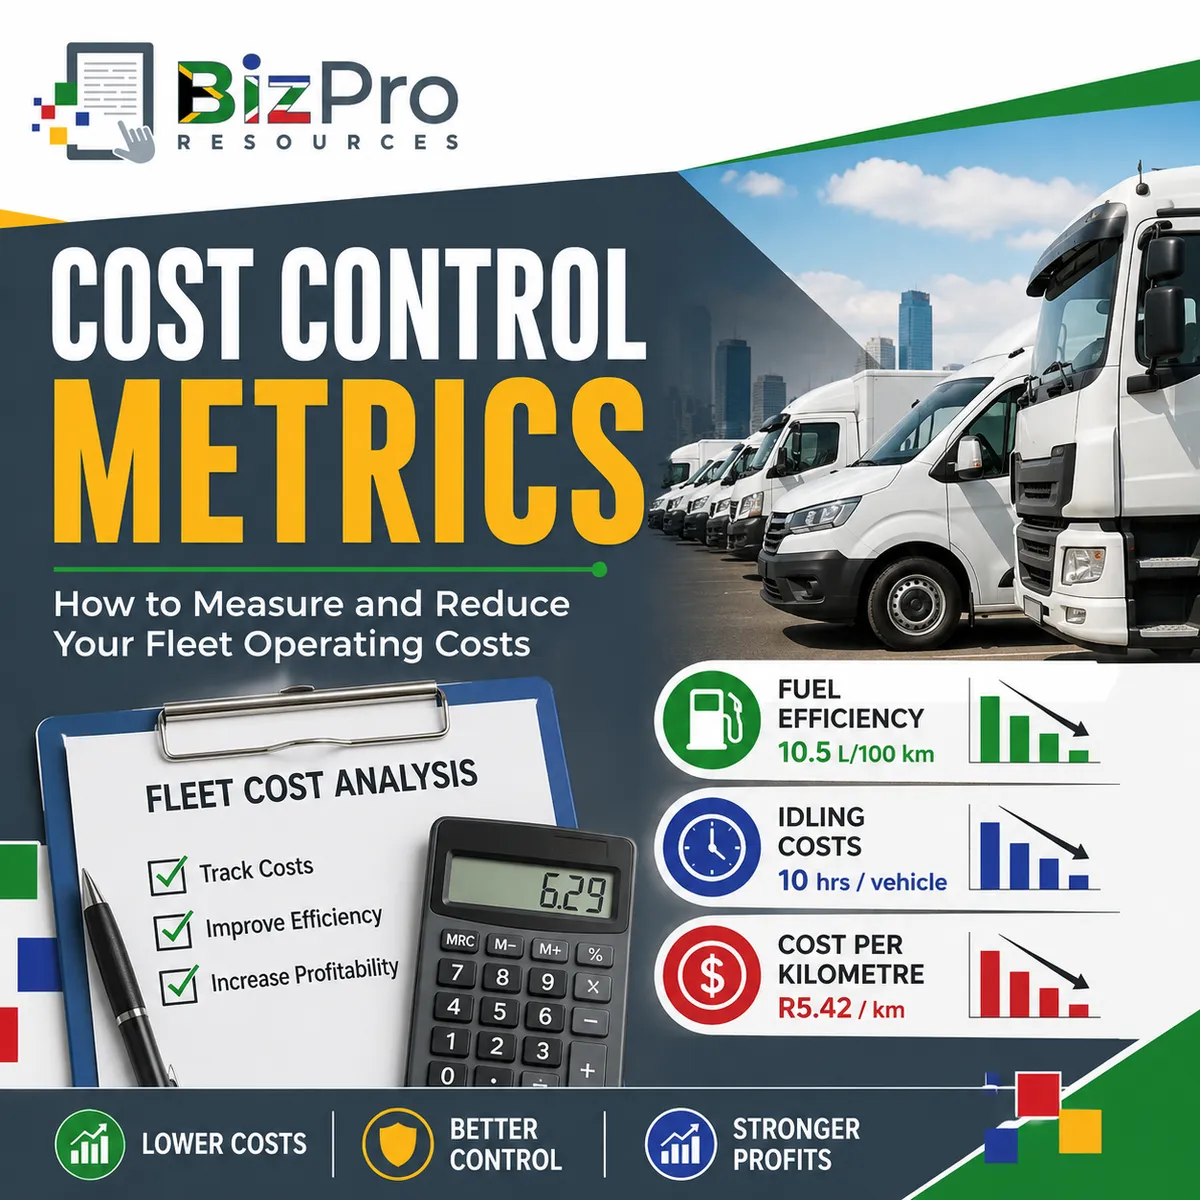
Fleet Cost Control Metrics: How to Measure and Reduce Vehicle Operating Costs
Article #1 of #3 in the Fleet Management Metrics Series
Introduction
Running a fleet of vehicles can be expensive.
Whether your business operates two delivery vehicles, ten service bakkies, a fleet of security response vehicles, or dozens of trucks, the vehicles continuously consume money.
There are the obvious expenses:
Fuel
Vehicle instalments
Repairs
Tyres
Insurance
But there are also costs that are easier to overlook:
Depreciation
Driver time lost because of breakdowns
Excessive idling
Unplanned maintenance
Licensing and administration
Replacement vehicles
Poor fuel consumption
Vehicles travelling unnecessary kilometres
If these costs are not measured properly, a business owner may know how much money is being spent on the fleet without knowing whether the fleet is operating efficiently.
This is where fleet cost control metrics become important.
Three particularly useful metrics are:
Total Cost per Kilometre (CPK)
Total Cost of Ownership (TCO)
Fuel Efficiency and Idling Costs
Together, these metrics answer three important questions:
How much does it cost us to operate our vehicles?
How much does each vehicle really cost us over its working life?
Are we wasting money through poor fuel efficiency and unnecessary idling?
For South African businesses, we will mainly use cost per kilometre (CPK) in this article. Businesses operating in countries where distance is measured in miles can use the same principle to calculate cost per mile (CPM).
Why Fleet Cost Control Matters
Fleet expenses can quietly become one of the largest operating costs in a business.
Imagine a company with 20 service vehicles.
If poor route planning, excessive idling, inefficient driving and unnecessary repairs increase the operating cost of each vehicle by only R1,000 per month, the business is spending:
20 vehicles × R1,000 = R20,000 extra per month
Over a year: R20,000 × 12 = R240,000
That is R240,000 that could potentially have been invested elsewhere in the business.
The problem is that these unnecessary costs are often spread across fuel accounts, maintenance invoices, insurance premiums, vehicle finance payments and other expenses.
Management therefore needs metrics that bring these costs together and make them easier to understand.
1. Total Cost per Kilometre (CPK)
What Is Total Cost per Kilometre?
Total Cost per Kilometre measures how much it costs the business, on average, for a vehicle or fleet to travel one kilometre.
It is one of the simplest and most useful fleet management metrics because it converts many different fleet expenses into one understandable number.
For example: Our fleet costs us R6.20 for every kilometre travelled.
Management can then compare this figure:
Between vehicles
Between branches
Between vehicle types
Between months
Between years
Against budgets
Against historical performance
If the cost per kilometre begins increasing significantly, management can investigate why.
What Costs Should Be Included?
A useful CPK calculation should include the costs associated with operating the fleet.
Depending on the business, these may include:
Fuel
Petrol or diesel consumed by the vehicles.
Maintenance and Repairs
Including:
Services
Mechanical repairs
Replacement parts
Breakdown repairs
Labour
Tyres
Tyres can be a significant expense, particularly for high-mileage vehicles and commercial fleets.
Insurance
The cost of insuring fleet vehicles.
Finance or Lease Costs
Monthly vehicle instalments or leasing costs.
Licensing and Registration
Vehicle licence renewals and related costs.
Depreciation
The reduction in the value of vehicles as they age and accumulate kilometres.
Tracking and Fleet Management Systems
GPS tracking, telematics and fleet management software.
Other Direct Fleet Costs
These could include:
Toll fees
Cleaning
Roadside assistance
Vehicle inspections
Fleet administration
Businesses do not necessarily have to include exactly the same expenses as another company.
What matters is that the business decides what will be included and then uses the same calculation consistently.
How Is Total Cost per Kilometre Calculated?
The basic formula is: Total Cost per Kilometre = Total Fleet Operating Costs ÷ Total Kilometres Travelled
For example, suppose a business has 10 vehicles:
During one month, the fleet travels a total of 35,000 km.
The total fleet costs for the month are:
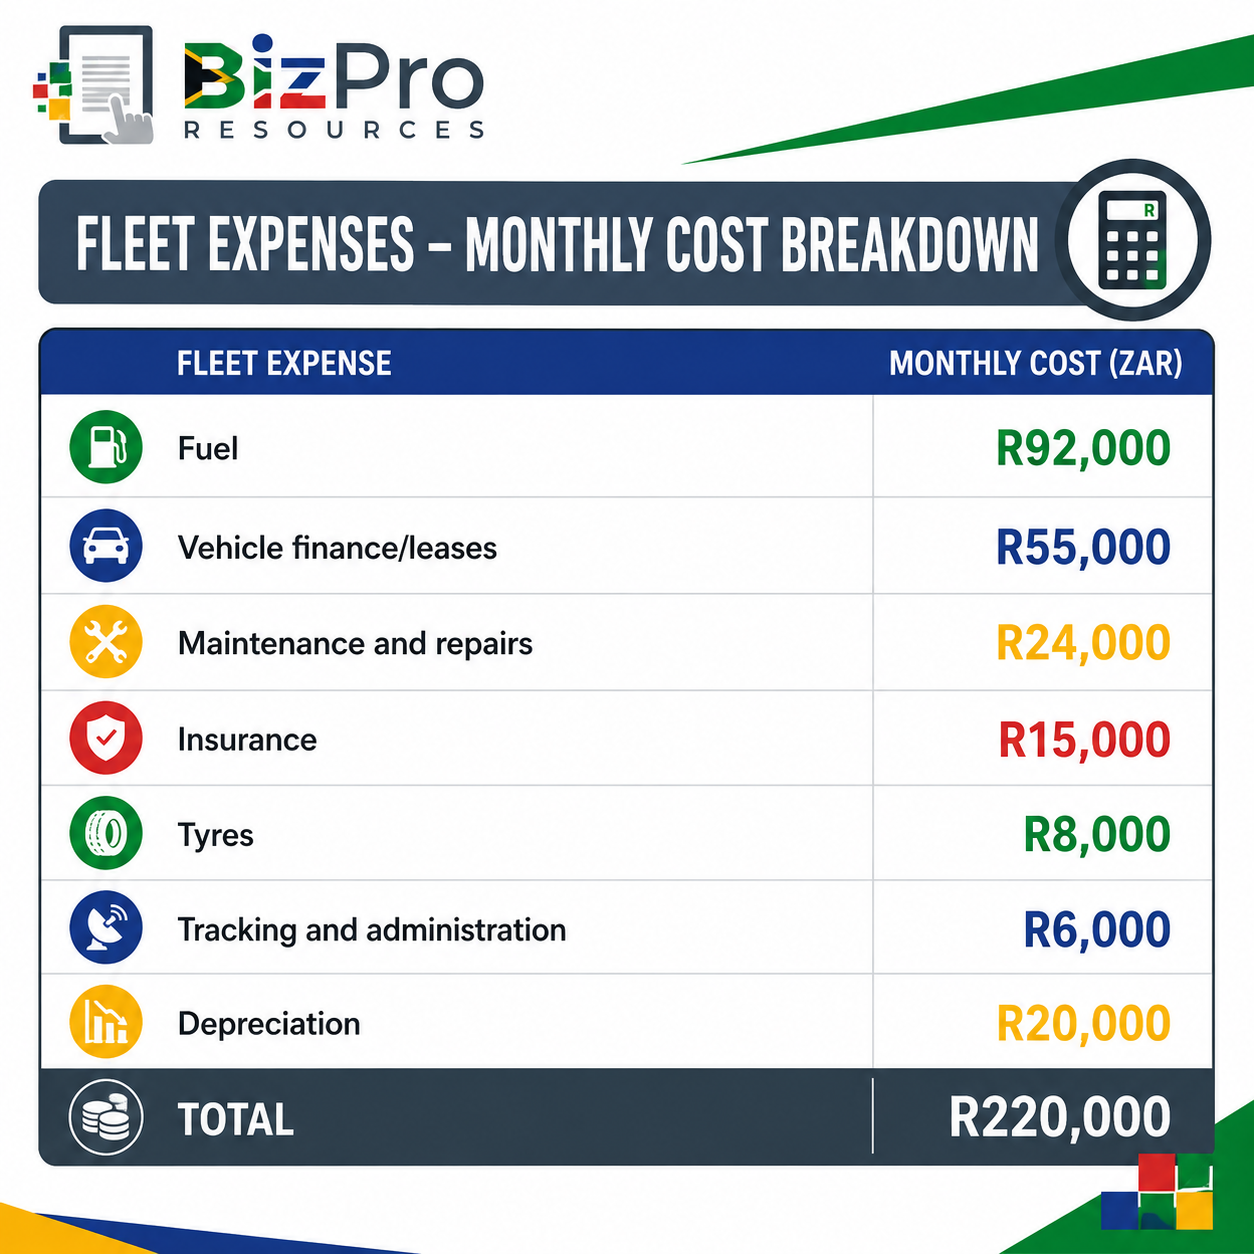
The calculation is: R220,000 ÷ 35,000 km = R6.29 per km.
The fleet's Total Cost per Kilometre is therefore: R6.29/km
This means that, based on the costs included in the calculation, every kilometre travelled costs the company approximately R6.29.
Example of Poor Cost per Kilometre Performance
Consider a plumbing company operating 12 service bakkies.
Management calculates the following:
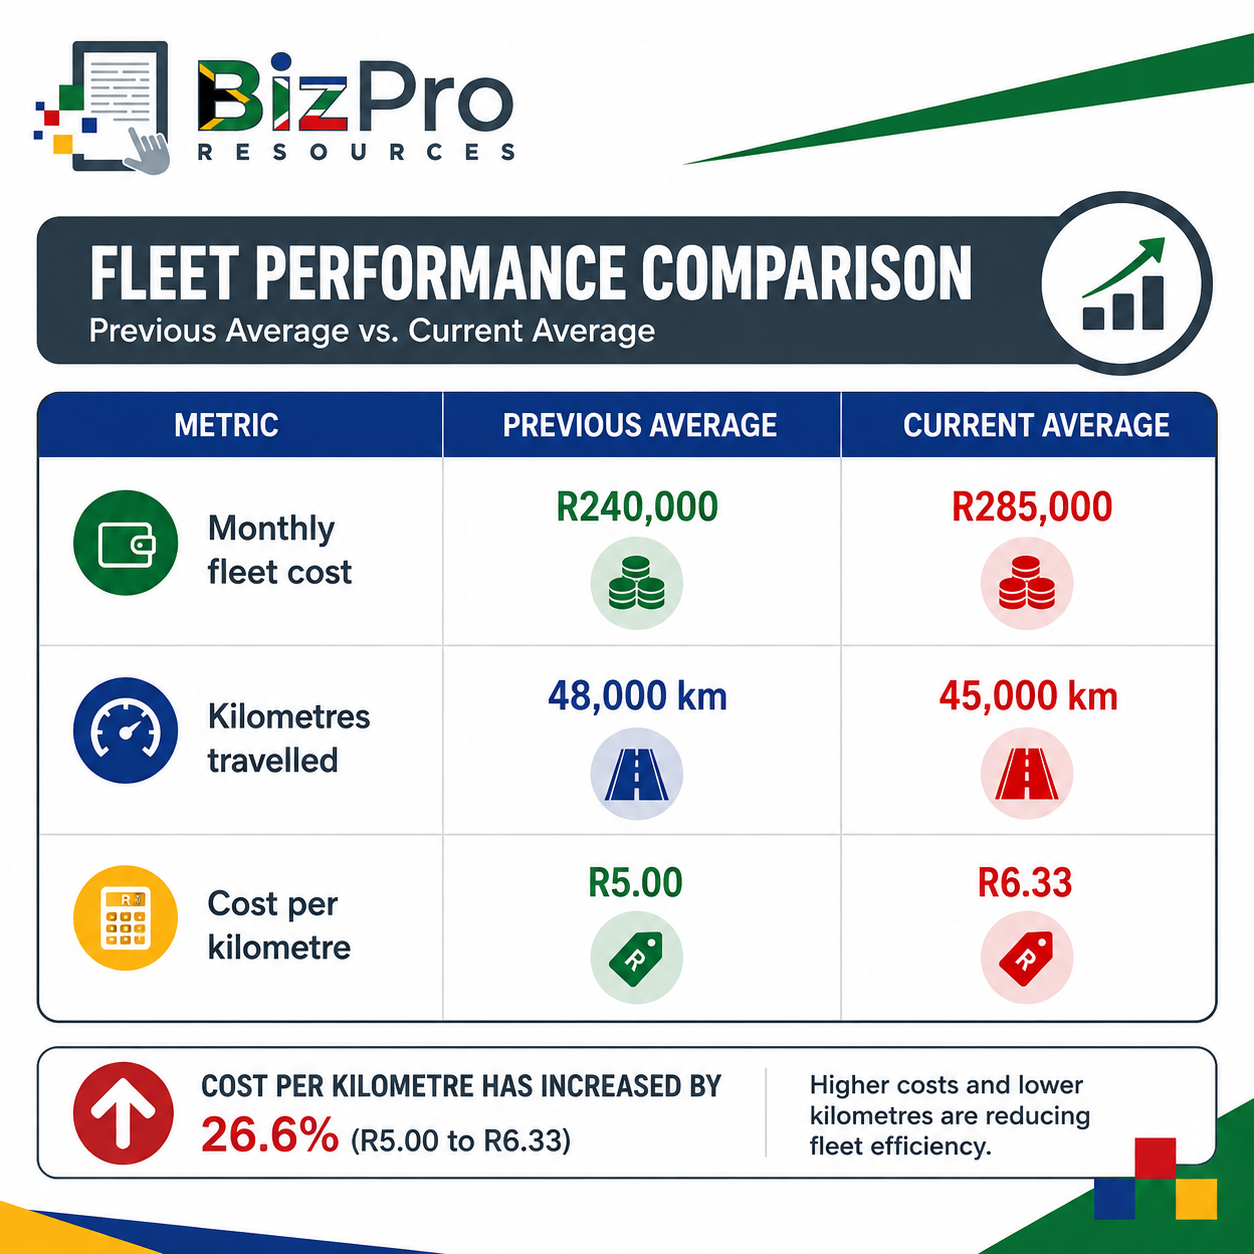
The fleet is travelling fewer kilometres, but its total cost has increased.
CPK has increased from: R5.00 to R6.33 per kilometre.
That is an increase of approximately: .26.6%.
This should immediately attract management attention.
What Could This Mean for the Company?
The increase could be caused by:
Higher fuel prices
Poor fuel efficiency
Excessive idling
More breakdowns
Older vehicles requiring frequent repairs
Poor tyre management
Accidents
Inefficient routes
Underutilised vehicles
Rising insurance costs
High finance costs
The CPK metric does not automatically tell management what the problem is. It tells management that there may be a problem worth investigating.
That is an important distinction.
Example of Good Cost per Kilometre Performance
Suppose the same company introduces:
Better route planning
Driver fuel-efficiency training
Preventative maintenance
Monthly tyre pressure inspections
Idling alerts
Better vehicle utilisation
Six months later:
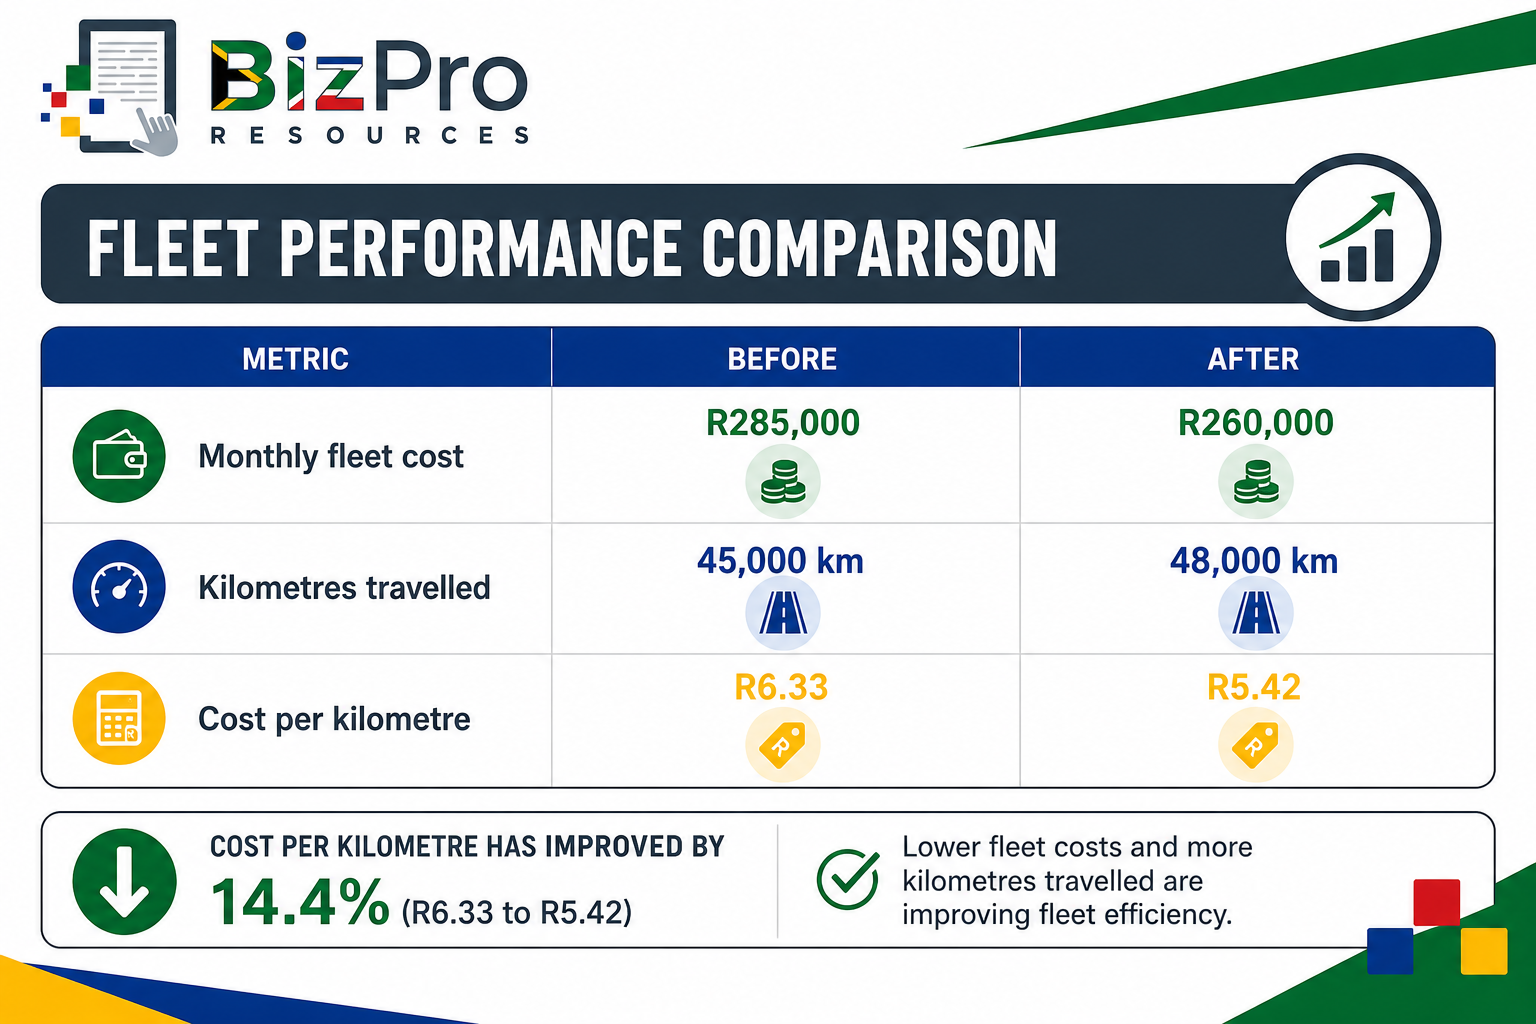
The fleet is now completing more kilometres while spending less money overall.
What Does This Mean for the Company?
It suggests that the fleet has become more cost-efficient.
The business may now be:
Using fuel more efficiently
Reducing unnecessary travel
Experiencing fewer expensive breakdowns
Managing drivers more effectively
Using vehicles more productively
A lower CPK can ultimately help the company improve its profit margins.
Do Not Look at CPK in Isolation
A falling CPK is usually positive, but management should understand why it changed.
For example, imagine a vehicle has not been serviced when required.
Maintenance expenditure temporarily decreases.
This could make CPK look better.
But delaying maintenance could result in a major mechanical failure later.
Similarly, increasing vehicle kilometres can sometimes reduce certain fixed costs per kilometre, but excessive vehicle use may accelerate wear.
The objective is therefore not simply:
Get CPK as low as possible.
The objective should be:
Operate the fleet safely, reliably and productively at a sustainable cost.
2. Total Cost of Ownership (TCO)
What Is Total Cost of Ownership?
The purchase price of a vehicle does not tell you what that vehicle actually costs the business.
Suppose two vehicles are available:
Vehicle A: R500,000
Vehicle B: R550,000
Vehicle A looks cheaper.
But what happens if Vehicle A:
Uses more fuel
Requires more repairs
Has expensive parts
Experiences more downtime
Loses its resale value faster
Vehicle B may actually be the less expensive vehicle over five years. This is what Total Cost of Ownership (TCO) helps management understand.
TCO estimates the total financial cost of owning and operating an asset over a defined period.
What Should Be Included in TCO?
A vehicle's TCO can include:
Purchase or Acquisition Cost
The original purchase price or relevant lease/finance cost.
Finance Costs
Interest and financing charges.
Fuel
Fuel consumed during the vehicle's operating life.
Maintenance
Scheduled servicing and preventative maintenance.
Repairs
Unplanned mechanical and electrical repairs.
Tyres
Replacement tyres, repairs and related expenses.
Insurance
Insurance premiums over the ownership period.
Licensing
Vehicle licensing and registration costs.
Fleet Technology
Tracking devices, telematics and related systems.
Other Operating Costs
Where relevant, these may include:
Roadside assistance
Cleaning
inspections
Modifications
Accessories
Fleet administration
Resale Value
This is important.
If the company eventually sells the vehicle, the money recovered from the sale reduces the total cost of ownership.
How Is Total Cost of Ownership Calculated?
A simplified formula is: TCO = Acquisition Cost + Operating Costs + Maintenance Costs + Other Ownership Costs − Resale Value
Suppose a company buys a delivery vehicle and keeps it for five years.
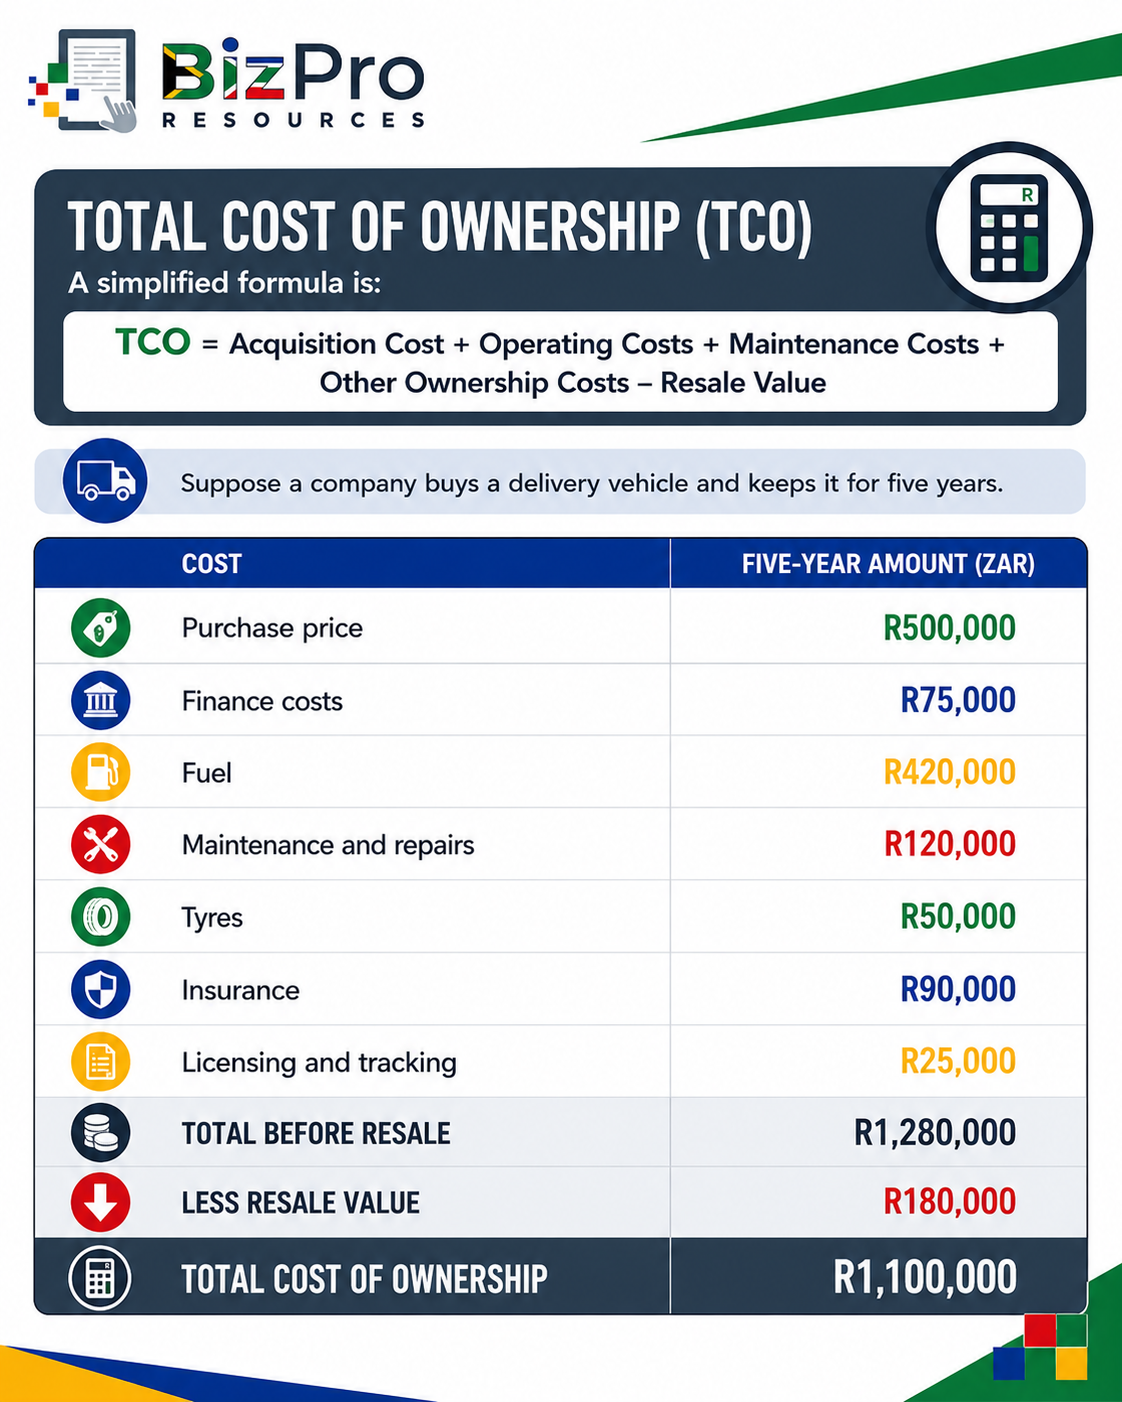
The vehicle's five-year TCO is therefore: R1.1 million. The R500,000 purchase price tells only part of the story.
The business ultimately spends much more than the original purchase price to own and operate that vehicle.
Comparing Vehicles Using TCO
TCO becomes particularly useful when deciding which vehicles to purchase.
Suppose a security company is comparing two response vehicles.
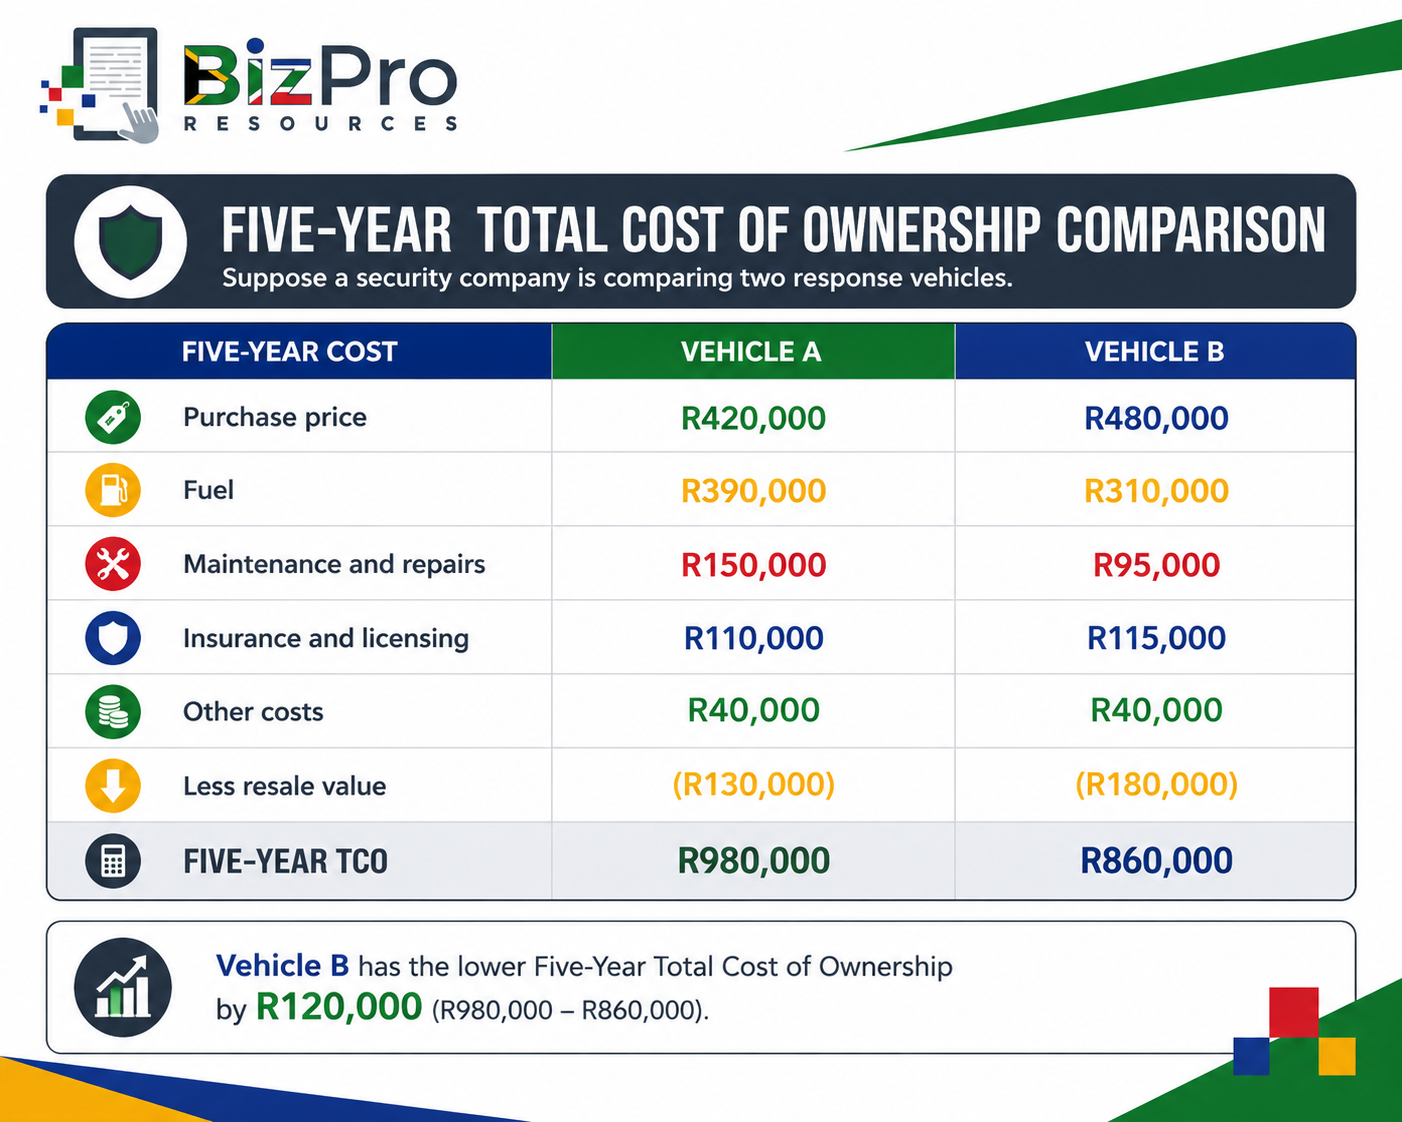
Vehicle B costs R60,000 more to purchase. However, over five years, Vehicle B costs approximately R120,000 less to own and operate.
If management looked only at the purchase price, it could make the wrong decision.
Example of Poor TCO Performance
Imagine a business purchased several inexpensive used vehicles because management wanted to reduce capital expenditure.
Initially, the decision appears sensible.
After three years, management reviews the costs.
One vehicle shows:
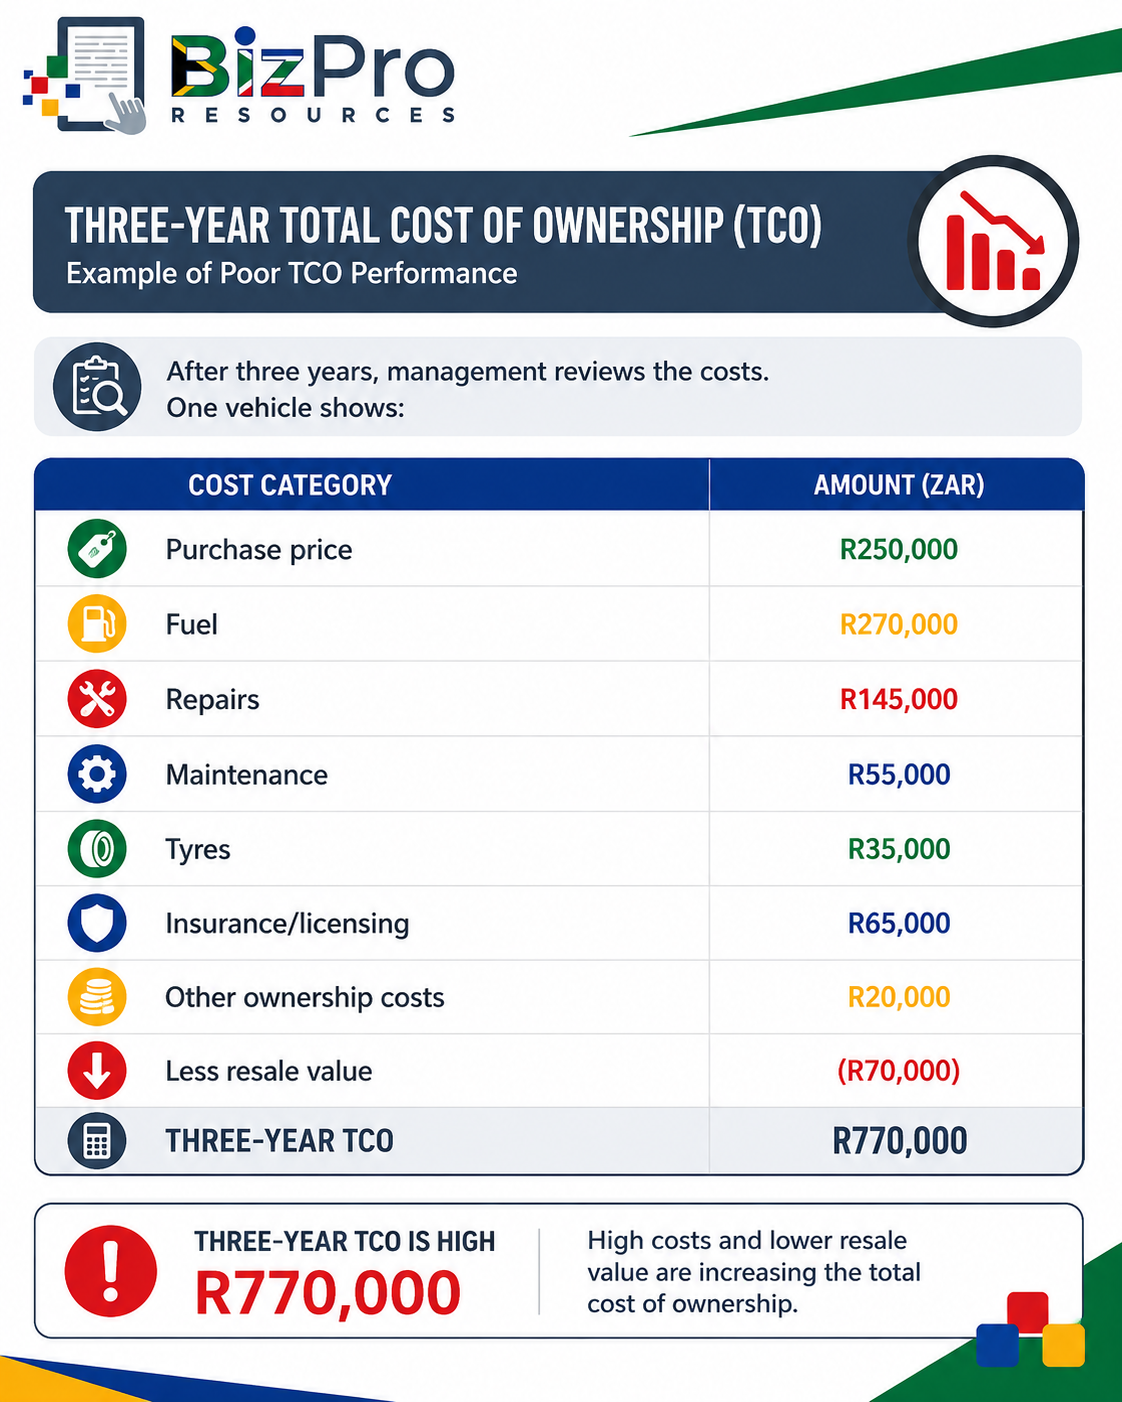
The business paid only R250,000 for the vehicle, but the three-year TCO has reached R770,000.
What Does This Mean for the Company?
The vehicle may be inexpensive to buy but expensive to own.
High TCO can reduce profitability through:
Excessive repair costs
Poor fuel economy
Frequent tyre replacement
High downtime
Low resale value
Increasing maintenance requirements
Management may need to consider whether keeping the vehicle is still economically sensible.
Example of Good TCO Performance
Now consider another vehicle.
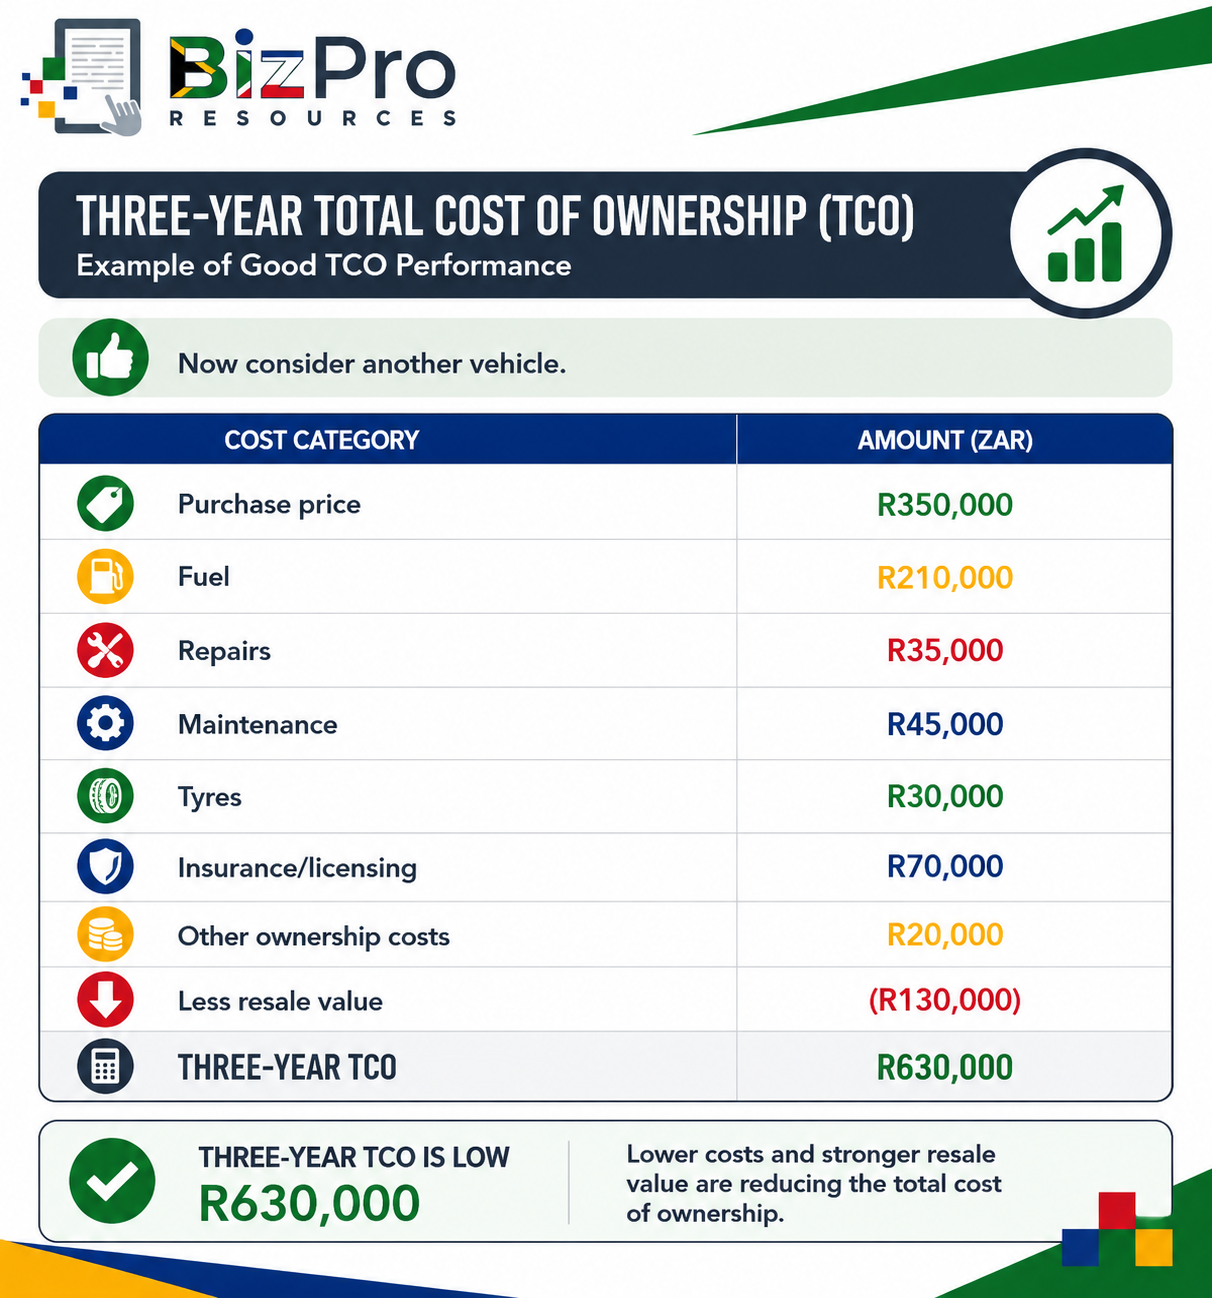
This vehicle originally cost R100,000 more to purchase, but its three-year TCO is R140,000 lower.
What Does This Mean for the Company?
The more expensive purchase may actually have been the better financial decision.
The vehicle appears to provide:
Better fuel economy
Lower repair costs
Better reliability
Stronger resale value
This is why fleet purchasing decisions should not be based only on purchase price.
TCO Can Help Decide When to Replace a Vehicle
TCO is also useful when deciding how long vehicles should remain in the fleet. An older vehicle may have no finance instalment, which makes it appear inexpensive.
However, imagine that it now requires:
R8,000 repairs this month
R15,000 repairs next month
Frequent tyre replacement
Increasing fuel consumption
Several days of downtime
At some point, keeping the old vehicle may cost more than replacing it. Management should therefore monitor the economic life of each vehicle, not simply its age.
A useful question is: Are we keeping this vehicle because it is still economical, or simply because it has already been paid for?
3. Fuel Efficiency and Idling Costs
Why Fuel Metrics Matter
Fuel is often one of the largest variable expenses in a vehicle fleet. Small changes in fuel consumption can therefore have a significant financial impact.
For example, suppose a fleet uses: 30,000 litres of fuel per month.
If fuel costs R22 per litre, monthly fuel expenditure is: 30,000 × R22 = R660,000.
A 5% reduction in fuel consumption could represent substantial savings over a year.
That is why fleet managers should monitor both: Fuel efficiency and Idling.
What Is Fuel Efficiency?
Fuel efficiency measures how effectively a vehicle converts fuel into useful travel. In South Africa, fuel consumption is commonly expressed as Litres per 100 kilometres (L/100 km).
Lower consumption generally indicates better fuel efficiency when comparing similar vehicles performing similar work.
For example: 8 L/100 km is more fuel-efficient than 12 L/100 km assuming the vehicles and operating conditions are reasonably comparable.
How Is Fuel Efficiency Calculated?
The formula is: Fuel Consumption = Litres Used ÷ Kilometres Travelled × 100.
Suppose a bakkie travels: 2,500 km and uses: 275 litres.
The calculation is: 275 ÷ 2,500 × 100 = 11 L/100 km.
The vehicle therefore consumes: 11 litres per 100 kilometres.
Another useful measure is kilometres per litre: Kilometres per Litre = Kilometres Travelled ÷ Litres Used.
Using the same example: 2,500 ÷ 275 = 9.09 km/L.
The vehicle travels approximately: 9.09 kilometres per litre.
A business should choose one method and use it consistently.
Example of Poor Fuel Efficiency
Suppose a delivery vehicle normally averages: 10 L/100 km.
Over the last three months, consumption increases to: 13 L/100 km.
The vehicle travels approximately: 4,000 km per month.
At 10 L/100 km, it would use: 400 litres.
At 13 L/100 km, it uses: 520 litres.
That is an additional: 120 litres per month.
If fuel costs R22 per litre: 120 × R22 = R2,640.
The company is spending approximately: R2,640 extra per month on one vehicle.
Across 15 similar vehicles, the potential additional cost could be: R39,600 per month if they all experienced the same deterioration.
What Could Poor Fuel Efficiency Mean?
Possible causes include:
Aggressive acceleration
Excessive speeding
Poor route planning
Heavy traffic
Excessive idling
Incorrect tyre pressure
Overloading
Mechanical problems
Poor servicing
Fuel theft
Inappropriate vehicle selection
Management should investigate the cause rather than automatically blaming the driver.
Example of Good Fuel Efficiency
Suppose the company introduces:
Driver training
Route optimisation
Speed monitoring
Tyre pressure checks
Preventative maintenance
Idling alerts
Average consumption improves from: 13 L/100 km to 10.5 L/100 km.
For the same 4,000 km monthly distance:
At 13 L/100 km: 520 litres
At 10.5 L/100 km: 420 litres
Fuel saved: 100 litres per month
At R22 per litre: R2,200 saved per vehicle per month
For 15 vehicles: R33,000 per month
Over 12 months: R396,000
What Does This Mean for the Company?
Better fuel efficiency can:
Reduce operating costs
Improve profit margins
Reduce CPK
Reduce unnecessary fuel consumption
Help identify better driving behaviour
Improve vehicle management
Even relatively small improvements can become significant when multiplied across an entire fleet.
Idling Costs
What Is Vehicle Idling?
Idling occurs when a vehicle's engine is running while the vehicle is stationary. Some idling is unavoidable.
For example:
Waiting briefly in traffic
Operating equipment that requires the engine
Certain emergency or operational situations
But unnecessary idling can waste significant amounts of fuel.
Examples could include drivers:
Leaving engines running during deliveries
Waiting outside customer premises with the engine running
Idling during lunch breaks
Leaving vehicles running while completing paperwork
Starting vehicles long before departure
One occurrence may seem insignificant.
Across dozens of vehicles and hundreds of working days, it can become expensive.
How Are Idling Costs Calculated?
A simple formula is: Idling Cost = Idling Hours × Fuel Burn per Idling Hour × Fuel Price.
Suppose a vehicle idles for: 25 hours per month and uses approximately 1.5 litres per idling hour:
At a fuel price of: R22 per litre
Fuel wasted is: 25 × 1.5 = 37.5 litres
The cost is: 37.5 × R22 = R825 per month
That does not seem enormous for one vehicle.
But consider a fleet of 30 vehicles: R825 × 30 = R24,750 per month.
Over one year: R24,750 × 12 = R297,000.
Nearly R300,000 could potentially be spent simply running engines while vehicles are not moving.
Actual idling fuel consumption will differ according to vehicle type, engine, operating conditions and equipment, so businesses should use telematics or manufacturer information where possible rather than relying on a generic estimate.
Example of Poor Idling Performance
A security company monitors 20 vehicles using telematics.
It discovers:
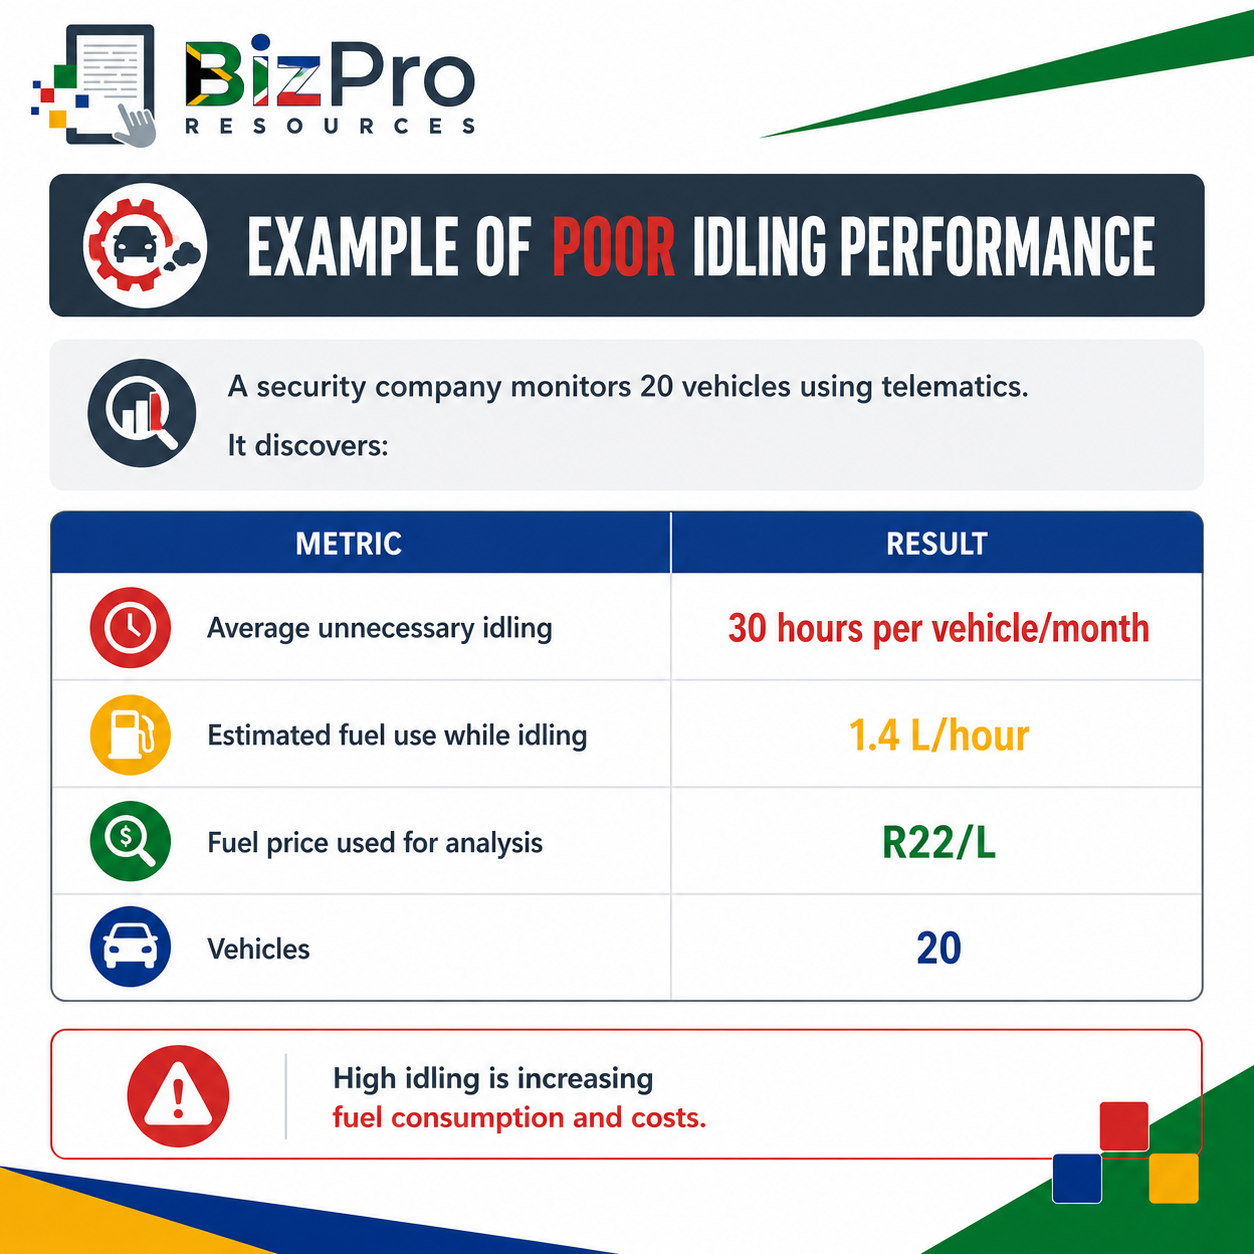
Monthly fuel wasted per vehicle: 30 × 1.4 = 42 litres
Monthly cost per vehicle: 42 × R22 = R924
Fleet-wide monthly cost: R924 × 20 = R18,480
Annualised: R18,480 × 12 = R221,760
What Does This Mean for the Company?
The business may be spending more than R220,000 per year on unnecessary idling if the pattern continues.
It could also indicate:
Poor driver habits
Weak supervision
Inefficient dispatching
Excessive waiting at customer sites
Poor route scheduling
Operational delays
Idling data can therefore reveal more than fuel waste.
It may expose inefficiencies elsewhere in the business.
Example of Good Idling Performance
Management introduces an idling policy. Drivers are trained to switch off engines when safe and practical. Telematics alerts are introduced when vehicles idle unnecessarily for extended periods.
After three months, average unnecessary idling falls from: 30 hours to 10 hours per vehicle per month
At 1.4 litres per hour:
Before: 30 × 1.4 = 42 litres
After: 10 × 1.4 = 14 litres
Fuel saved: 28 litres per vehicle per month
At R22 per litre: 28 × R22 = R616 saved per vehicle
Across 20 vehicles: R12,320 saved per month
Potential annual saving: R147,840
What Does This Mean for the Company?
The company is converting behavioural improvements into measurable financial savings.
It may also experience:
Lower fuel expenditure
Reduced engine running hours
Lower unnecessary engine wear
Better driver accountability
Improved fleet visibility
How the Three Cost Metrics Work Together
These metrics should not be managed separately. They influence each other.
Consider this example:
A fleet manager notices that Cost per Kilometre has increased. Instead of simply reporting the increase, the manager investigates further. Fuel efficiency has deteriorated.
The manager then examines telematics data. Idling has increased significantly.
Further investigation shows that drivers are waiting for long periods at a warehouse because loading schedules are poorly coordinated.
The chain looks like this:
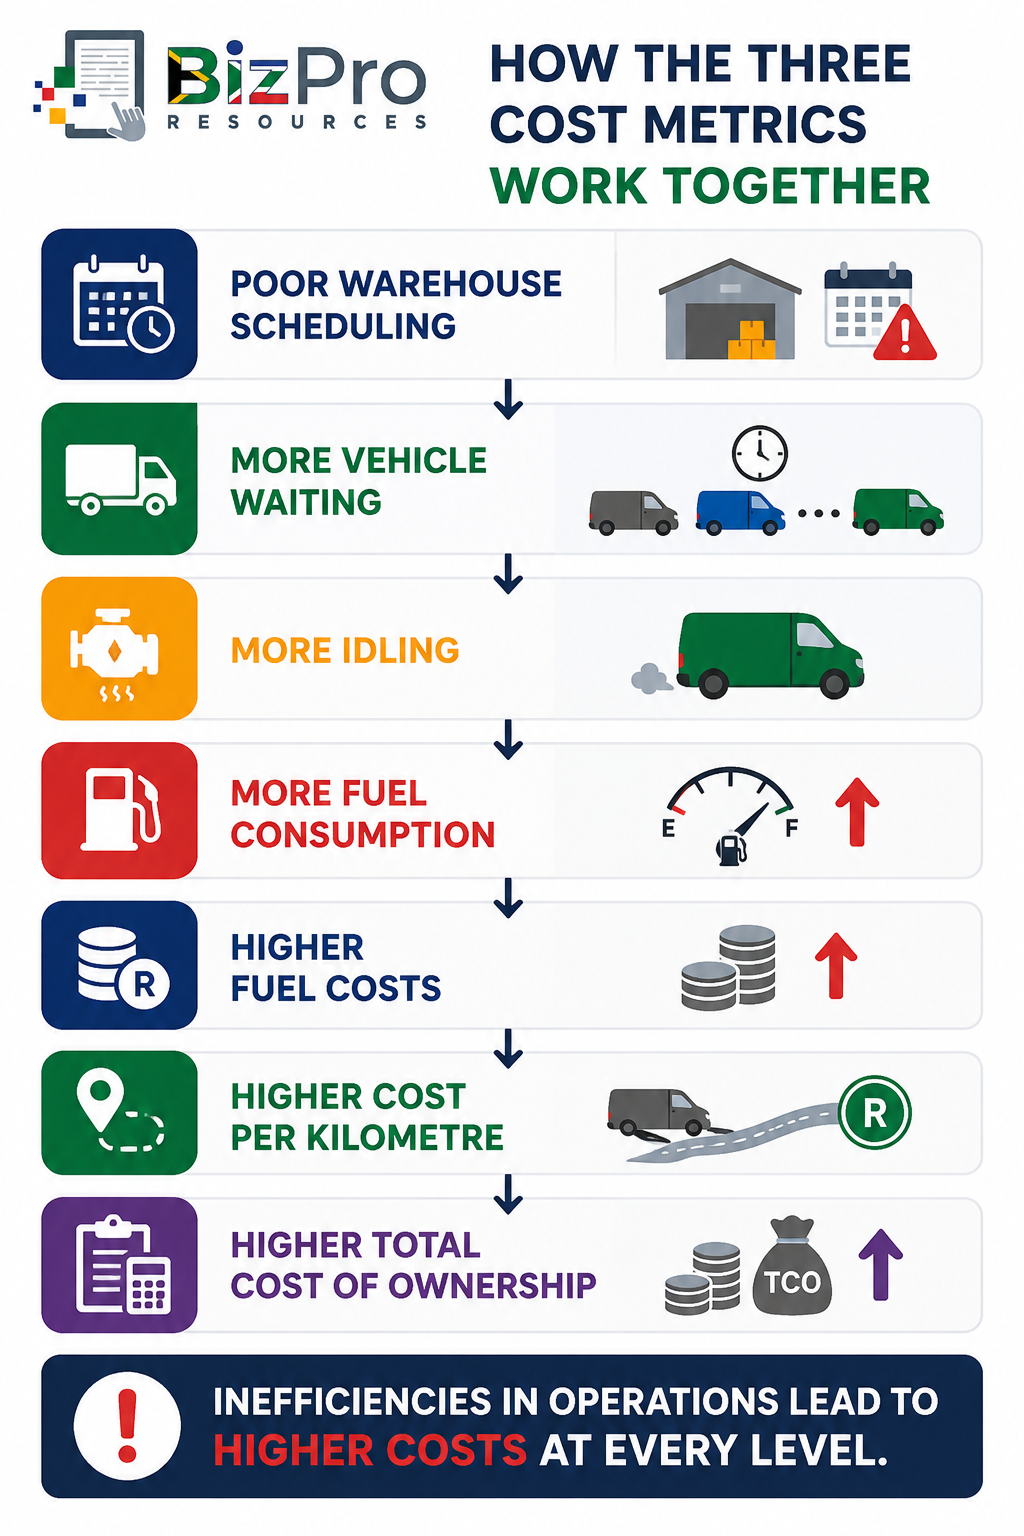
This demonstrates an important management principle: A fleet metric should lead to a management question, and the management question should lead to action.
Build a Simple Fleet Cost Control Dashboard
A small business does not necessarily need an expensive fleet management department to start measuring these numbers.
A spreadsheet can be enough.
Management could track the following every month:
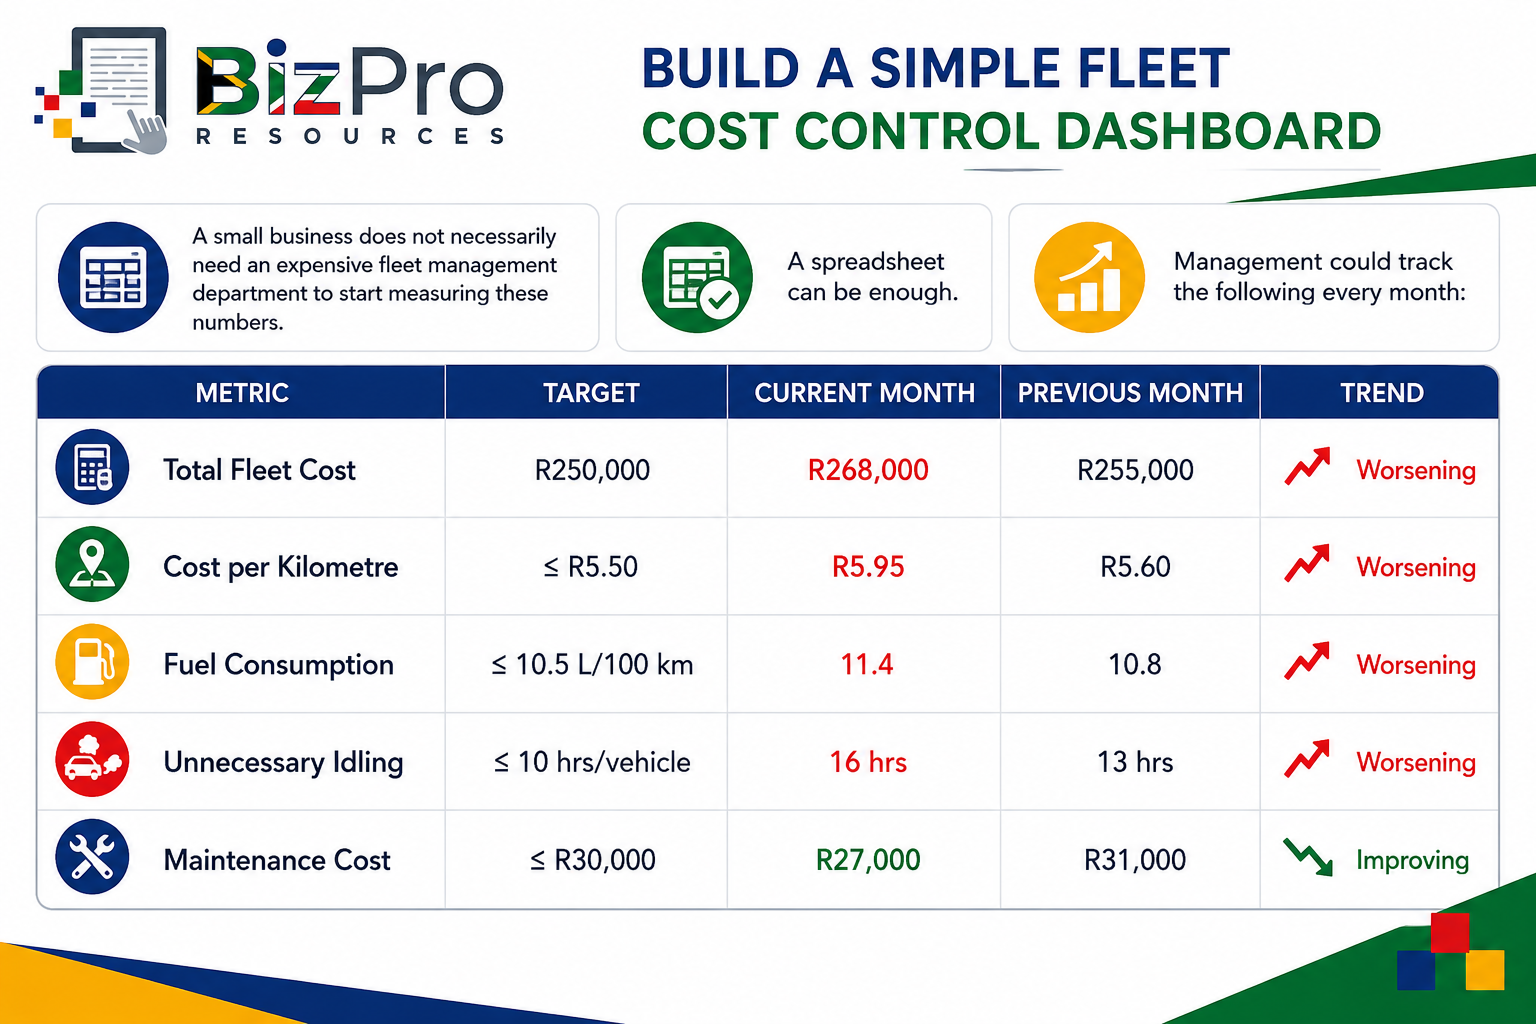
This gives management a quick view of fleet performance.
However, targets should be appropriate for the specific business.
A delivery van, heavy truck, security response vehicle and technician's bakkie cannot automatically be expected to achieve the same cost or fuel performance.
Compare Similar Vehicles with Similar Vehicles
One of the biggest mistakes in fleet measurement is comparing vehicles that perform completely different jobs.
Consider:
Vehicle A: Small delivery van operating mainly in town.
Vehicle B: Loaded bakkie carrying equipment between construction sites.
Vehicle B may naturally use more fuel. That does not automatically mean it is performing badly.
Useful comparisons usually involve vehicles with similar:
Vehicle types
Engine sizes
Loads
Routes
Operating conditions
Ages
Business functions
This creates a more meaningful benchmark.
Look for Trends, Not Just Individual Numbers
One month's result can sometimes be misleading.
Fuel consumption may increase because:
Traffic conditions changed
Vehicles travelled different routes
Fuel prices increased
The fleet completed unusually demanding work
Management should therefore look for trends.
For example:
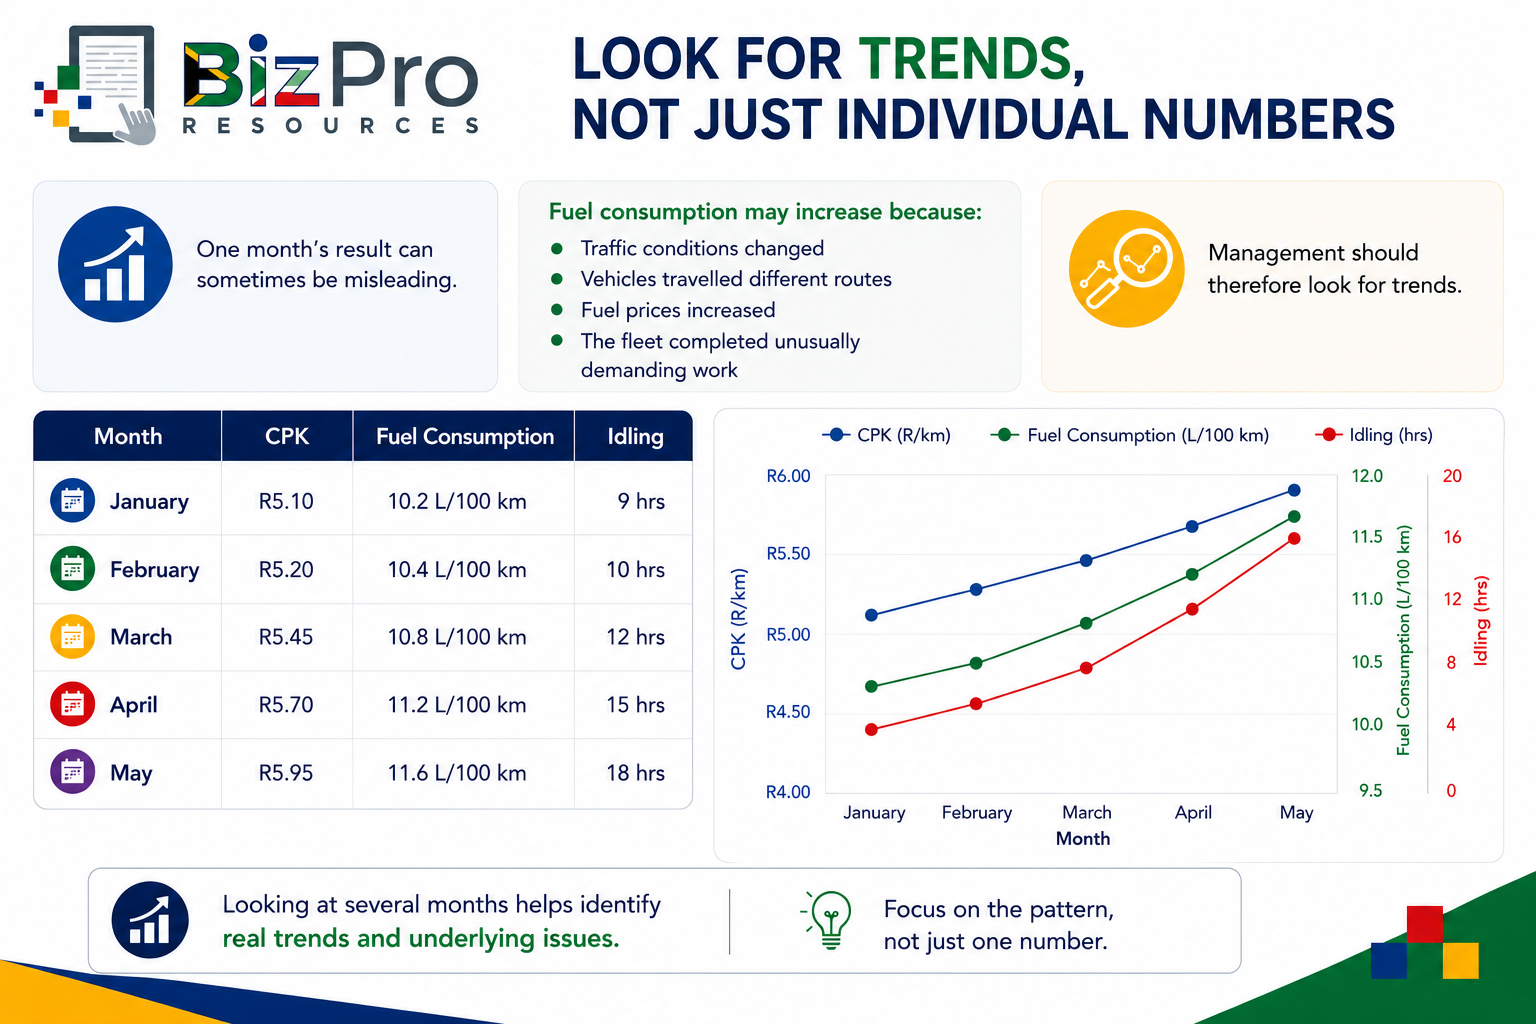
This is more concerning than one bad month. All three indicators are steadily deteriorating.
Management should investigate before the problem becomes more expensive.
What Does Good Fleet Cost Performance Look Like?
There is no single CPK, TCO or fuel-consumption number that represents good performance for every business. Different fleets operate under very different conditions.
Instead, good fleet cost management normally means that the business can answer questions such as:
What does each vehicle cost us per kilometre?
Which vehicles are becoming more expensive to operate?
Which vehicles have the highest TCO?
Which vehicles use significantly more fuel than comparable vehicles?
How much fuel are we losing through unnecessary idling?
Are maintenance costs increasing?
Are older vehicles still economical to keep?
Are our fleet costs improving or deteriorating?
Which drivers or routes consistently produce unusual results?
Are the actions we take actually reducing costs?
If management cannot answer these questions, fleet costs are probably not being measured closely enough.
Turning Fleet Data into Management Action
Metrics only become valuable when management uses them.
A useful process is:
1. Measure:
Collect accurate information about kilometres, fuel, repairs, maintenance, finance costs, idling and other expenses.
2. Compare:
Compare results with:
Previous months
Similar vehicles
Budgets
Internal targets
3. Investigate:
Look for unusual results.
For example: Why did Vehicle 8's fuel consumption increase by 18%?
4. Identify the Cause:
The answer might be:
Driver behaviour
Mechanical problems
Incorrect tyre pressure
Excessive idling
Route changes
5. Take Action:
For example:
Service the vehicle
Train the driver
Change the route
Repair a mechanical fault
Introduce an idling policy
6. Measure Again:
Check whether the intervention worked.
This final step is important.
If the metric does not improve, management may not yet have identified the real cause.
Final Thoughts
Fleet management is not simply about keeping vehicles on the road. It is about ensuring that those vehicles perform the work the business needs at a sustainable cost.
Three cost control metrics provide an excellent starting point:
Total Cost per Kilometre shows how much the business spends for every kilometre its fleet travels.
Total Cost of Ownership reveals what vehicles really cost over their working lives, rather than focusing only on purchase price.
Fuel Efficiency and Idling Costs help management identify one of the most common areas of fleet waste.
The real value comes when these numbers are viewed together:
Rising fuel consumption can increase CPK.
Excessive idling can increase fuel expenditure.
Frequent repairs can increase both CPK and TCO.
Poor vehicle purchasing decisions can create higher costs for years.
Good fleet management therefore requires more than collecting data. It requires management to use that data to make better decisions.
For a small or medium-sized business, even modest improvements can make a significant difference.
Saving a few hundred rand per vehicle may not seem important.
Multiply that saving across an entire fleet, every month, for several years, and the financial impact can become substantial.
The objective is simple: Know what your fleet costs, understand why it costs that amount, and continuously look for practical ways to operate it more efficiently without compromising safety, reliability or service.
Related Articles in the Fleet Management Metrics Series
Fleet Cost Control Metrics: How to Measure and Reduce Vehicle Operating Costs
Fleet Utilization and Safety Metrics: Measuring Vehicle Use, Driver Safety and Compliance
AI Disclaimer
AI Tools were used to assist with research. Remember to always cross-check everything that you read.


