

Value and Cost Metrics: How to Measure Customer Retention, Lifetime Value, and Revenue
Article #2 of #2 in the Sales Metrics Series
Introduction
Generating a sale is important. But not every sale creates the same amount of value for a business.
One customer may buy once and never return. Another may remain with the company for five years, make regular purchases, refer other customers, and steadily increase the amount they spend.
From a sales perspective, those two customers are very different.
This is why small business owners should look beyond the question: “How much did we sell?”
They should also ask: “How much value are our customers creating over time?”
This becomes particularly important when a business spends money to attract new customers. Advertising, salespeople, quotations, demonstrations, travel, discounts, promotions, and marketing campaigns all cost money.
If customers disappear shortly after they are acquired, the business may continually spend money replacing customers it has lost.
If customers remain loyal and continue buying, the value generated from each customer can become significantly greater.
Three useful sales metrics for understanding customer value are:
Customer Retention Rate
Customer Lifetime Value
Average Customer Revenue
Together, these metrics help management understand whether customers are staying, how much they may be worth over the relationship, and how much revenue the average customer generates.
Why Customer Value Matters
Many businesses focus heavily on winning new customers. That makes sense. Without customers, there are no sales. But acquiring customers is only one part of building a sustainable business.
Consider two companies.
Company A wins 50 new customers every month but loses 45 existing customers.
Company B wins 30 new customers every month but loses only 10 existing customers.
Company A appears to have the stronger sales operation if you look only at new customer acquisition.
But the customer base tells a different story:
Company A is adding only five net customers each month.
Company B is adding 20.
Company B may therefore build a much larger customer base over time even though it acquires fewer new customers.
This illustrates an important principle: Growth is not only about how many customers enter the business. It is also about how many stay.
The same principle applies to customer value:
Suppose one customer generates R2,000 in revenue and never returns.
Another generates R1,000 per month for three years.
The first customer generated R2,000.
The second generated: R1,000 × 36 months = R36,000
Understanding these differences can change how a business approaches sales, marketing, customer service, pricing, and retention.
1. Customer Retention Rate
What Is Customer Retention Rate?
Customer Retention Rate measures the percentage of customers that a business keeps over a particular period.
It answers a simple but extremely important question: “How many of our customers are staying with us?”
Retention is particularly important for businesses where customers are expected to purchase repeatedly or maintain an ongoing relationship.
Examples include:
Accounting firms.
Security companies.
IT support providers.
Medical practices.
Maintenance businesses.
Insurance brokers.
Subscription businesses.
Professional services firms.
Suppliers with repeat commercial customers.
Businesses with service or maintenance contracts.
Even businesses without formal contracts can monitor retention.
For example, an auto workshop could measure how many customers who used the workshop last year returned during the current year.
A high retention rate generally means the business is successfully keeping customers.
A declining retention rate can be an early warning that customers are becoming dissatisfied, finding alternatives, or no longer seeing enough value in the relationship.
How Is Customer Retention Rate Calculated?
A commonly used formula is: Customer Retention Rate (%) = (Customers at End of Period − New Customers Acquired During Period) ÷ Customers at Start of Period × 100
The reason new customers are removed from the calculation is that retention is supposed to measure how many existing customers were retained, rather than how many new customers were added.
For example, suppose a business starts the year with: 200 customers:
During the year, it acquires: 50 new customers
At the end of the year, it has: 220 customers
The calculation is: (220 − 50) ÷ 200 × 100 = 85%
The Customer Retention Rate is therefore 85%.
This means the business retained 85% of the customers it had at the beginning of the period.
Another way to understand the result is to calculate how many original customers remained: 220 ending customers − 50 new customers = 170 retained customers.
The company started with 200 customers and retained 170. so: 170 ÷ 200 × 100 = 85%
Example of Poor Customer Retention
Imagine a managed IT services company starts the year with 120 customers:
During the year, it signs 35 new customers.
At the end of the year, it has only 105 customers.
Customer Retention Rate is: (105 − 35) ÷ 120 × 100 = 58.3%
The company retained only approximately 58% of its original customers.
That means: 120 − 70 = 50 original customers were lost. This should concern management. The business acquired 35 new customers but lost 50 existing customers.
It is therefore losing customers faster than it is replacing them.
Possible reasons include:
Poor customer service.
Slow response times.
Recurring technical problems.
Competitors offering better value.
Poor communication.
Unexpected price increases.
Customers feeling ignored after the initial sale.
Weak account management.
Failure to resolve complaints.
Customers no longer needing the service.
The sales team may appear busy because it is constantly signing new customers, but much of that activity is simply replacing customers who have left.
This is sometimes compared to filling a leaking bucket. The business keeps pouring new customers into the top while existing customers leak out of the bottom.
The solution is not necessarily to pour faster.
Management needs to find and repair the leak.
Example of Good Customer Retention
Suppose the same company improves its customer service and account management. The following year it starts with 120 customers, acquires 30 new customers, and finishes with 145 customers.
Customer Retention Rate is: (145 − 30) ÷ 120 × 100 = 95.8%
The company retained approximately 96% of its original customers. Only five of the original 120 customers were lost. This is a very different situation.
New sales are now creating genuine growth rather than simply replacing customers who leave.
High retention may indicate:
Strong customer relationships.
Good service quality.
Competitive pricing.
Effective account management.
Reliable delivery.
Good complaint handling.
Customers seeing continued value.
The company can now grow from a much stronger foundation.
What Does Poor Retention Mean for the Business?
Poor retention can create several problems. The most obvious is lost revenue. But the impact can extend further.
The company may need to spend more on marketing and sales just to maintain its existing customer numbers.
Salespeople may spend their time replacing lost customers rather than growing the customer base.
Future revenue becomes less predictable.
Negative customer experiences may also damage referrals and reputation.
In recurring-revenue businesses, poor retention can be particularly damaging because every cancelled contract removes revenue that could otherwise have continued month after month.
What Does Good Retention Mean for the Business?
Strong retention means customers are continuing to choose the company.
This can contribute to:
More predictable revenue.
A larger customer base.
More repeat sales.
Better opportunities for upselling.
Better opportunities for cross-selling.
More customer referrals.
Lower pressure to constantly replace lost customers.
However, retention should never be interpreted blindly. A business should not try to retain every customer at any cost. Some customers may be consistently unprofitable, extremely difficult to service, or poor payers.
The goal is to retain valuable customers who fit the business.
2. Customer Lifetime Value
What Is Customer Lifetime Value?
Customer Lifetime Value, often abbreviated as CLV or CLTV, estimates the total value a customer is expected to generate during their relationship with the business.
It helps answer: “What is the average customer worth to us over the entire relationship?” This can be much more useful than looking at the value of the first sale.
Imagine a security company installs an alarm system for a customer for R8,000. If management looks only at the installation, it may believe the customer is worth R8,000.
But suppose the customer then pays R550 per month for monitoring services and remains a customer for five years.
Monitoring revenue is: R550 × 60 months = R33,000
Combined with the installation: R8,000 + R33,000 = R41,000
The relationship has generated R41,000 in revenue before considering any additional upgrades, maintenance, or other purchases.
This is why Customer Lifetime Value can change how management thinks about acquiring and retaining customers.
How Is Customer Lifetime Value Calculated?
There are several ways to calculate Customer Lifetime Value, ranging from simple estimates to sophisticated financial models.
For a small business, a practical starting formula is: Customer Lifetime Value = Average Customer Revenue per Period × Average Customer Lifespan
Suppose the average customer generates: R1,500 per month and remains with the company for 36 months. Then: R1,500 × 36 = R54,000.
Estimated Customer Lifetime Value is: R54,000.
A business that wants a more meaningful profitability-based measure can use gross profit rather than revenue.
For example: Customer Lifetime Value = Average Customer Revenue × Gross Margin % × Customer Lifespan.
If average monthly revenue is R1,500, gross margin is 40%, and average lifespan is 36 months: R1,500 × 40% × 36 = R21,600.
Estimated lifetime gross profit contribution is therefore: R21,600.
This version can be more useful when management is comparing customer value with the cost of acquiring and servicing customers.
Example of Poor Customer Lifetime Value
Imagine a business spends heavily on online advertising and sales commissions:
The average customer generates: R800 per month
Average customer lifespan is: 6 months
Estimated Customer Lifetime Value is: R800 × 6 = R4,800
Now suppose the business typically spends R3,500 in marketing and sales costs to acquire each customer. The relationship becomes concerning.
The company generates only R4,800 in lifetime revenue after spending R3,500 to acquire the customer.
That R4,800 is also revenue, not profit. The business still needs to pay the costs associated with delivering the product or service. If those costs are substantial, the customer relationship may generate little profit or could even lose money.
Poor Customer Lifetime Value may indicate:
Customers leave too quickly.
Customers purchase too infrequently.
Average spending is too low.
Pricing is too low.
Customers are not buying additional products.
Retention is weak.
Acquisition costs are too high relative to customer value.
Management should investigate the entire customer relationship.
Example of Good Customer Lifetime Value
Suppose the business improves retention and introduces additional services:
Average monthly customer revenue increases to: R1,200
Average customer lifespan increases to: 36 months
Customer Lifetime Value becomes: R1,200 × 36 = R43,200
That is dramatically better than the previous R4,800.
If acquisition cost remains R3,500, the economics of customer acquisition now look much healthier. A customer acquired today may generate revenue for several years.
This could justify greater investment in:
Marketing.
Sales.
Customer onboarding.
Account management.
Customer support.
Retention programmes.
The company now understands that the value of winning the customer is not limited to the first transaction.
Customer Lifetime Value Changes How You Think About Sales
CLV can change management decisions significantly.
Suppose an accounting firm charges a new small business client: R2,500 per month. The owner might initially think: “This is a R2,500 sale.”
But suppose the average client stays for five years. That represents: R2,500 × 60 = R150,000 in potential lifetime revenue.
Now imagine the client also buys:
Annual financial statements.
Tax consulting.
Company secretarial services.
Payroll services.
Business advisory services.
The true value of the relationship could be considerably higher.
This perspective encourages businesses to think beyond individual transactions and focus on building long-term customer relationships.
Revenue-Based CLV Versus Profit-Based CLV
There is an important distinction to understand. A revenue-based CLV tells you how much sales revenue the customer may generate. It does not tell you how much money the company actually keeps.
Suppose two customers each generate R100,000 in lifetime revenue:
Customer A costs R40,000 to service.
Customer B costs R90,000 to service.
Their revenue-based lifetime values are identical. Their economic value to the company is clearly not.
For this reason, businesses that have reliable cost and margin information should eventually consider using a gross-profit or contribution-based CLV calculation.
The simple revenue calculation is still useful as a starting point, especially when the business is new to sales metrics.
3. Average Customer Revenue
What Is Average Customer Revenue?
Average Customer Revenue measures the average amount of revenue generated by each customer during a particular period.
It answers: “How much revenue does the average customer generate?” This metric is sometimes referred to as Average Revenue Per Customer or ARPC.
Subscription businesses may use similar measures such as Average Revenue Per User or Average Revenue Per Account.
For a small business, the concept is straightforward. If the business generates R500,000 from 100 customers during a month, average customer revenue is R5,000.
Tracking this metric over time helps management see whether the average customer is becoming more or less valuable.
How Is Average Customer Revenue Calculated?
The basic formula is: Average Customer Revenue = Total Customer Revenue During Period ÷ Number of Customers During Period
For example:
Monthly revenue = R600,000
Customers = 150
Therefore: R600,000 ÷ 150 = R4,000
Average Customer Revenue is: R4,000 per customer
The period must be clearly defined. If you are using monthly revenue, use the relevant customer count for that monthly period. If you are measuring annual revenue, use an appropriate annual customer count.
Consistency is important if you want to compare results over time.
Example of Poor Average Customer Revenue
Imagine a plumbing company tracks the following:
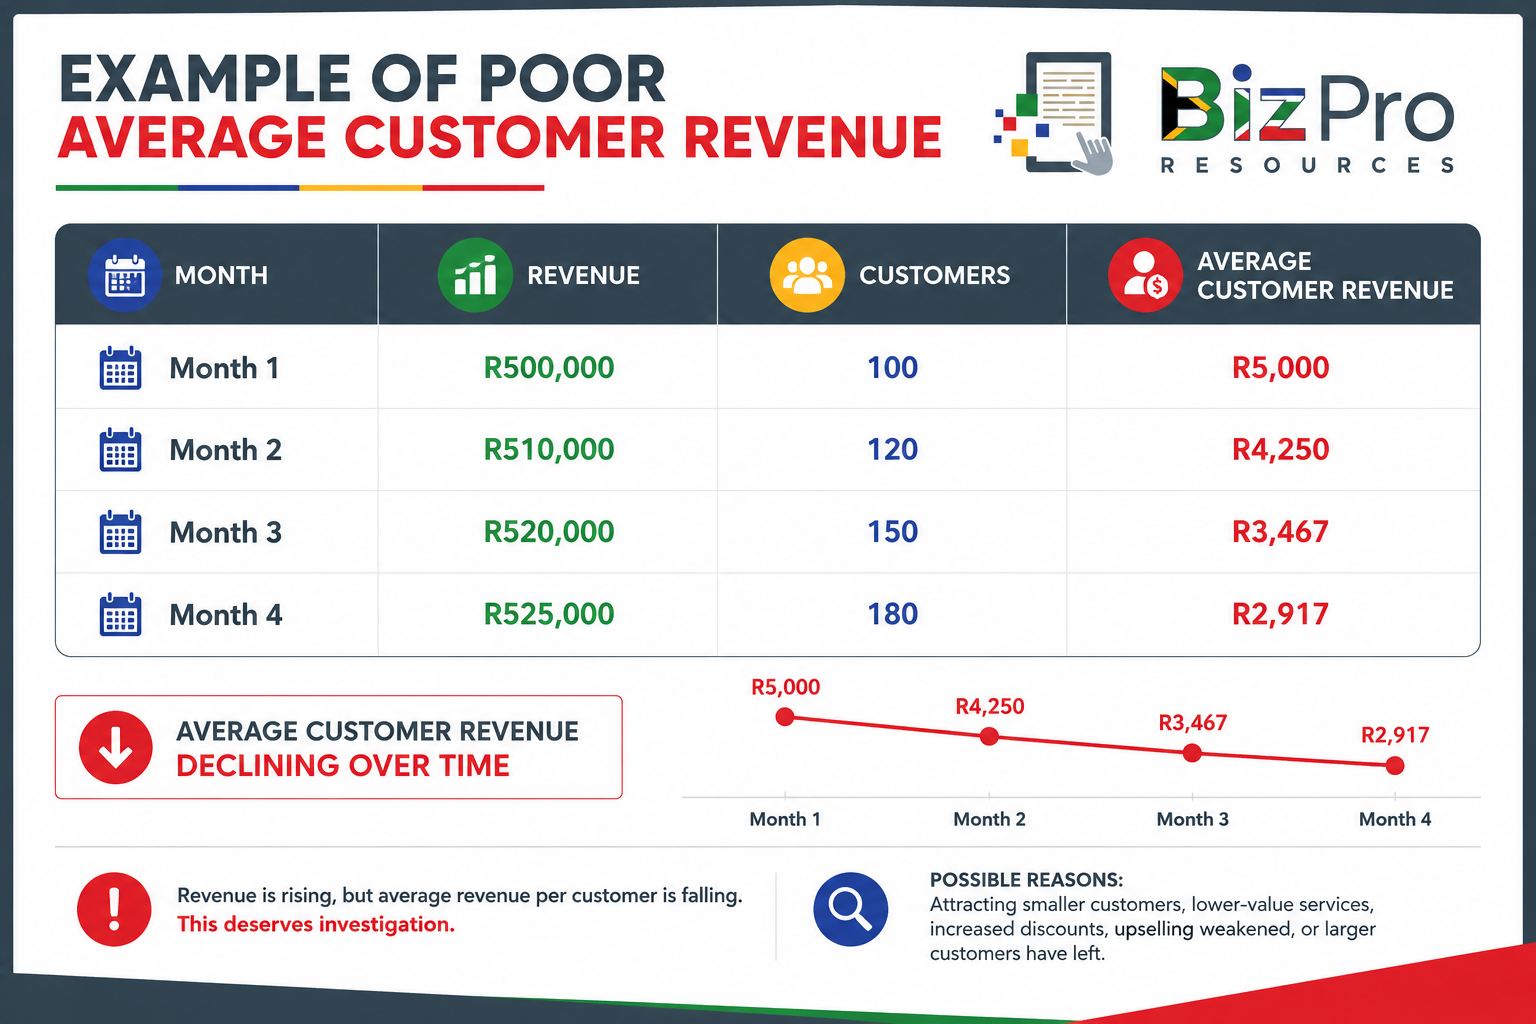
At first glance, revenue appears to be improving:
It increased from R500,000 to R525,000.
Customer numbers also increased significantly.
That sounds positive. But Average Customer Revenue fell from R5,000 to approximately R2,917. This means the average customer is spending much less.
That may or may not be a problem, but it deserves investigation.
Possible reasons include:
The company is attracting smaller customers.
Customers are purchasing lower-value services.
Discounts have increased.
Upselling has weakened.
Larger customers have left.
The business has changed its customer mix.
Customers are purchasing less frequently.
The business may now need to service far more customers to generate roughly the same amount of revenue.
If every customer creates administrative and operational costs, this could place pressure on profitability.
Example of Good Average Customer Revenue
Suppose the company introduces service bundles and improves cross-selling.
Results change:
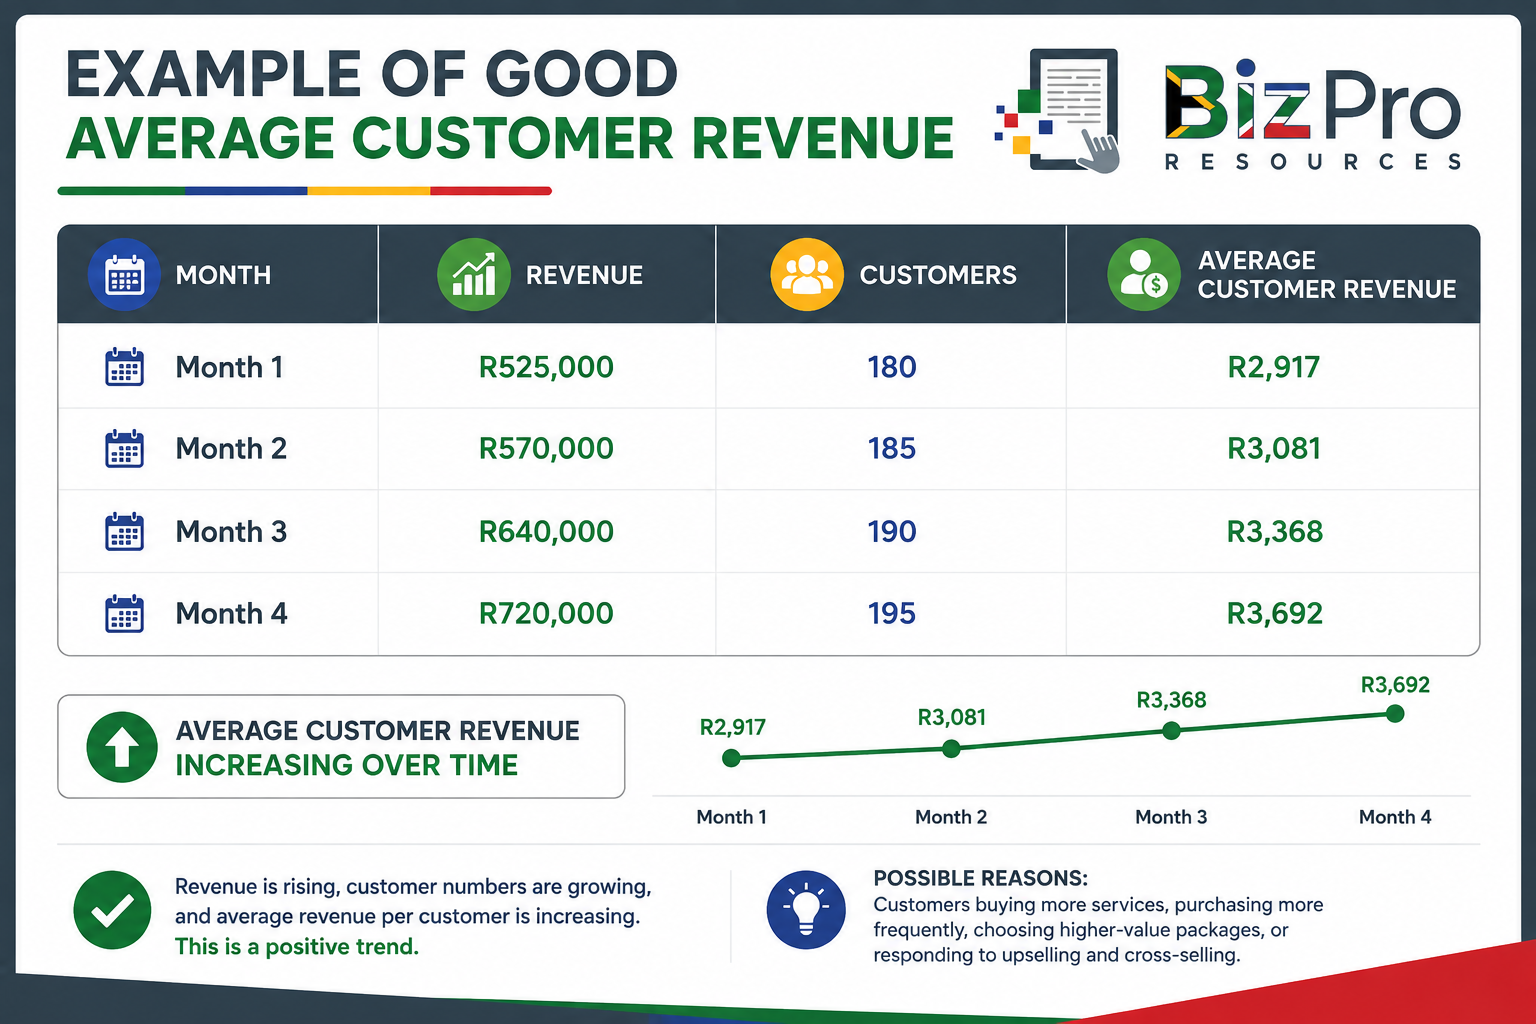
This could mean customers are:
Buying more services.
Purchasing more frequently.
Choosing higher-value packages.
Accepting price increases.
Responding to upselling.
Responding to cross-selling.
This is generally a positive development, provided the additional revenue is profitable.
Average Customer Revenue Is Not the Same as Average Deal Size
These two metrics can easily be confused:
Average Deal Size measures the average value of an individual sales transaction or closed deal.
Average Customer Revenue measures the average revenue generated by a customer during a specified period.
A customer may complete several transactions.
For example, a customer makes four purchases during the year:
R5,000
R8,000
R4,000
R7,000
Total customer revenue is: R24,000
The average transaction is: R24,000 ÷ 4 = R6,000
But the customer generated: R24,000 in annual customer revenue.
The metrics answer different questions.
Average Deal Size asks: “How valuable is the average sale?”
Average Customer Revenue asks: “How valuable is the average customer during this period?”
Both are useful.
How the Three Metrics Work Together
Customer Retention Rate, Customer Lifetime Value, and Average Customer Revenue become much more powerful when they are analysed together.
Imagine the following dashboard:
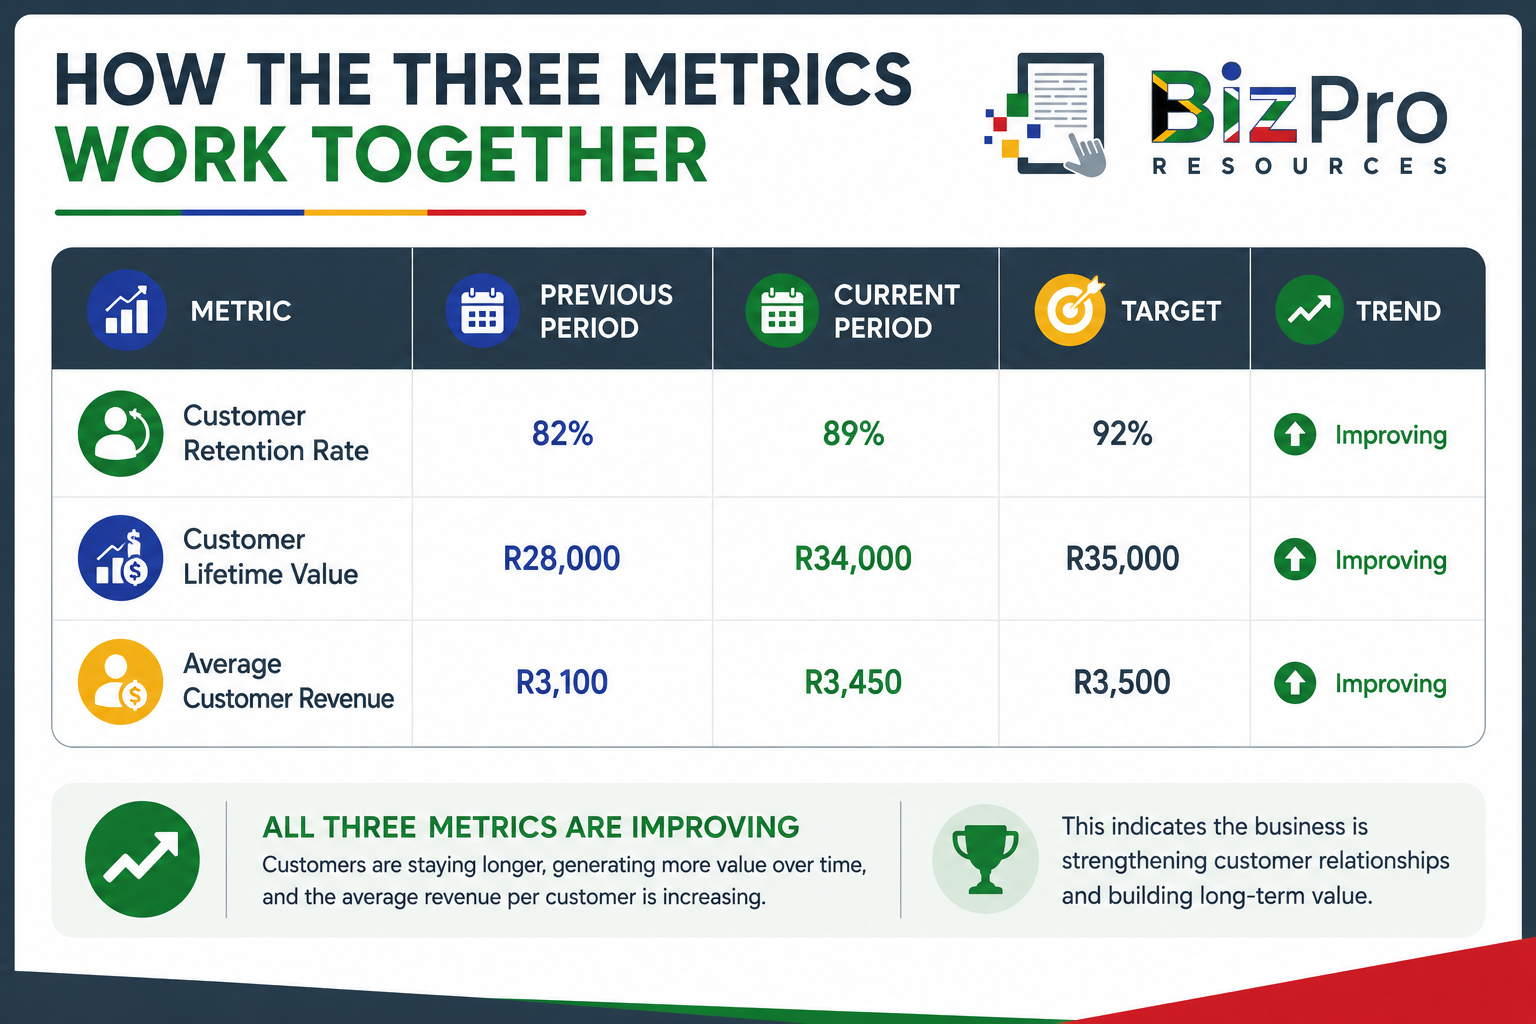
All three metrics are improving. This tells management something important.
Customers are staying longer, their estimated lifetime value is increasing, and the average amount of revenue generated per customer is rising.
That could indicate that the business is improving the quality and value of its customer relationships.
Now imagine:
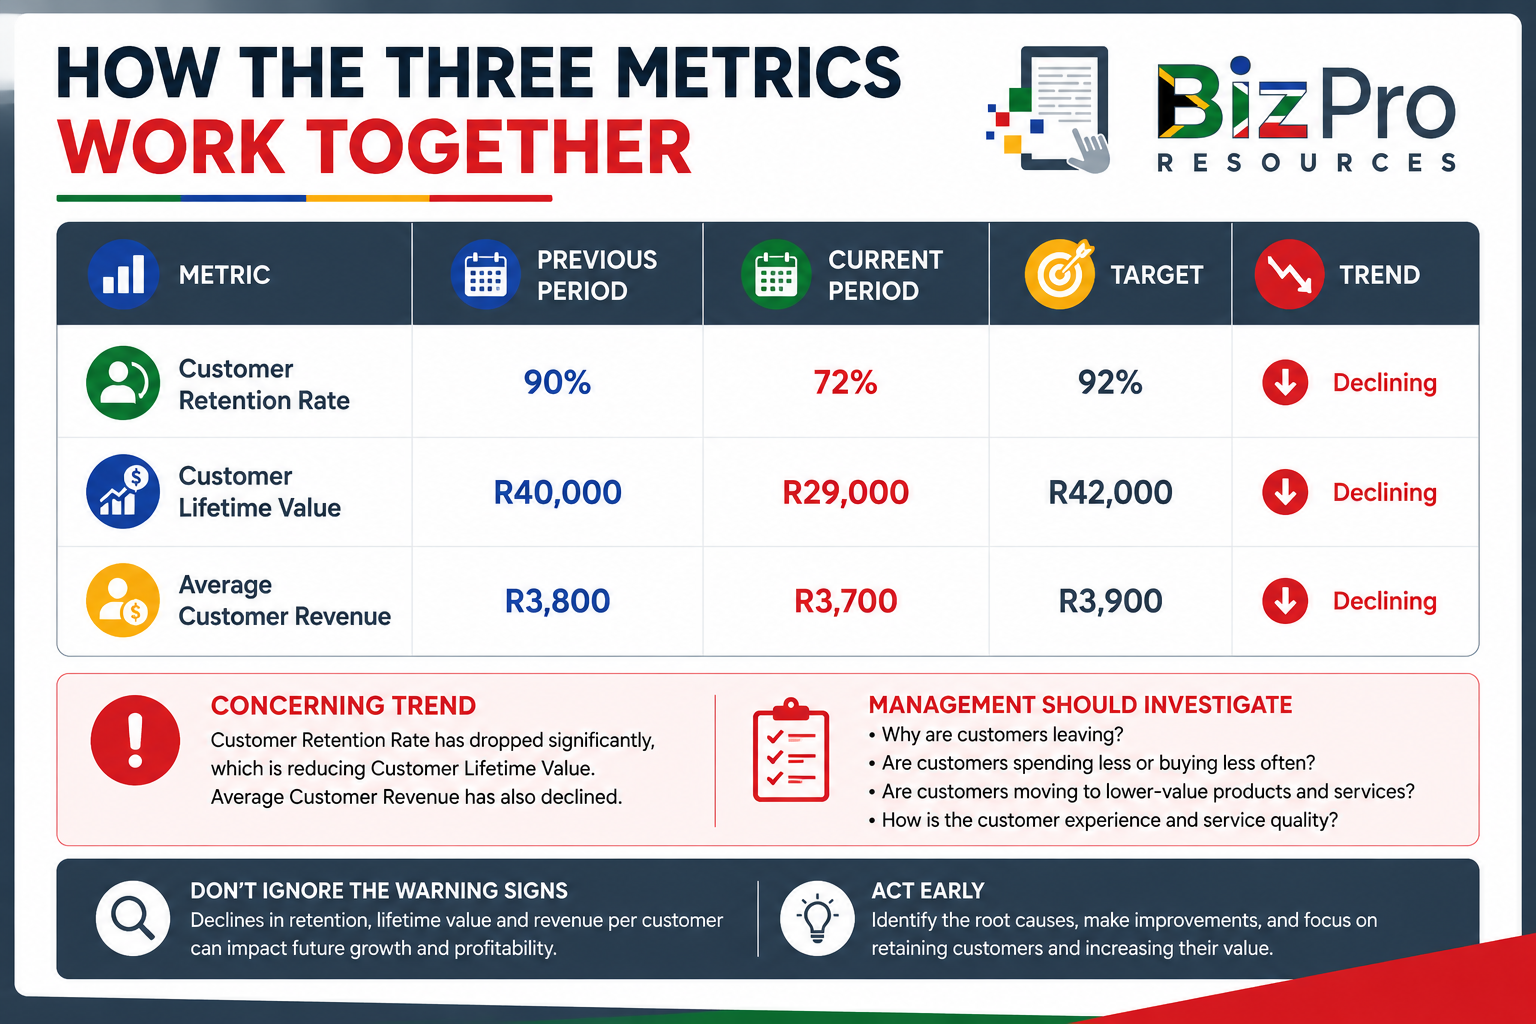
Average Customer Revenue has fallen only slightly. If management looked at that metric alone, it might not be particularly concerned. But retention has dropped dramatically.
That shorter expected customer relationship is also reducing Customer Lifetime Value.
The combined picture reveals a much more serious problem.
The Relationship Between Retention and Lifetime Value
Retention has a particularly important relationship with Customer Lifetime Value.
In many businesses: Customers who stay longer have more opportunities to generate revenue.
Consider two customers who both spend R1,000 per month:
Customer A stays for six months.
Lifetime revenue: R1,000 × 6 = R6,000
Customer B stays for four years.
Lifetime revenue: R1,000 × 48 = R48,000
The monthly value of the customers is identical. The lifetime value is dramatically different.
This means improving retention can increase Customer Lifetime Value even if monthly customer spending does not change.
If the business can improve both retention and average customer revenue, the impact can be even greater.
How Businesses Can Improve Customer Retention
Retention is influenced by the entire customer experience, not only by the sales team.
Businesses can improve retention by focusing on areas such as:
Delivering what was promised.
Responding quickly to customer problems.
Communicating regularly.
Making it easy for customers to get help.
Providing consistent service quality.
Following up after the sale.
Resolving complaints properly.
Understanding why customers leave.
Rewarding valuable long-term customers where appropriate.
Reviewing customer feedback.
Providing ongoing value.
Salespeople should also avoid making unrealistic promises simply to close deals.
A customer acquired through misleading promises may quickly become a customer who leaves.
How Businesses Can Improve Customer Lifetime Value
There are two major ways to increase Customer Lifetime Value:
The first is to increase how long customers stay.
The second is to increase the value generated while they remain customers.
Businesses can therefore consider:
Improving retention.
Increasing purchase frequency.
Cross-selling related products.
Upselling higher-value solutions.
Offering maintenance contracts.
Introducing recurring services.
Creating appropriate service bundles.
Improving customer relationships.
Increasing prices where justified.
Encouraging repeat purchases.
However, the objective should not be to squeeze as much money as possible from every customer. The objective is to create more value for the customer and more value for the business.
When both sides benefit, the relationship is more likely to remain sustainable.
How Businesses Can Improve Average Customer Revenue
Average Customer Revenue can often be improved through relatively simple changes.
For example, a vehicle workshop could move from selling only individual repairs to offering:
Scheduled servicing.
Air-conditioning services.
Tyre services.
Brake inspections.
Battery replacement.
Fleet maintenance.
An accounting practice might cross-sell:
Payroll.
Tax compliance.
Company secretarial services.
Management accounts.
Business advisory services.
A security business might add:
Monitoring.
Maintenance.
Armed response.
CCTV.
Access control.
System upgrades.
The principle is not to sell unnecessary services.
It is to identify additional genuine customer needs that the business can solve profitably.
Be Careful with Averages
Average Customer Revenue is useful, but averages can sometimes hide important information.
Suppose a business has ten customers:
Nine customers each generate R10,000.
One customer generates R110,000.
Total revenue is: R200,000
Average Customer Revenue is: R20,000
But nine out of ten customers actually generate only R10,000.
The large customer has pulled the average upwards. Management should therefore consider examining customer segments as well.
For example:
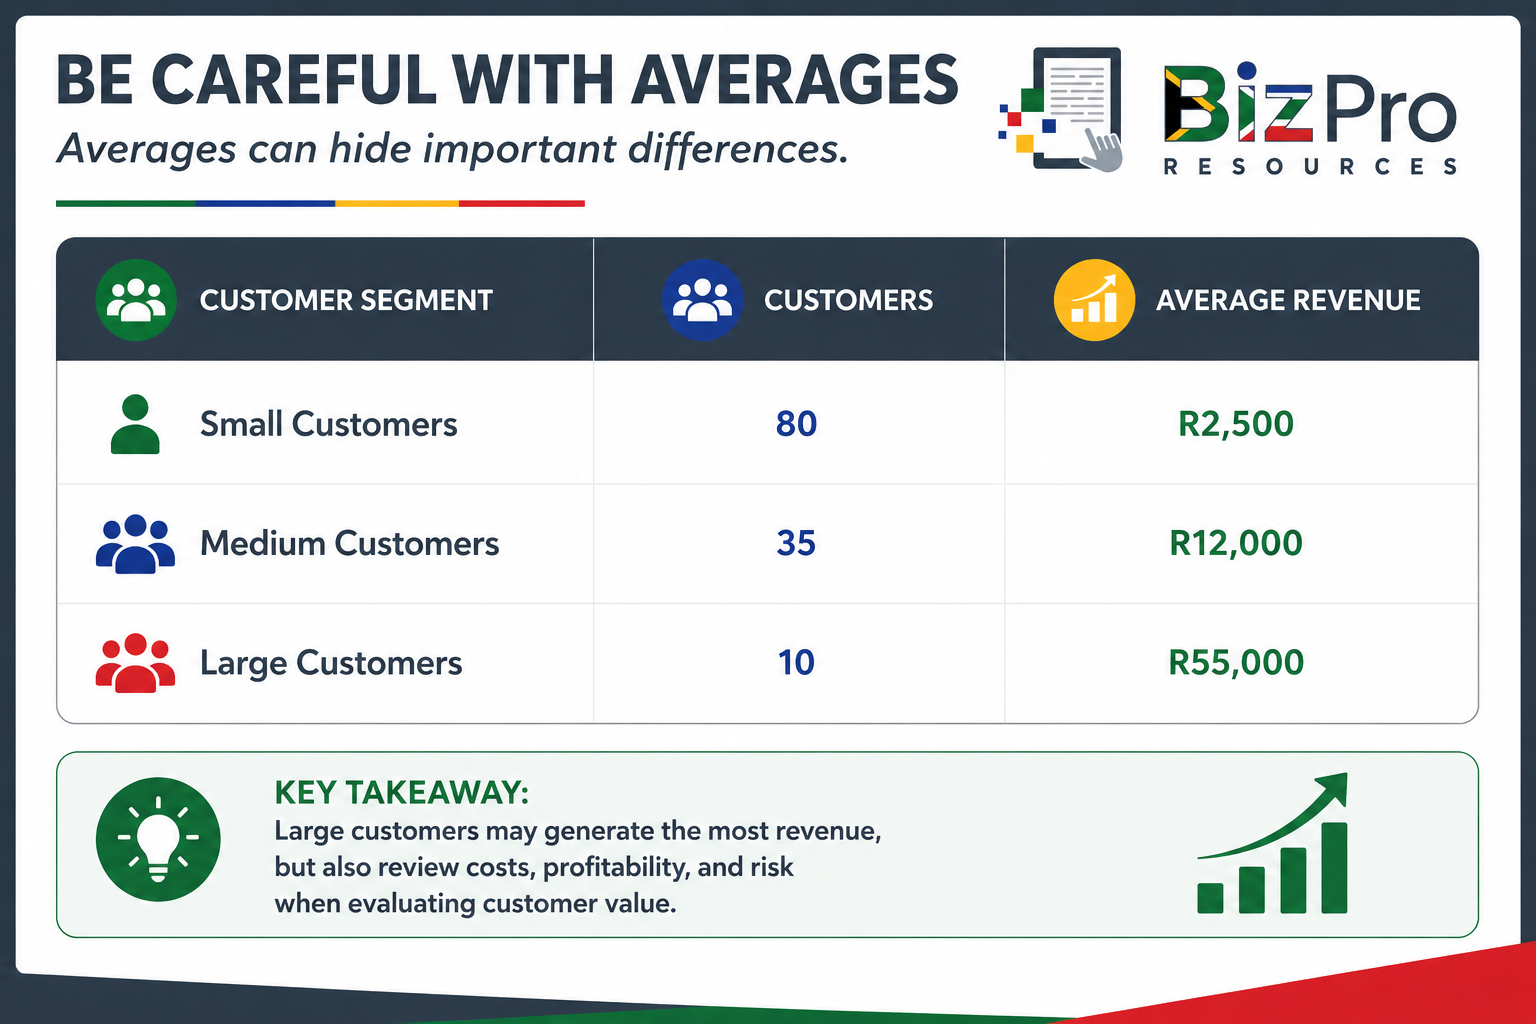
This can provide much more useful information than one company-wide average.
Segment Your Customer Value Metrics
Where possible, calculate customer metrics for different groups.
You might segment customers by:
Product.
Service.
Industry.
Region.
Customer size.
Contract type.
Sales channel.
New versus established customers.
Suppose an IT company discovers:
Small businesses: CLV = R18,000
Medium businesses: CLV = R85,000
Large businesses: CLV = R240,000
At first glance, large businesses appear far more attractive.
But management should then examine:
Acquisition cost.
Gross margin.
Sales cycle.
Payment terms.
Support requirements.
Concentration risk.
Large customers may generate more revenue but may also require more resources and create greater risk.
Customer value should therefore be considered alongside customer cost.
Revenue Is Not the Same as Profit
This point is particularly important when discussing customer value.
A customer generating R100,000 in annual revenue is not necessarily better than a customer generating R60,000.
Suppose:
Customer A
Revenue = R100,000
Cost to service = R90,000
Contribution before other overheads = R10,000
Customer B
Revenue = R60,000
Cost to service = R30,000
Contribution before other overheads = R30,000
Customer B generates less revenue but may create considerably more financial value.
For this reason, customer value metrics should eventually be combined with profitability and cost metrics.
Sales revenue is important. But profitable revenue is more important.
Build a Simple Customer Value Dashboard
A small business can track these metrics using a straightforward monthly or quarterly dashboard.
For example:
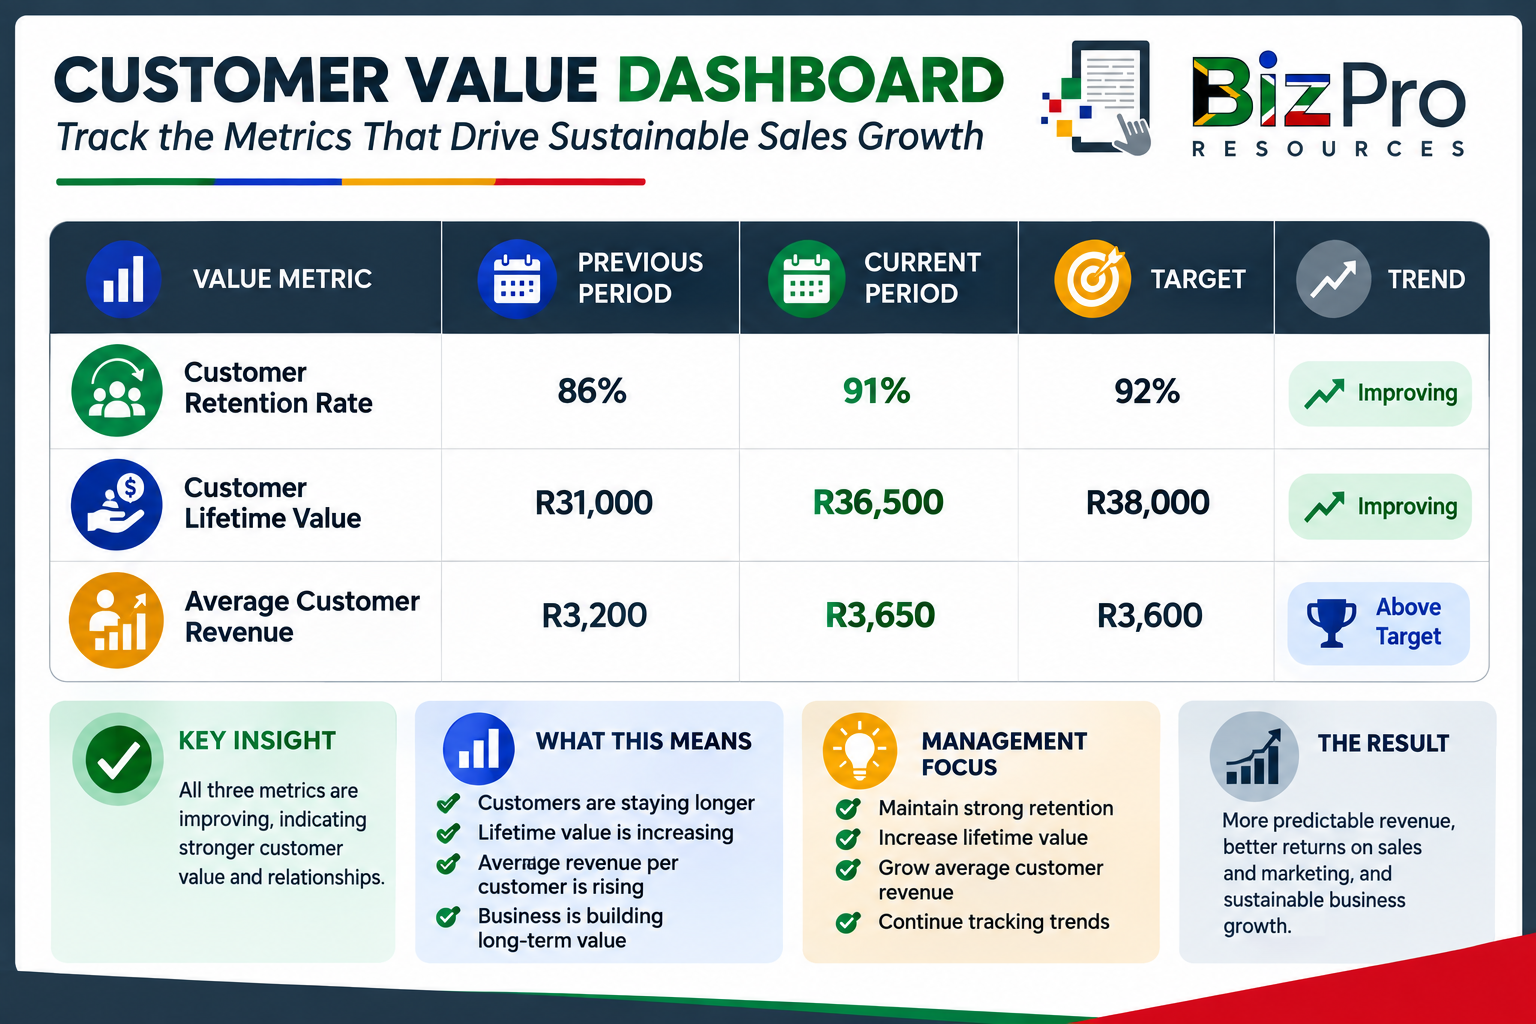
Management can immediately see that:
Retention is improving but remains slightly below target.
Customer Lifetime Value is improving but remains below target.
Average Customer Revenue has exceeded target.
This gives management specific areas to investigate.
Instead of saying: “We need more valuable customers.”
The business can ask: “What can we do to improve retention from 91% to 92%?” or “What would increase average customer lifespan enough to move CLV from R36,500 to R38,000?”
Specific metrics lead to more useful management conversations.
Turn Customer Value Metrics into Management Questions
When Customer Retention Rate falls, ask: Why are customers leaving?
When Customer Lifetime Value falls, ask: Are customers spending less, staying for less time, or both?
When Average Customer Revenue falls, ask: Are customers buying less, buying less frequently, or moving towards lower-value products and services?
Then investigate:
Do not guess.
Speak to customers.
Review complaints.
Analyse cancellations.
Compare customer segments.
Speak to salespeople and customer service employees.
Examine competitor activity.
Look at pricing.
Review service quality.
Metrics tell you where to look.
Management investigation tells you what to do about it.
Monitor Trends, Not Just Individual Results
One month's number can be misleading.
For example:
Customer Retention Rate
January: 94%
February: 93%
March: 89%
April: 84%
May: 78%
The May figure matters. But the trend matters even more. Retention has been deteriorating for five consecutive months. Management should not wait until the customer base collapses before investigating.
The same applies to Customer Lifetime Value and Average Customer Revenue. A gradual decline may reveal a problem before it becomes visible in total sales revenue.
This is one of the major benefits of using sales metrics.
They can act as an early warning system.
Do Not Chase the Metric at the Expense of the Customer
Businesses should also avoid manipulating behaviour simply to improve a number.
For example, management may decide that Average Customer Revenue must increase at all costs. Salespeople then begin aggressively pushing additional products onto customers who do not need them.
This could cause:
Average Customer Revenue may rise temporarily.
Customer satisfaction may fall.
Eventually, retention could decline.
Customer Lifetime Value could then fall as well.
The metrics are connected.
The objective should always be sustainable customer value.
A good customer relationship should create value for: the customer and the business.
From Customer Acquisition to Customer Value
A mature sales operation does not stop measuring performance when the customer says yes.
That is only the beginning of the relationship.
The business should continue asking:
Did the customer stay?
Did they buy again?
Did their spending increase?
Did they purchase additional services?
Did they refer other customers?
Was the relationship profitable?
How long did the relationship last?
This shifts the business from a purely transaction-based view of sales towards a customer-value approach.
Instead of seeing every sale as an isolated event, management begins seeing customers as relationships that develop over time.
Final Thoughts
Winning new customers is important, but sustainable sales growth depends on what happens after the first sale.
Customer Retention Rate tells you how successfully the business keeps its existing customers.
Customer Lifetime Value estimates how much value the average customer may generate over the full relationship.
Average Customer Revenue tells you how much revenue the average customer generates during a particular period.
Together, these metrics help answer three important questions:
Are our customers staying?
How valuable are they over time?
How much revenue is the average customer generating?
A business with strong customer retention, increasing lifetime value, and healthy average customer revenue is building something much more valuable than a collection of individual sales.
It is building a base of customers who continue creating revenue over time.
For a small business, that can mean greater stability, more predictable income, better returns from sales and marketing, and less pressure to constantly replace customers who leave.
The goal should therefore not simply be: Get more customers.
A stronger goal is: Win the right customers, create genuine value for them, keep them for longer, and build profitable relationships that benefit both the customer and the business.
Related Articles in the Sales Metrics Series
Core Revenue and Target Metrics: How to Measure and Improve Sales Performance
Value and Cost Metrics: How to MEasure Customer Retention, Lifetime Value, and Revenue
AI Disclaimer
AI Tools were used to assist with research. Remember to always cross-check everything that you read.


