
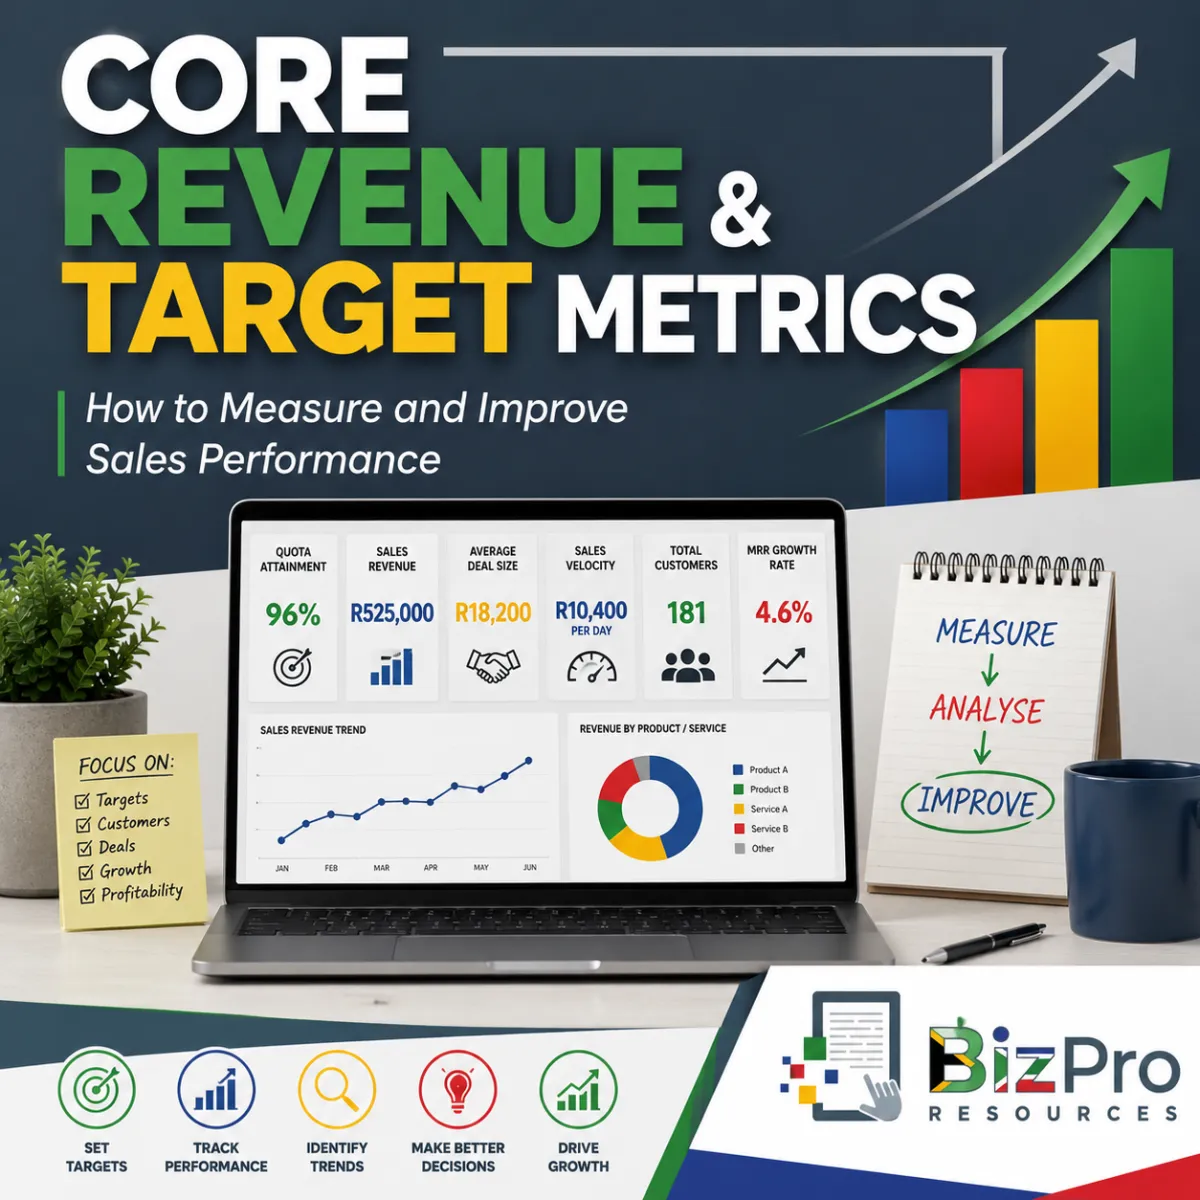
Core Revenue and Target Metrics: How to Measure and Improve Sales Performance
Article #1 of #2 in the Sales Metrics Series
Introduction
Sales are the lifeblood of almost every business.
A company can have excellent products, skilled employees, good customer service, and strong operational systems, but if it cannot consistently generate enough sales revenue, the business will eventually struggle.
For a South African small business owner, however, simply looking at the amount of money coming in is not enough.
You also need to understand how well your sales activities are performing.
Are your salespeople reaching their targets? Are customers spending more or less than before? Is the business winning enough new customers? How quickly are sales opportunities turning into revenue? Is recurring revenue growing?
These questions can be answered using sales metrics.
Sales metrics are measurable numbers that help business owners and managers understand the performance of their sales activities. They turn sales information into something that can be monitored, compared, and improved.
In this article, we will focus on six important core revenue and target metrics:
Quota Attainment
Sales Revenue
Average Deal Size
Sales Velocity
Total Customers
Monthly Recurring Revenue (MRR) Growth Rate
You do not need to be a financial expert to use these metrics. Most can be calculated using information that already exists in your accounting system, CRM, invoicing software, sales reports, or even a well-maintained spreadsheet.
The important part is understanding what the numbers are telling you about your business.
Why Core Sales Metrics Matter
Many small business owners judge sales performance mainly by asking: “How much did we sell this month?”
That is an important question, but it only tells part of the story. Imagine two companies each generate R500,000 in sales during a month. At first, their sales performance appears identical.
But suppose Company A expected to generate R800,000 while Company B expected to generate R450,000.
Company A has significantly missed its target.
Company B has exceeded its target.
Now suppose Company A generated its R500,000 from only five large customers, while Company B generated its R500,000 from 70 customers.
The risk profiles of the two businesses are also very different.
This is why businesses should monitor several sales metrics together rather than relying on one number.
A useful sales dashboard might show:
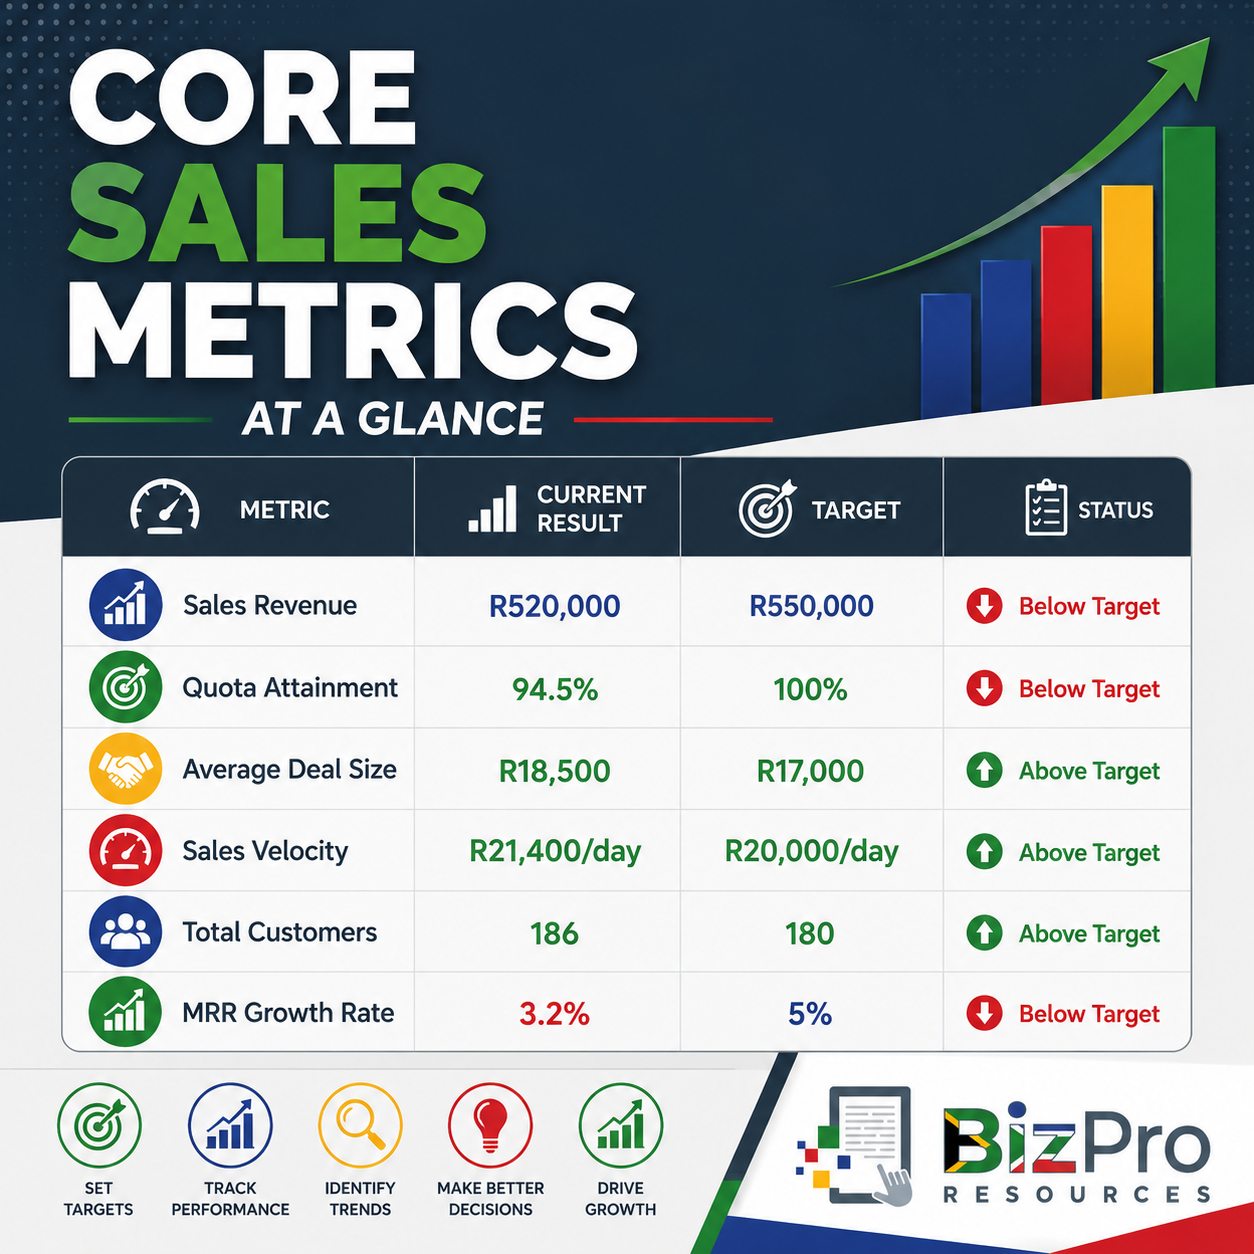
This gives management a much clearer picture of what is happening.
Let us examine each metric.
1. Quota Attainment
What Is Quota Attainment?
A sales quota is a target that a salesperson, sales team, branch, or business is expected to achieve during a specific period.
Quota attainment measures how much of that target was actually achieved.
For example, a salesperson may have a monthly sales target of R200,000.
If the salesperson generates R180,000 in sales, they have achieved 90% of their quota.
Quota attainment is especially useful for businesses that employ sales representatives, account managers, business development staff, telesales teams, or other employees responsible for generating revenue.
However, even a small owner-managed business can use the metric.
The business owner can simply set a monthly sales target for the company and measure actual sales against it.
How Is Quota Attainment Calculated?
The basic formula is: Quota Attainment (%) = Actual Sales ÷ Sales Quota × 100
For example:
Monthly sales quota = R300,000
Actual monthly sales = R270,000
Therefore: R270,000 ÷ R300,000 × 100 = 90%. The business achieved 90% quota attainment.
If actual sales were R330,000: R330,000 ÷ R300,000 × 100 = 110%. The business achieved 110% quota attainment.
This means it exceeded its target by 10%.
Example of Poor Performance
Imagine a security installation company has three sales representatives:
Each salesperson has a monthly sales quota of R250,000.
One salesperson generates only R150,000.
Their quota attainment is: R150,000 ÷ R250,000 × 100 = 60%. A quota attainment rate of 60% means the salesperson achieved only 60% of the expected target. This should trigger investigation.
Possible reasons could include:
Too few sales leads.
Poor lead quality.
Low conversion rates.
Weak sales skills.
Slow follow-up with potential customers.
Pricing problems.
Strong competitor activity.
Unrealistic sales targets.
Insufficient product knowledge.
Problems with the company's reputation or service offering.
Management should not automatically assume that the salesperson is the problem.
Poor quota attainment tells you that there is a performance gap. It does not automatically tell you why the gap exists.
Further investigation is required.
Example of Good Performance
Suppose another salesperson has the same R250,000 monthly quota but generates R287,500.
Their quota attainment is: R287,500 ÷ R250,000 × 100 = 115%.
The salesperson achieved 115% of quota. This means they exceeded their target by 15%.
This is generally positive. Management should investigate what contributed to the strong performance.
Perhaps the salesperson:
Responds to leads quickly.
Has strong product knowledge.
Builds good customer relationships.
Is effective at following up quotations.
Generates referrals.
Sells higher-value solutions.
Has developed a particularly valuable customer segment.
Understanding why someone performs well allows the business to identify practices that could potentially be shared with the rest of the sales team.
What Should the Business Watch?
Do not look only at one month. Track quota attainment over time.
A salesperson achieving: 98% → 101% → 104% → 108% is showing a positive trend.
Someone achieving: 105% → 92% → 76% → 61% may have a developing problem that requires attention.
2. Sales Revenue
What Is Sales Revenue?
Sales revenue is the income generated from selling the company's products or services during a specific period.
It is one of the most fundamental sales metrics in any business.
Depending on the business, revenue can be monitored:
Daily.
Weekly.
Monthly.
Quarterly.
Annually.
By salesperson.
By branch.
By product.
By service.
By customer.
By geographical area.
A plumbing company, for example, might track revenue separately for:
Emergency call-outs.
Maintenance work.
Bathroom renovations.
Geyser installations.
Commercial contracts.
This allows management to see where the company's revenue is actually coming from.
How Is Sales Revenue Calculated?
At its simplest: Sales Revenue = Quantity Sold × Selling Price.
If a business sells 100 units at R1,500 each: 100 × R1,500 = R150,000. Sales revenue is therefore R150,000.
Service businesses may calculate revenue differently.
For example, an accounting practice may invoice:
Bookkeeping services = R80,000
Payroll services = R35,000
Tax services = R50,000
Advisory services = R25,000
Total sales revenue: R80,000 + R35,000 + R50,000 + R25,000 = R190,000. Monthly sales revenue is therefore R190,000. Remember that revenue is not the same as profit.
If you generate R500,000 in revenue but spend R480,000 delivering the work and operating the business, you have not made R500,000 profit.
Revenue tells you about sales activity. Profit tells you what remains after relevant costs and expenses are taken into account.
Example of Poor Performance
Suppose an electrical contractor normally generates around R600,000 in monthly revenue.
Over four months, revenue looks like this:
Month 1 - R610,000
Month 2 - R565,000
Month 3 - R490,000
Month 4 - R410,000
Revenue has fallen from R610,000 to R410,000. That is a decline of approximately 32.8%. This is a serious warning sign.
The business may be:
Losing customers.
Receiving fewer enquiries.
Converting fewer quotations.
Losing work to competitors.
Experiencing pricing pressure.
Losing important contracts.
Suffering from poor customer service.
Failing to generate enough new business.
If the company's fixed costs remain unchanged while revenue falls, profitability and cash flow may quickly come under pressure.
Example of Good Performance
Now imagine revenue moves in the opposite direction:
Month 1 - R410,000
Month 2 - R455,000
Month 3 - R510,000
Month 4 - R585,000
This indicates strong revenue growth.
It could mean that the company is:
Winning more customers.
Increasing prices successfully.
Selling larger jobs.
Improving conversion rates.
Expanding into new markets.
Generating more repeat business.
However, management should still check profitability.
Growing revenue is valuable only if the company can deliver those sales profitably and manage the additional cash-flow and operational requirements.
3. Average Deal Size
What Is Average Deal Size?
Average Deal Size tells you the average monetary value of the sales deals your business closes.
It answers the question: “On average, how much revenue do we generate every time we win a sale?”
This metric is particularly useful for businesses that sell projects, contracts, installations, professional services, equipment, or other clearly identifiable sales transactions.
For example, a surveillance company may complete jobs ranging from:
R4,000 residential camera installations,
to R25,000 small business installations,
to R150,000 commercial surveillance projects.
Average Deal Size helps management understand the typical value of the work being won.
How Is Average Deal Size Calculated?
The formula is: Average Deal Size = Total Revenue from Closed Deals ÷ Number of Closed Deals
Suppose the business closes 20 deals during the month worth a combined R400,000: R400,000 ÷ 20 = R20,000
Average Deal Size is therefore: R20,000
Example of Poor Performance
Suppose an IT services company historically achieves an Average Deal Size of R30,000.
Recently the results have been:
Month 1 - R31,000
Month 2 - R27,500
Month 3 - R22,000
Month 4 - R17,500
The declining Average Deal Size may indicate that the business is increasingly winning smaller jobs. This may become a problem if acquiring and servicing each customer requires significant time.
For example, winning ten R10,000 customers may require considerably more administration, sales effort, onboarding, invoicing, and support than winning one R100,000 customer.
Possible reasons for falling Average Deal Size include:
Salespeople discounting heavily.
Fewer premium products being sold.
Poor upselling.
Poor cross-selling.
Losing larger customers.
Focusing on the wrong market segment.
Example of Good Performance
Suppose the company deliberately introduces bundled service packages and trains salespeople to identify additional customer needs.
Average Deal Size increases: R17,500 → R21,000 → R25,500 → R29,000
This could indicate that the sales team is successfully selling more valuable solutions.
For example, instead of selling only a basic installation, the company may now sell: Installation + maintenance + monitoring + support.
This increases the value generated from each successful sale.
However, increasing deal size should not come at the expense of conversion rate. If customers reject increasingly expensive proposals, the business may eventually win fewer deals.
4. Sales Velocity
What Is Sales Velocity?
Sales Velocity measures how quickly sales opportunities move through your sales pipeline and become revenue.
In simple terms, it helps answer: “How quickly is our current sales pipeline producing money?”
This metric combines four important parts of sales performance:
Number of sales opportunities.
Average deal size.
Win rate.
Length of the sales cycle.
This makes Sales Velocity particularly useful because it does not look at only one part of the sales process.
How Is Sales Velocity Calculated?
A commonly used formula is: Sales Velocity = Number of Opportunities × Average Deal Size × Win Rate ÷ Average Sales Cycle Length
Suppose a company has:
50 active opportunities
Average Deal Size = R20,000
Win Rate = 30%
Average Sales Cycle = 30 days
The calculation is: 50 × R20,000 × 30% ÷ 30 = R10,000 per day
This means the pipeline is theoretically producing revenue at a rate of approximately R10,000 per day, based on the assumptions used.
Example of Poor Performance
Imagine a commercial cleaning company has:
40 opportunities
Average Deal Size = R15,000
Win Rate = 15%
Average Sales Cycle = 60 days
Sales Velocity: 40 × R15,000 × 15% ÷ 60 = R1,500 per day
The low Sales Velocity could indicate several problems.
The company may:
Have too few opportunities.
Be targeting poor-quality prospects.
Have a low win rate.
Take too long to close deals.
Have low-value opportunities.
Management can now investigate which part of the formula is causing the problem.
For example, shortening the sales cycle from 60 days to 30 days would double Sales Velocity if everything else remained equal.
Example of Good Performance
Suppose improvements produce the following:
60 opportunities
Average Deal Size = R18,000
Win Rate = 35%
Average Sales Cycle = 30 days
Sales Velocity becomes: 60 × R18,000 × 35% ÷ 30 = R12,600 per day
This is significantly stronger. The company is now moving more potential revenue through its pipeline at a much faster rate.
The improvement could have resulted from:
Better lead generation.
Faster quotations.
Better follow-up.
Stronger sales skills.
Improved qualification of prospects.
Higher-value packages.
Shorter approval processes.
Sales Velocity is powerful because it helps management identify where changes to the sales process can produce better results.
5. Total Customers
What Is Total Customers?
Total Customers measures the number of customers currently buying from or actively doing business with your company.
It sounds extremely simple, but it is an important indicator of business health. Revenue can sometimes hide customer problems.
Imagine a company increases revenue by 10%, but its total number of customers falls by 40%. The company may have become heavily dependent on a small number of large customers.
That could create significant risk.
Total Customers should therefore be monitored together with revenue and customer concentration.
How Is Total Customers Calculated?
The simplest calculation is: Total Customers = Number of Unique Active Customers During the Period
For example, if 185 different customers purchased from the company during the month: Total Customers = 185
For businesses with ongoing contracts or subscriptions, the company may instead count active customer accounts at the end of the month.
The business should clearly define what it considers an active customer and use the same definition consistently.
Example of Poor Performance
Suppose an auto repair business has the following customer numbers:
Month 1 - 240
Month 2 - 225
Month 3 - 198
Month 4 - 172
The business has lost 68 active customers compared with Month 1. That represents a decline of approximately 28%.
This may indicate:
Poor customer retention.
Weak customer service.
Increased competition.
Pricing problems.
Poor quality.
Fewer new customers.
Negative reviews.
Reduced marketing activity.
Even if revenue has not yet fallen significantly, management should investigate.
A shrinking customer base can be an early warning sign of future revenue problems.
Example of Good Performance
Now suppose customer numbers increase: 172 → 190 → 215 → 246
This indicates that the business is successfully expanding its customer base.
Possible reasons include:
Effective marketing.
More referrals.
Better online visibility.
Strong customer service.
Better sales conversion.
Expansion into a new area.
New products or services.
However, management should still examine the quality of those customers.
Adding 100 customers who each spend very little and require significant service may not be as valuable as adding 20 profitable long-term customers.
The goal is not simply more customers.
The goal is more valuable and sustainable customer relationships.
6. MRR Growth Rate
What Is Monthly Recurring Revenue?
Monthly Recurring Revenue, commonly called MRR, is the predictable revenue that a company expects to receive every month from recurring customers.
This metric is especially useful for businesses operating with:
Monthly subscriptions.
Service contracts.
Maintenance agreements.
Retainers.
Software subscriptions.
Security monitoring contracts.
Managed IT services.
Monthly accounting packages.
Membership services.
For example, a security company may install alarm systems but also charge customers a monthly monitoring fee.
Those monthly monitoring fees create recurring revenue.
What Is MRR Growth Rate?
MRR Growth Rate measures how quickly Monthly Recurring Revenue is increasing or decreasing from one period to another.
It helps management answer: “Is our recurring revenue base growing?”
Recurring revenue can be extremely valuable because it makes future income more predictable.
How Is MRR Growth Rate Calculated?
The basic formula is: MRR Growth Rate (%) = (Current MRR − Previous MRR) ÷ Previous MRR × 100
Suppose:
Previous month's MRR = R200,000
Current month's MRR = R220,000
Calculation: (R220,000 − R200,000) ÷ R200,000 × 100 = 10%
The company's MRR grew by 10%.
Example of Poor Performance
Suppose an IT support company has the following MRR:
Month 1 - R300,000
Month 2 - R294,000
Month 3 - R280,000
Month 4 - R260,000
From Month 3 to Month 4: (R260,000 − R280,000) ÷ R280,000 × 100 = −7.14%
MRR has contracted by approximately 7.1% in one month. This is concerning.
It could indicate:
Customers cancelling contracts.
Customers downgrading packages.
Too few new recurring customers.
Poor service.
Competitor pressure.
Pricing problems.
Contract losses.
Declining MRR is particularly important because it affects future revenue, not merely revenue already lost. If R20,000 of monthly recurring revenue disappears, the potential annualised effect is: R20,000 × 12 = R240,000.
That makes recurring revenue losses important to investigate quickly.
Example of Good Performance
Suppose MRR grows as follows:
Month 1 - R260,000
Month 2 - R275,000
Month 3 - R295,000
Month 4 - R320,000
Growth from Month 3 to Month 4 is: (R320,000 − R295,000) ÷ R295,000 × 100 = approximately 8.5%
This is strong growth.
It may indicate that the company is:
Signing new recurring customers.
Retaining existing customers.
Upselling existing accounts.
Increasing prices successfully.
Moving customers onto higher-value packages.
Growing MRR can make a business more stable because management starts each month with a predictable base of contracted or recurring revenue.
Do Not Look at Sales Metrics in Isolation
One of the most important lessons in sales measurement is that one metric rarely tells the entire story.
Consider this situation: Sales Revenue is increasing. That sounds positive.
But suppose:
Total Customers are falling.
Average Deal Size is increasing sharply.
One major customer now represents a large percentage of total sales.
The company may be growing revenue while becoming dangerously dependent on a few customers.
Or imagine: Total Customers are increasing rapidly. Again, that sounds positive.
But suppose:
Average Deal Size is falling.
Sales Velocity is slowing.
Sales costs are increasing.
Revenue growth is weak.
The business may be attracting many low-value customers who are expensive to acquire and service.
Metrics become most useful when they are read together.
Build a Simple Core Sales Dashboard
You do not need expensive business intelligence software to start monitoring sales performance.
A spreadsheet can be enough.
For example:
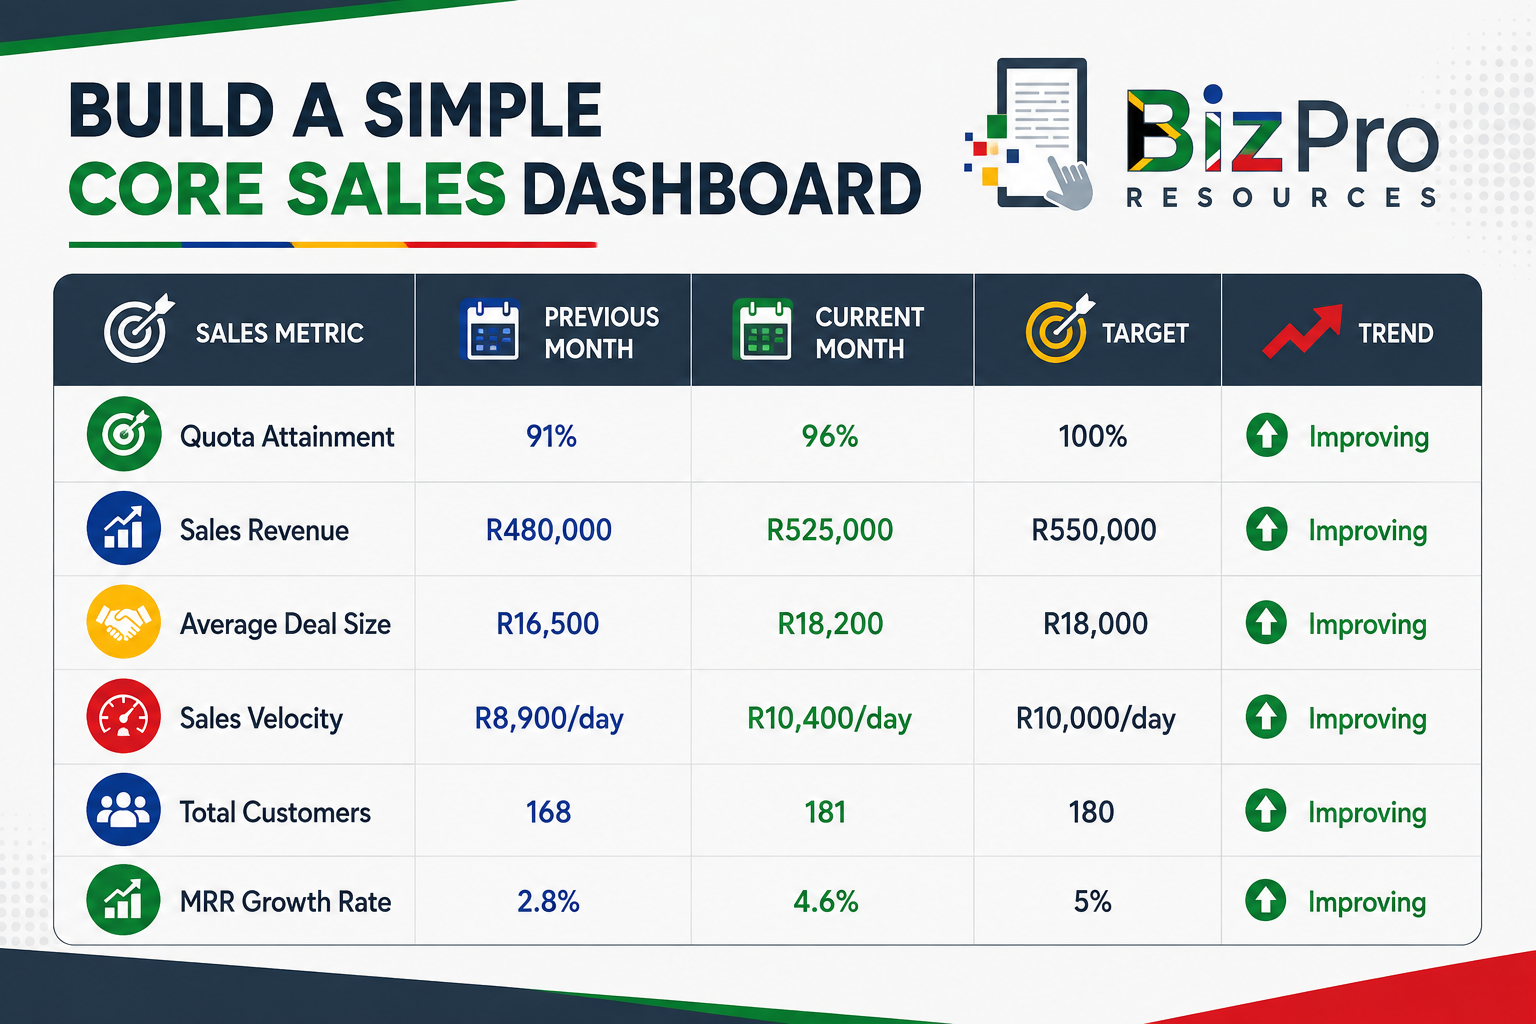
This allows management to see quickly where attention is required.
For example: Average Deal Size, Sales Velocity, and Total Customers are above target.
Quota Attainment, Sales Revenue, and MRR Growth Rate are improving but still below target.
That gives the sales manager a much better starting point for discussion than simply saying: “We need more sales.”
Turn Sales Numbers into Management Questions
The real value of sales metrics comes from the questions they encourage management to ask.
If Quota Attainment is poor: Why are we missing our sales targets?
If Sales Revenue is falling: Are we losing customers, selling less, discounting too much, or winning fewer deals?
If Average Deal Size is falling: Are we attracting smaller customers or failing to upsell and cross-sell?
If Sales Velocity is slowing: Where are opportunities getting stuck in the sales process?
If Total Customers are declining: Are we failing to attract new customers or losing existing ones?
If MRR Growth Rate is negative: Are cancellations and downgrades exceeding new recurring business?
This is the difference between simply reporting numbers and actually managing performance.
Compare Results Against Targets and Trends
A sales number becomes much more useful when you have something to compare it against.
There are three particularly useful comparisons.
Compare Against the Target
If the target was R500,000 and sales were R510,000, performance exceeded target.
If sales were R350,000, there is a significant gap requiring investigation.
Compare Against Previous Periods
A company may generate R500,000 this month and believe that performance is good.
But if it generated R650,000 in the same month last year, the picture changes.
Historical comparisons help reveal trends.
Compare Different Parts of the Business
You may also compare:
Salespeople.
Branches.
Products.
Services.
Customer segments.
Regions.
Marketing channels.
For example, one salesperson may have 115% quota attainment while another has 62%. That difference deserves investigation.
The purpose should not simply be to criticise the weaker performer.
The objective is to understand why the results differ and what management can do about it.
Be Careful with Targets
Targets are useful, but poorly designed targets can create bad behaviour.
For example, if salespeople are rewarded only for revenue, they may be tempted to:
Offer excessive discounts.
Sell to poor-quality customers.
Promise unrealistic delivery dates.
Push products customers do not need.
Ignore profitability.
Focus on short-term sales rather than long-term relationships.
A business therefore needs balanced sales targets.
Revenue matters, but so do:
Profitability.
Customer retention.
Payment behaviour.
Customer satisfaction.
Deal quality.
Sustainable growth.
The best sale is not necessarily the biggest sale.
It is a sale that creates profitable, sustainable value for the business.
How Often Should You Review These Metrics?
The appropriate frequency depends on the business. A high-volume retail or telesales business may monitor some metrics daily.
A project-based engineering company with a long sales cycle may focus more heavily on weekly and monthly reporting.
For many small businesses, a practical approach is:
Weekly Review:
Sales Revenue.
Opportunities.
Sales Velocity.
Quota progress.
Monthly Review:
Quota Attainment.
Total Sales Revenue.
Average Deal Size.
Total Customers.
MRR Growth Rate.
Trends compared with previous months.
Quarterly Review:
Look for broader patterns and consider whether:
Targets need adjustment.
Sales territories need changing.
Products need repositioning.
Pricing needs reviewing.
Salespeople need training.
Marketing activity needs changing.
New customer segments should be targeted.
The important thing is consistency.
A metric that is calculated differently every month becomes difficult to compare.
What Does Good Sales Performance Really Look Like?
There is no single percentage or number that represents good performance for every business. A R50,000 Average Deal Size could be excellent for one company and terrible for another. A 30-day sales cycle could be extremely slow for one business and exceptionally fast for another.
The right benchmark depends on:
Your industry.
Your products and services.
Your pricing.
Your customer type.
Your business model.
Your historical performance.
Your sales strategy.
This is why small businesses should first establish their own baseline. Track the metrics consistently. Understand what normal performance looks like.
Then set realistic improvement targets.
For example:
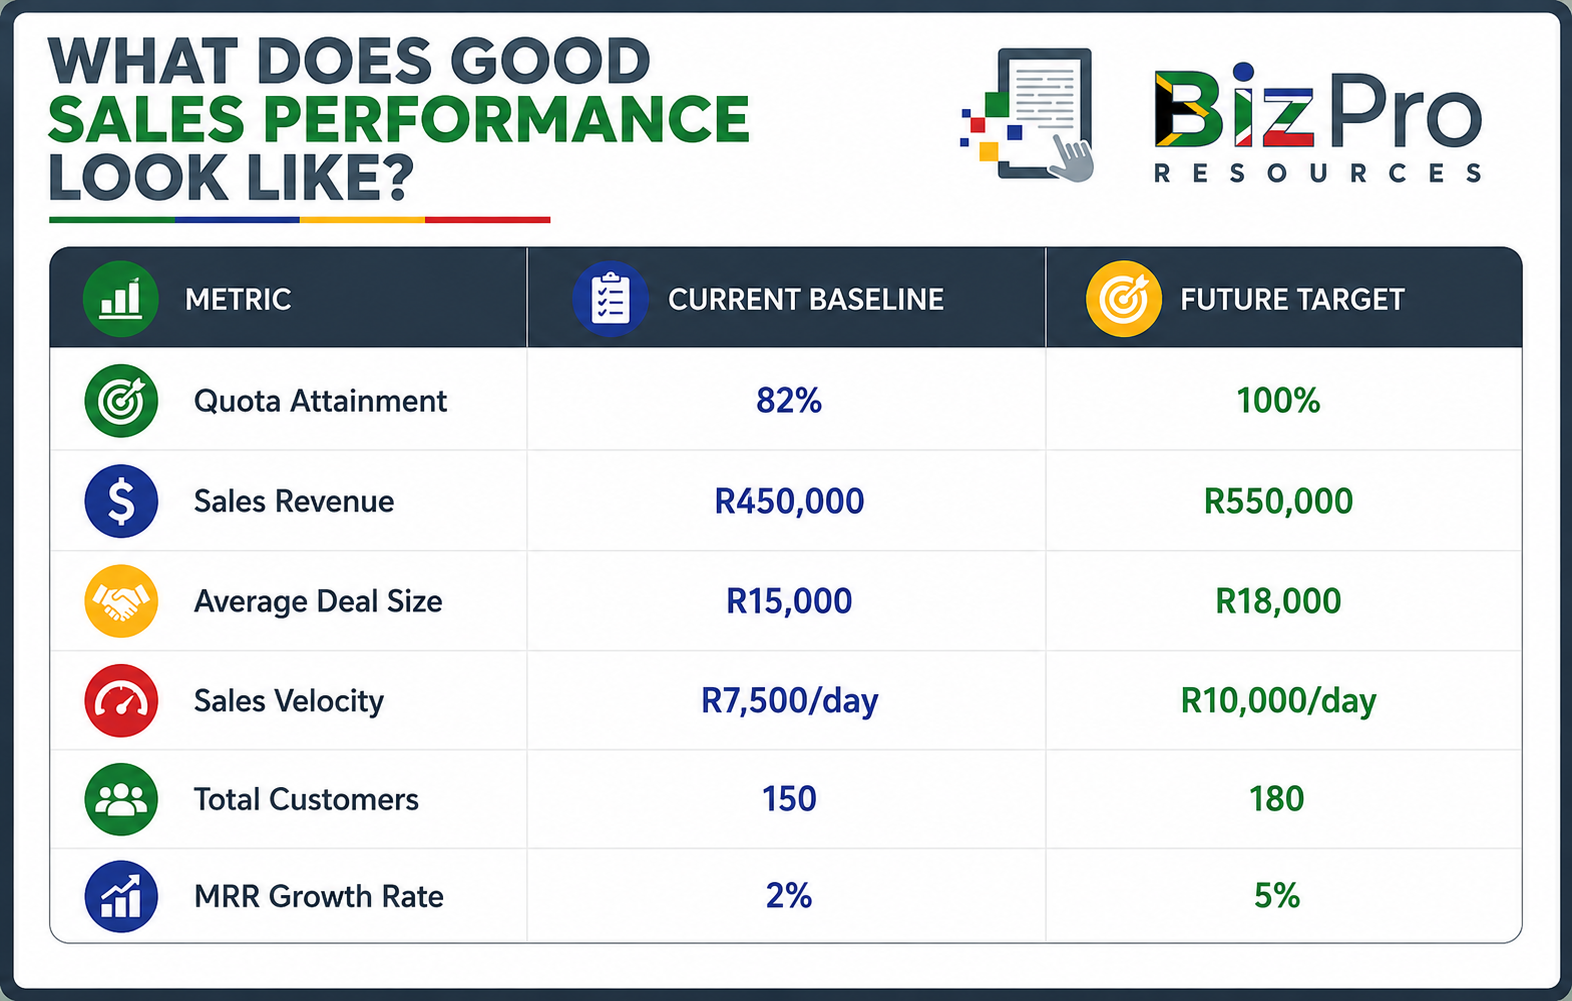
Now the business has something measurable to work towards.
From Measuring Sales to Improving Sales
Sales metrics should never become numbers that management calculates simply because they look impressive on a report.
Every metric should help the business make better decisions:
If Quota Attainment is falling, investigate why.
If revenue is declining, identify where the decline is coming from.
If Average Deal Size is shrinking, examine pricing, customer segments, upselling, and product mix.
If Sales Velocity is slow, identify bottlenecks in the pipeline.
If Total Customers are declining, examine customer acquisition and retention.
If MRR is shrinking, investigate cancellations, downgrades, and new recurring sales.
The purpose of measurement is action.
A simple management process is: Measure → Compare → Investigate → Act → Measure Again
For example:
Measure: Average Deal Size has fallen from R25,000 to R18,000.
Compare: The target is R24,000.
Investigate: Salespeople are selling more entry-level packages and fewer premium solutions.
Act: Provide product training, improve bundled offers, and introduce better upselling questions.
Measure Again: Average Deal Size increases to R22,500 over the next two months.
That is how a metric becomes a management tool rather than simply another number on a spreadsheet.
Final Thoughts
Sales performance should never be judged using guesswork. A business owner may feel that sales are going well because employees are busy, quotations are being sent, phones are ringing, and customers are making enquiries.
But activity does not always equal results.
Core revenue and target metrics give you measurable evidence of what is actually happening:
Quota Attainment tells you whether sales targets are being achieved.
Sales Revenue tells you how much income your sales activities are generating.
Average Deal Size tells you the typical value of the sales you are winning.
Sales Velocity tells you how quickly opportunities are turning into revenue.
Total Customers tells you whether your customer base is growing or shrinking.
MRR Growth Rate tells you whether your recurring revenue base is expanding or contracting.
Individually, each metric provides useful information. Together, they provide a much clearer picture of the health and direction of your sales operation.
For a small business, the goal is not to build the most complicated sales dashboard possible.
The goal is to identify a manageable number of useful metrics, calculate them consistently, monitor the trends, and act when the numbers show that something is changing.
You do not need hundreds of sales reports. You need the right numbers, understood properly and used consistently.
That is what turns sales data into better business decisions.
Related Articles in the Sales Metrics Series
Core Revenue and Target Metrics: How to Measure and Improve Sales Performance
Value and Cost Metrics: How to MEasure Customer Retention, Lifetime Value, and Reveue
AI Disclaimer
AI Tools were used to assist with research. Remember to always cross-check everything that you read.


