
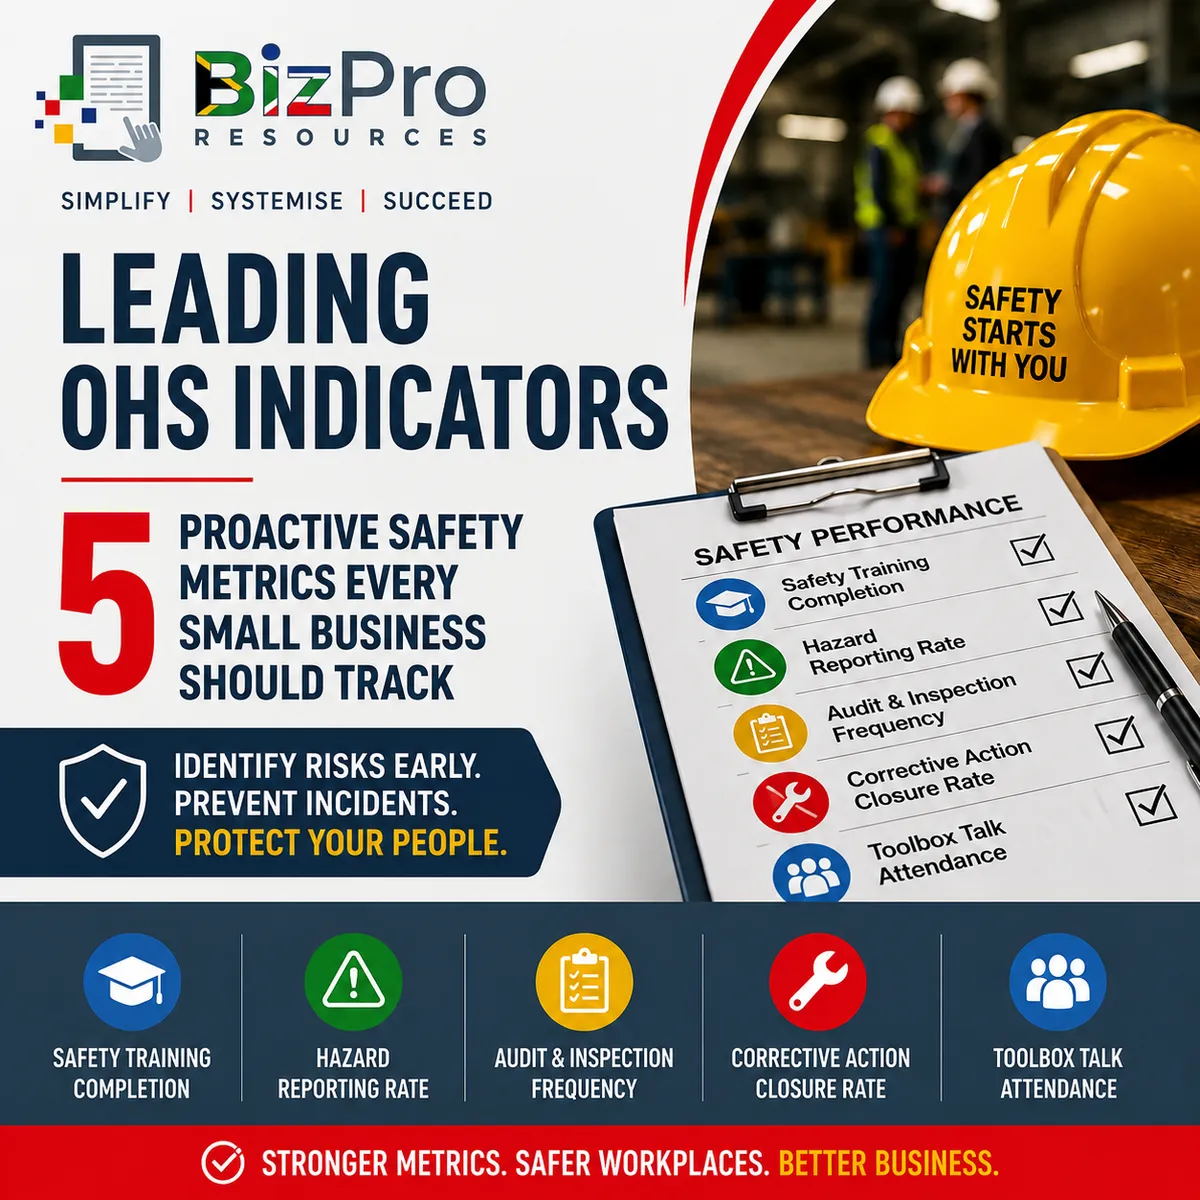
Leading OHS Indicators: 5 Proactive Safety Metrics Every Small Business Should Track
Article #1 of #2 in the OHS Performance Metrics Series
Introduction
Occupational health and safety is often measured by looking at what has already gone wrong.
How many employees were injured? How many working days were lost? How many compensation claims were submitted? How serious were the incidents?
These are important questions, but they all have one limitation: They measure events after they have happened.
A strong occupational health and safety system should also measure what the business is doing before an employee gets hurt.
This is where leading indicators become important.
Leading indicators are proactive safety measures. They help business owners and managers monitor whether important safety activities are actually taking place.
For a South African small business, useful leading indicators include:
Safety Training Completion
Hazard Reporting Rate
Audit and Inspection Frequency
Corrective Action Closure Rate
Toolbox Talk Attendance
These metrics do not guarantee that accidents will never happen. However, they can provide early warning signs that the safety system is becoming weaker.
For example, imagine that a business has had no serious injuries during the past six months.
That sounds positive.
But during the same period:
only 55% of required safety training was completed;
employees stopped reporting hazards;
workplace inspections were regularly missed;
corrective actions remained open for months; and
toolbox talk attendance dropped significantly.
The absence of injuries may simply mean that the business has been fortunate.
The leading indicators are showing that the risk of a future incident may be increasing.
This article explains five practical proactive OHS metrics that small businesses can use to measure whether their safety systems are working.
What Are Leading Safety Indicators?
Leading indicators measure activities, behaviours, processes, and controls that are intended to prevent incidents.
They answer questions such as:
Are employees receiving the required safety training?
Are hazards being identified and reported?
Are inspections actually taking place?
Are safety problems being corrected?
Are employees participating in regular safety discussions?
This makes leading indicators different from lagging indicators.
A lagging indicator measures something that has already happened, such as an injury, lost-time incident, or workers' compensation claim.
A leading indicator measures whether the business is doing the things that should reduce the likelihood of those incidents occurring.
Think about it this way:
Lagging indicator: How many employees were injured?
Leading indicator: What are we doing to prevent employees from being injured?
Both are necessary.
A business should not choose between leading and lagging indicators. It should use them together to build a more complete picture of safety performance.
1. Safety Training Completion
What Is Safety Training Completion?
Safety Training Completion measures the percentage of required occupational health and safety training that employees have successfully completed.
Different employees may require different training depending on their work.
Examples could include:
induction training;
safe use of machinery;
personal protective equipment training;
working-at-height training;
manual handling;
emergency procedures;
fire safety;
chemical handling;
first-aid-related training;
equipment-specific safety training; and
refresher training.
The business should first determine what training is required for each employee or job category. It can then monitor whether that training has actually been completed.
This distinction is important.
Simply offering a training course does not mean employees have completed it. For example, a business may arrange safety training for 20 employees, but only 13 attend.
The business has provided the opportunity, but its training completion rate is only 65%.
How Is Safety Training Completion Calculated?
A simple formula is: Safety Training Completion (%) = Completed Required Training ÷ Total Required Training × 100
The calculation can be done using individual employees, required courses, or training assignments.
For example, suppose a workshop has 20 employees who must complete annual safety refresher training.
Eighteen employees complete the training:
The calculation is: 18 ÷ 20 × 100 = 90%
The Safety Training Completion rate is therefore: 90%
A more detailed business may calculate the metric based on individual training requirements.
For example:
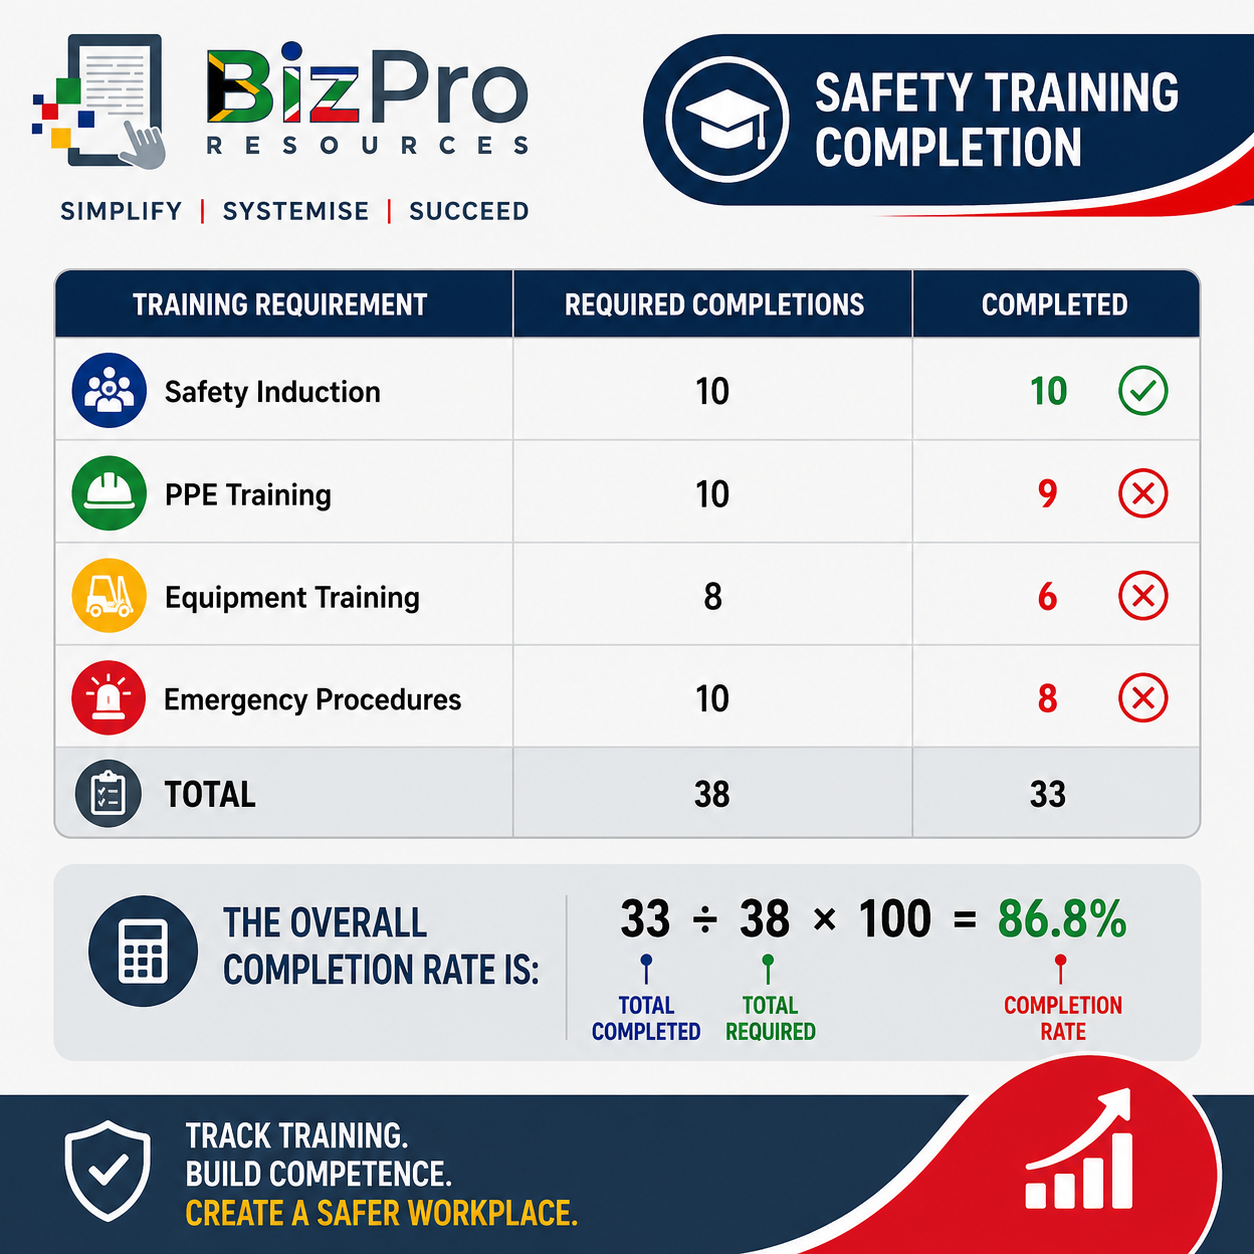
The overall completion rate is: 33 ÷ 38 × 100 = 86.8%
Example of Poor Safety Training Completion
Imagine an electrical contracting business with 30 employees:
During a quarterly review, management discovers that employees collectively had 60 required training assignments.
Only 39 were completed.
The calculation is: 39 ÷ 60 × 100 = 65%
The company's Safety Training Completion rate is therefore: 65%
This means 35% of required training remains incomplete.
That should concern management.
Employees may be performing work without having completed the necessary safety instruction or refresher training. The company should investigate why.
Possible causes could include:
supervisors are not releasing employees for training;
training dates are poorly scheduled;
new employees are being sent to sites before completing induction;
training records are poorly maintained;
refresher training is being overlooked;
managers do not know which training is outstanding; or
employees do not understand that the training is compulsory.
The metric does not simply tell management that the result is poor.
It tells management where further investigation is required.
Example of Good Safety Training Completion
Now imagine the company improves its system:
Three months later, there are 64 required training assignments and 63 have been completed.
The calculation becomes: 63 ÷ 64 × 100 = 98.4%
This indicates that the training system is functioning much more effectively.
Management can also immediately investigate the one outstanding requirement rather than allowing a large backlog to develop.
A high completion rate suggests that:
safety training is being planned;
supervisors are supporting attendance;
employees understand their responsibilities;
training records are being monitored; and
outstanding requirements are being identified quickly.
However, there is an important warning: Training completion does not automatically mean training effectiveness.
An employee can attend a course without understanding or applying what was taught.
Businesses should therefore combine completion data with observations, assessments, inspections, incident investigations, and employee feedback.
2. Hazard Reporting Rate
What Is the Hazard Reporting Rate?
A hazard is something that has the potential to cause harm.
Examples include:
a damaged electrical cable;
an oil spill on a workshop floor;
missing machine guarding;
an unstable ladder;
blocked emergency exits;
damaged personal protective equipment;
unsafe stacking;
exposed wiring;
defective tools;
poor lighting;
unsafe driving behaviour; or
an unsafe work procedure.
Employees are often the people most likely to notice these hazards because they work with the equipment, processes, vehicles, customers, and workplace conditions every day.
The Hazard Reporting Rate measures how actively hazards are being identified and reported. This metric requires careful interpretation.
Unlike injuries, where a lower number is generally desirable, a low hazard reporting rate is not necessarily good.
If employees report no hazards, this could mean the workplace is extremely safe.
But it could also mean: Employees are simply not reporting what they see.
How Is the Hazard Reporting Rate Calculated?
Businesses can measure hazard reporting in several ways.
A simple method is: Hazard Reporting Rate = Number of Hazards Reported ÷ Number of Employees
For easier comparison, a company could express this per 10 or 100 employees.
For example: Hazards Reported per 10 Employees = Hazards Reported ÷ Number of Employees × 10
Suppose a business employing 50 people receives 20 hazard reports during a month.
The calculation is: 20 ÷ 50 × 10 = 4
The company therefore received: 4 hazard reports per 10 employees
The business could also simply track the number of hazard reports per month if its workforce remains relatively stable.
The important point is consistency.
Choose a useful measurement method and use the same method over time.
Example of Poor Hazard Reporting Performance
Consider a manufacturing company with 80 employees:
During an entire month, employees submit only two hazard reports.
The calculation is: 2 ÷ 80 × 10 = 0.25 reports per 10 employees
At first, management might think: "Excellent. We hardly have any hazards."
That conclusion could be dangerous.
During management's own inspections, supervisors regularly find damaged tools, housekeeping problems, unsafe storage, and PPE issues.
The low reporting rate therefore does not appear to reflect an unusually safe workplace. It may indicate a weak reporting culture.
Employees might believe:
reporting takes too much time;
management will ignore the report;
they will be blamed for identifying problems;
reporting a hazard will create trouble for a colleague;
supervisors discourage complaints;
nothing ever gets fixed; or
safety reporting is management's responsibility rather than everyone's responsibility.
The business should therefore investigate why reporting is so low.
Example of Good Hazard Reporting Performance
Management introduces a simple hazard-reporting process.
Employees can quickly report hazards to supervisors, and management gives feedback on what happens to each report.
Over the following months, reports increase:
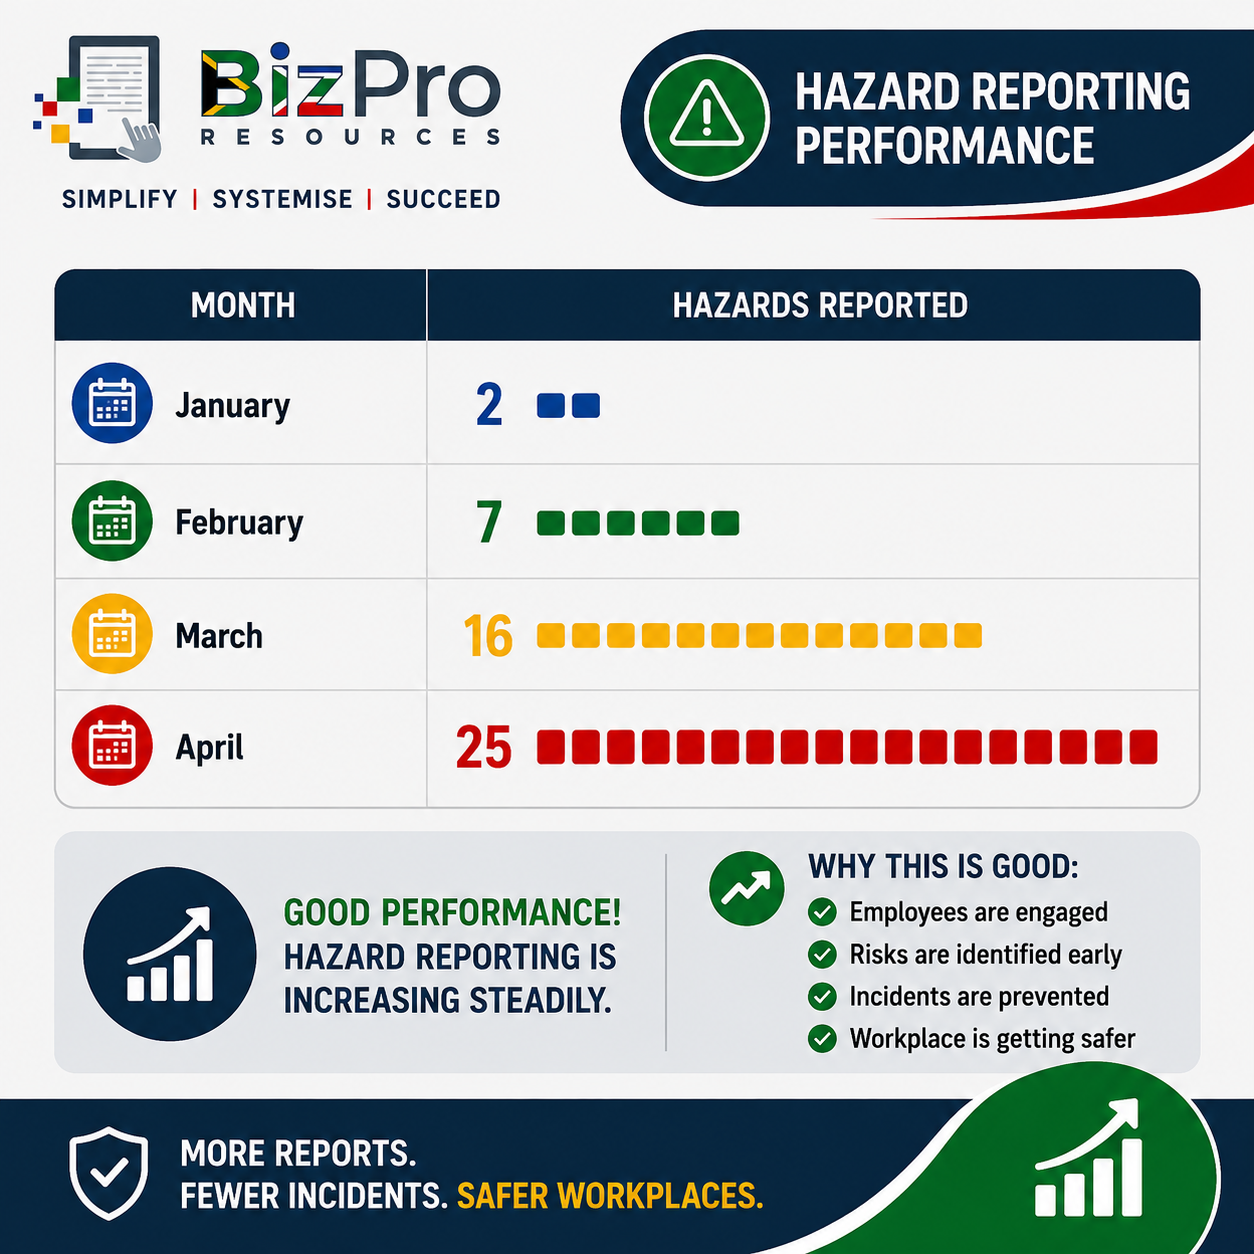
Some managers may initially become concerned because the number of reported hazards has increased dramatically.
But this could actually represent an improvement. Employees may now be actively identifying risks before they cause injuries.
If management investigates and closes those hazards, the reporting system becomes a valuable preventive tool.
The objective should therefore not necessarily be: "Reduce hazard reports."
A better objective is: "Encourage useful hazard reporting and make sure reported hazards are properly investigated and addressed."
3. Audit and Inspection Frequency
What Is Audit and Inspection Frequency?
Workplace inspections and safety audits help a business identify problems before they contribute to incidents.
An inspection generally focuses on workplace conditions, equipment, activities, or specific hazards.
For example, a supervisor may conduct a weekly workshop inspection covering:
housekeeping;
electrical cables;
machine guards;
fire equipment;
emergency exits;
PPE;
storage;
tools; and
warning signs.
An audit may examine the broader safety management system.
It might review:
policies;
procedures;
training records;
inspection records;
incident investigations;
corrective actions;
risk assessments; and
legal or internal compliance requirements.
Audit and Inspection Frequency measures whether these activities are taking place as planned.
How Is Audit and Inspection Frequency Calculated?
There are two useful ways to measure it.
The first is simply: Number of Audits or Inspections Completed During the Period, such as 12 workplace inspections per month
A more useful performance metric compares planned inspections with completed inspections: Inspection Completion Rate (%) = Inspections Completed ÷ Inspections Scheduled × 100
Suppose a company requires four site inspections every month. Only three are completed.
The calculation is: 3 ÷ 4 × 100 = 75%
The inspection completion rate is: 75%
This makes it easier to determine whether the company is following its own safety programme.
Example of Poor Audit and Inspection Performance
A construction company operates five active sites. Its safety programme requires each site to receive one formal inspection every week.
Over four weeks, the company should therefore conduct: 5 sites × 4 inspections = 20 inspections
However, only 11 inspections are completed.
The calculation is: 11 ÷ 20 × 100 = 55%
The company achieved only: 55% of its planned inspections
This is poor performance.
It could mean:
safety responsibilities are being neglected;
supervisors are too busy;
inspection schedules are unrealistic;
management is not monitoring completion;
safety personnel lack sufficient resources; or
operational production is being prioritised over safety activities.
Most importantly, hazards may remain unidentified for longer.
A missing inspection does not automatically cause an accident.
But repeated missed inspections weaken an important layer of prevention.
Example of Good Audit and Inspection Performance
After reviewing the problem, management introduces a formal inspection calendar and assigns responsibility to specific supervisors.
During the following month:
20 inspections are scheduled;
20 inspections are completed.
The calculation is: 20 ÷ 20 × 100 = 100%
The company has achieved: 100% inspection completion
This indicates that the planned inspection process is being followed. But management should not stop at the number.
A completed inspection has little value if someone simply ticks boxes without properly examining the workplace.
The company should also review:
what hazards were identified;
whether inspection quality is acceptable;
whether recurring problems appear;
whether corrective actions are assigned; and
whether those corrective actions are completed.
This leads directly to another important leading indicator.
4. Corrective Action Closure Rate
What Is Corrective Action Closure Rate?
Finding a safety problem is only useful if something is done about it. A corrective action is an action assigned to eliminate, control, or reduce an identified problem.
Corrective actions may result from:
safety inspections;
audits;
hazard reports;
incident investigations;
near-miss investigations;
risk assessments;
employee complaints;
management observations; or
equipment checks.
For example, an inspection identifies a damaged electrical extension lead.
The corrective action might be: Remove damaged extension lead from service and replace it by Friday.
A responsible person and deadline should be assigned.
Corrective Action Closure Rate measures how effectively the business completes these actions.
How Is Corrective Action Closure Rate Calculated?
A basic formula is: Corrective Action Closure Rate (%) = Corrective Actions Closed ÷ Corrective Actions Due × 100
The phrase "actions due" is important. If an action is not yet due, it should not necessarily be treated as overdue.
For example, suppose 25 corrective actions are due for completion during the month. Twenty-two are completed by their deadlines.
The calculation is: 22 ÷ 25 × 100 = 88%
The Corrective Action Closure Rate is: 88%
The business should also separately monitor overdue corrective actions, especially high-risk actions.
Example of Poor Corrective Action Closure
A logistics company conducts regular vehicle, warehouse, and workplace inspections. During the quarter, 40 corrective actions become due.
Only 21 are completed.
The calculation is: 21 ÷ 40 × 100 = 52.5%
The company's Corrective Action Closure Rate is: 52.5%
This means almost half of the required corrective actions remain unresolved.
That is a serious warning sign.
The company may be good at finding problems, but poor at fixing them.
Outstanding actions could include:
damaged equipment;
unsafe storage;
missing PPE;
vehicle defects;
broken lighting;
housekeeping problems;
missing warning signs; or
incomplete safety procedures.
Management should not be satisfied simply because inspections are taking place.
If hazards repeatedly appear on inspection reports without being corrected, the inspection process is not achieving its purpose.
Example of Good Corrective Action Closure
Management introduces a central corrective-action register.
Each action now includes:
the problem identified;
the risk level;
the corrective action required;
the responsible person;
the target completion date;
the actual completion date; and
verification that the action was completed properly.
During the following quarter, 46 actions become due and 44 are completed on time.
The calculation is: 44 ÷ 46 × 100 = 95.7%
The closure rate is therefore approximately: 96%
This suggests that the company is responding effectively to identified safety problems. Management should immediately investigate the two overdue items, particularly if either involves a high-risk hazard.
This highlights another important principle: Not all corrective actions have the same level of risk.
An overdue action relating to repainting a safety notice board is not equivalent to an overdue action involving a defective machine guard.
Management should therefore monitor both the closure rate and the risk level of overdue actions.
5. Toolbox Talk Attendance
What Is Toolbox Talk Attendance?
A toolbox talk is a short, practical safety discussion normally conducted with employees before work or at regular intervals.
It may focus on:
a particular workplace hazard;
lessons from a recent incident;
safe use of equipment;
PPE requirements;
housekeeping;
working at height;
manual handling;
vehicle safety;
customer-site risks;
weather conditions;
emergency procedures; or
a specific risk related to the day's work.
Toolbox talks are especially useful in businesses where working conditions change frequently.
Examples include:
construction;
electrical contracting;
plumbing;
security services;
maintenance;
transport;
warehousing;
manufacturing;
landscaping; and
field-service businesses.
Toolbox Talk Attendance measures how many of the employees expected to participate actually attend.
How Is Toolbox Talk Attendance Calculated?
The basic formula is: Toolbox Talk Attendance (%) = Employees Attending ÷ Employees Expected to Attend × 100
For example, 24 employees are expected to attend a toolbox talk.
Twenty-one attend.
The calculation is: 21 ÷ 24 × 100 = 87.5%
Toolbox Talk Attendance is therefore: 87.5%
A company can calculate this for individual talks and then track the trend over time.
Example of Poor Toolbox Talk Attendance
A maintenance company employs mobile technicians. Management requires a toolbox talk every Monday morning. Twenty employees are expected to attend.
During one month, attendance is:
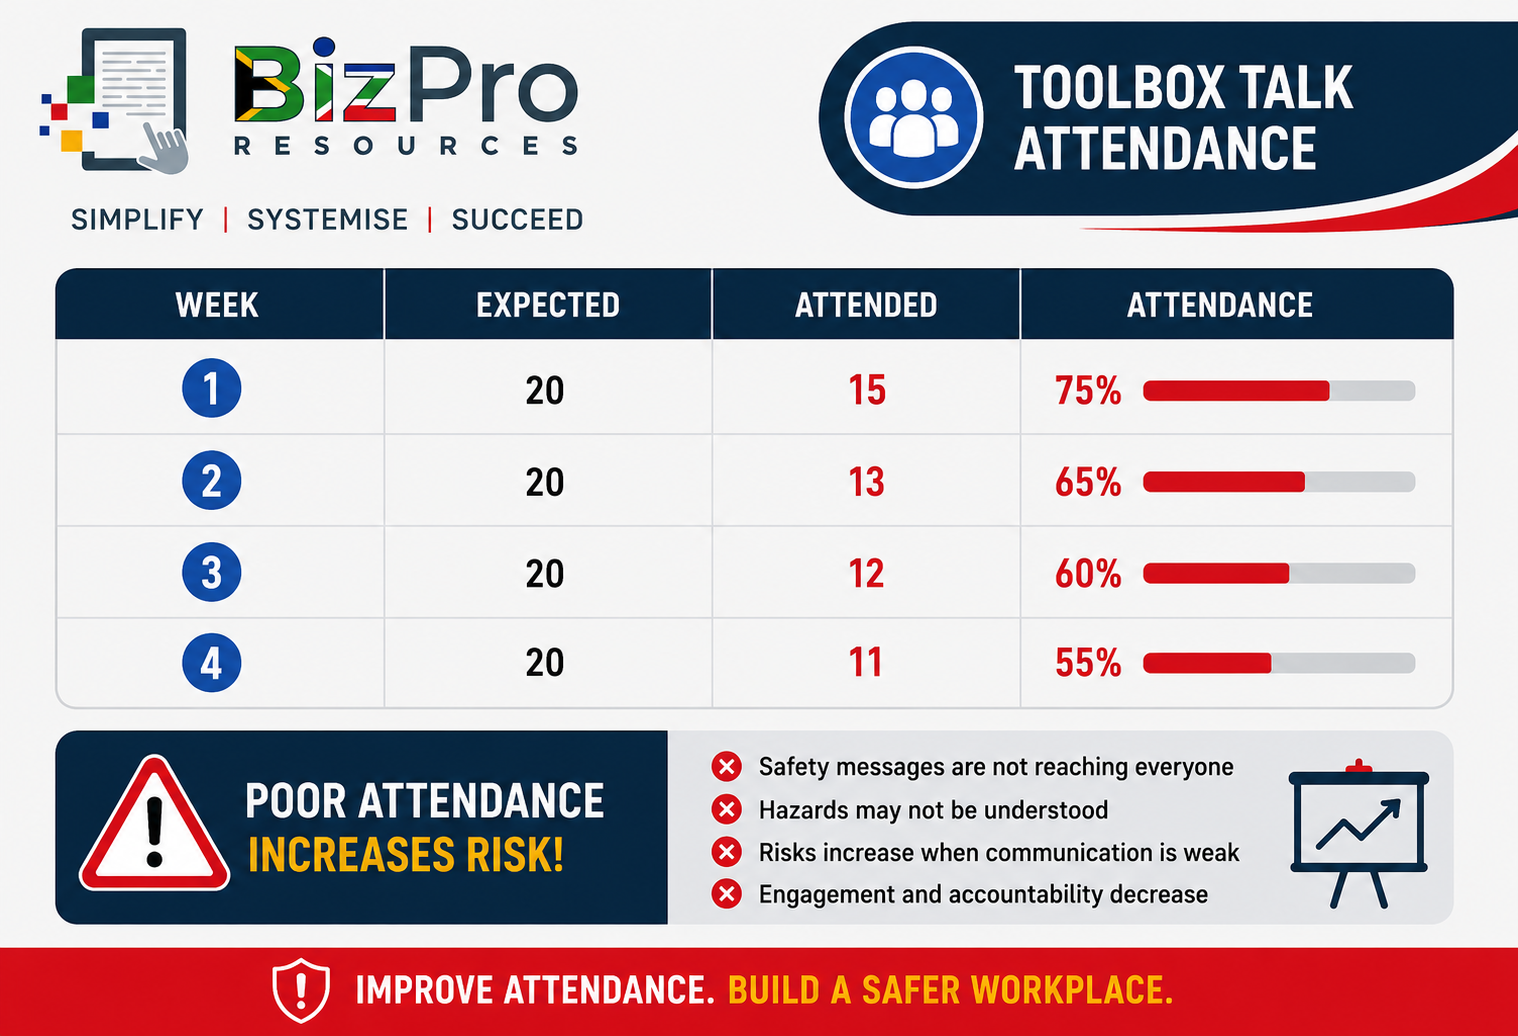
Attendance is steadily declining.
This should not simply be treated as an employee discipline problem. Management should investigate why.
Possible reasons include:
talks are scheduled at inconvenient times;
supervisors start work before the talk;
employees are already travelling to customers;
talks are repetitive and irrelevant;
attendance is not monitored;
managers do not attend or support the process; or
employees do not believe the talks provide value.
The declining attendance is an early warning signal.
It indicates that an important safety communication process is weakening.
Example of Good Toolbox Talk Attendance
Management changes the system.
Toolbox talks are shortened, focused on current workplace risks, scheduled before teams leave for jobs, and supervisors are held responsible for attendance.
During the next month:
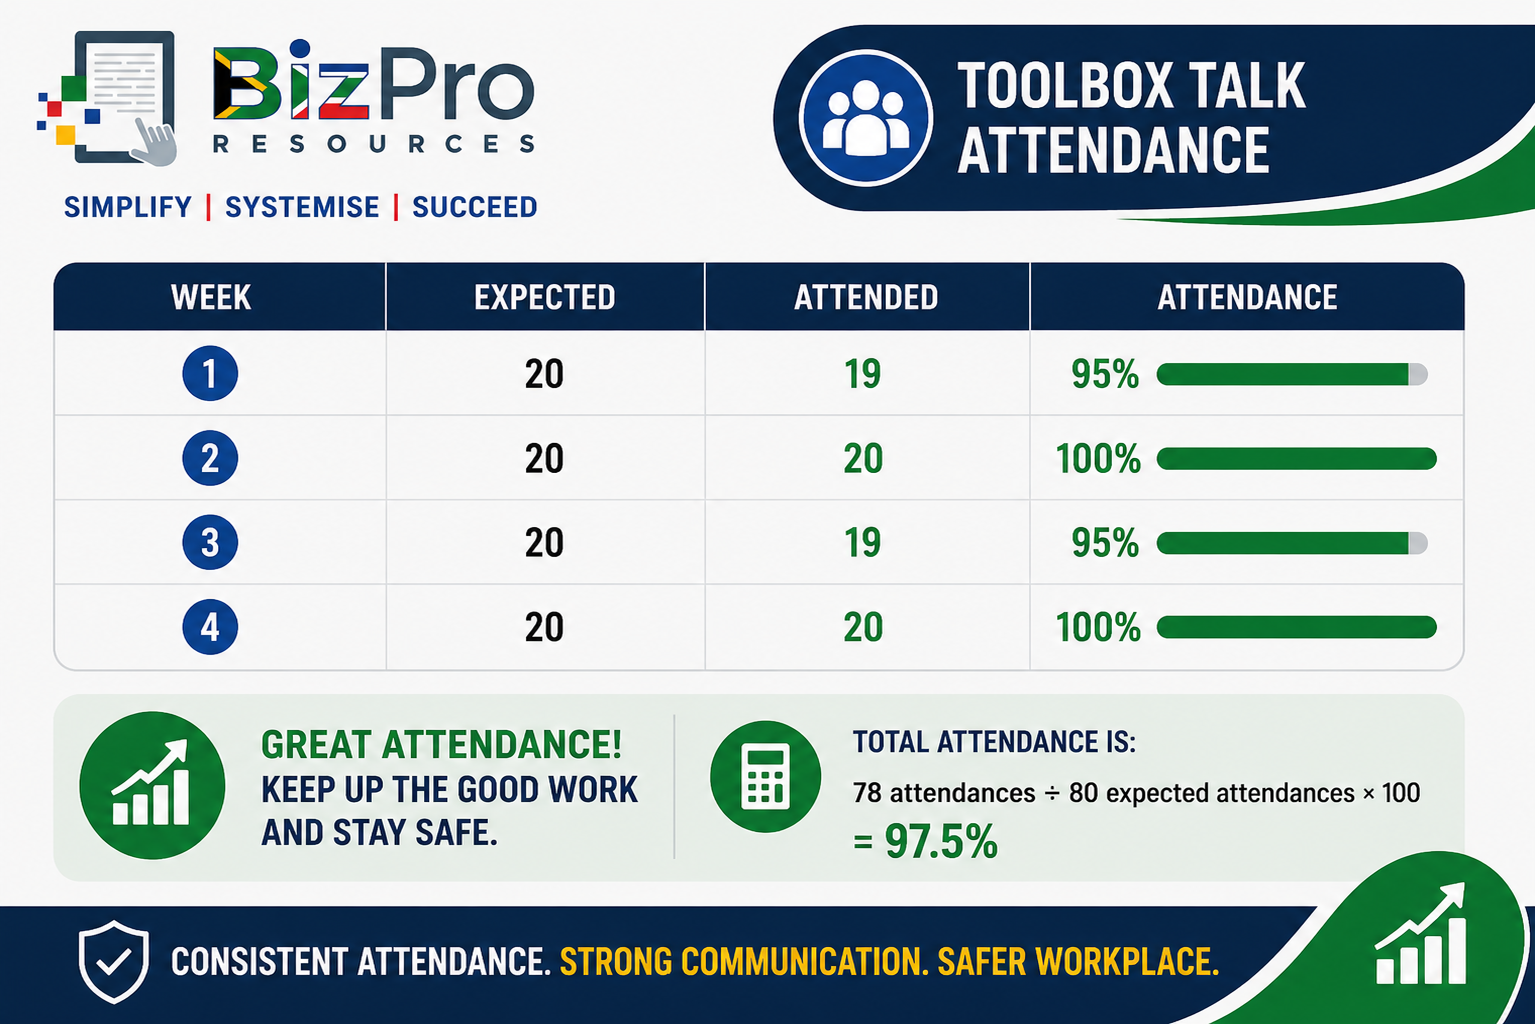
This is strong performance.
It indicates that employees are consistently participating in the company's regular safety communication process.
However, just like training, attendance alone does not prove effectiveness.
A company should also consider:
whether the topics are relevant;
whether employees participate;
whether questions are encouraged;
whether important risks are discussed;
whether employees understand the message; and
whether workplace behaviour reflects what was discussed.
How the Five Leading Indicators Work Together
The real value of these metrics appears when management stops looking at each number separately.
Consider this example:
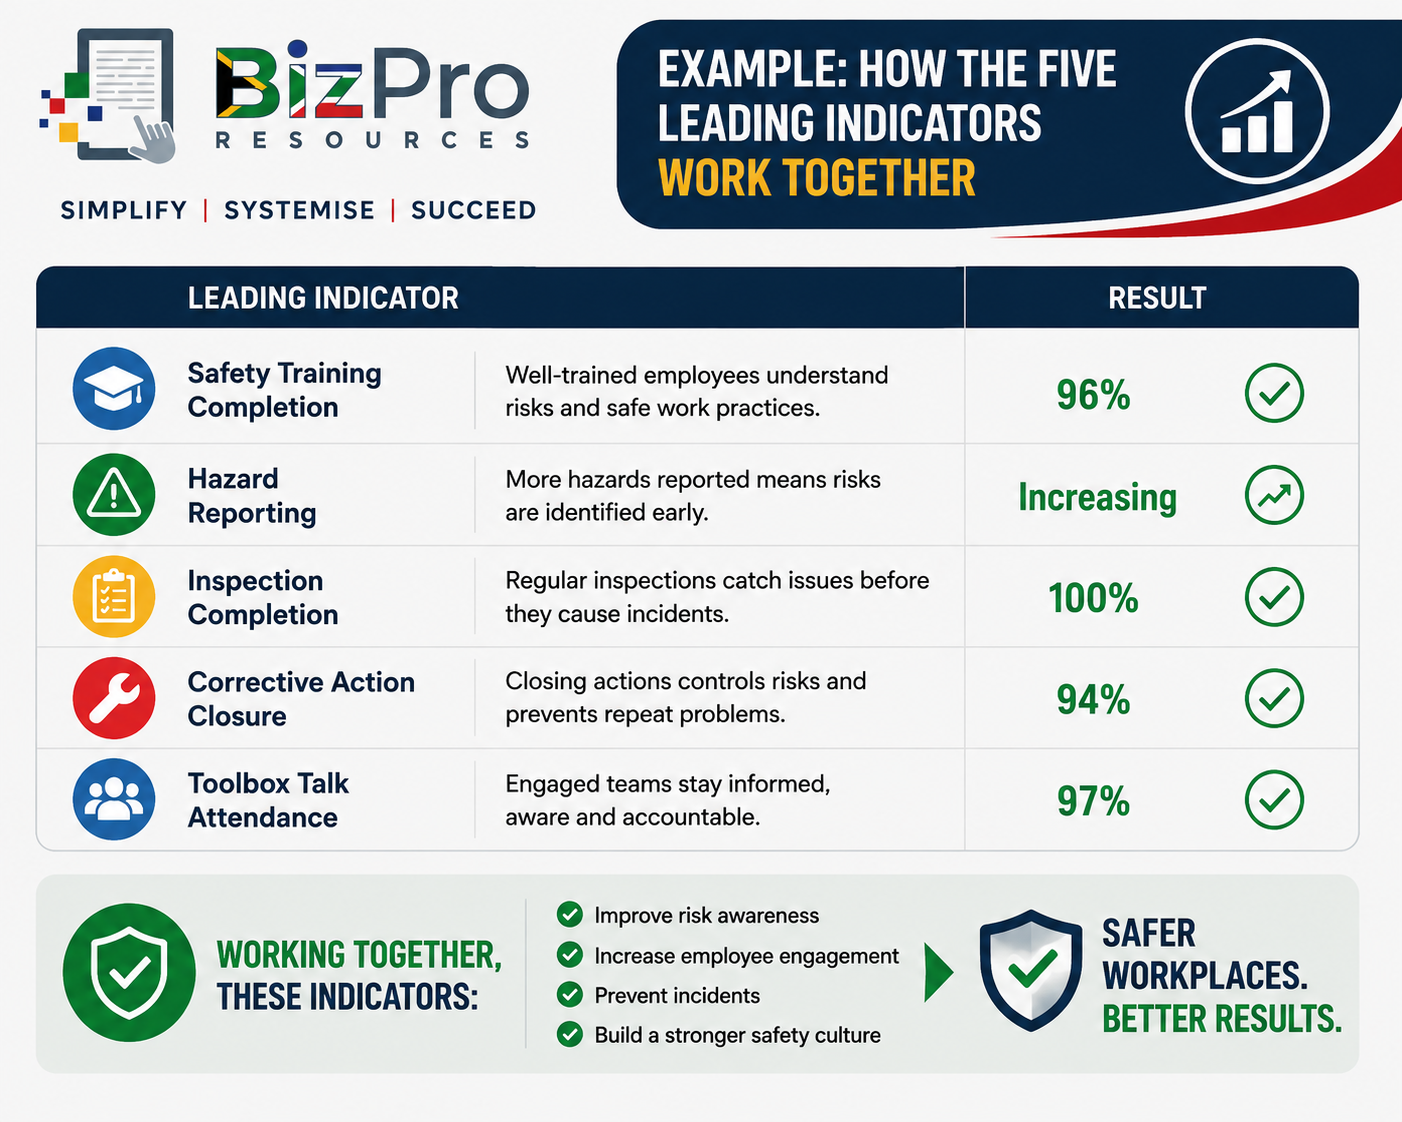
Taken together, these results suggest a reasonably active safety system:
Employees are receiving training.
Hazards are being reported.
Inspections are taking place.
Problems are being corrected.
Employees are participating in safety discussions.
Now consider another business:
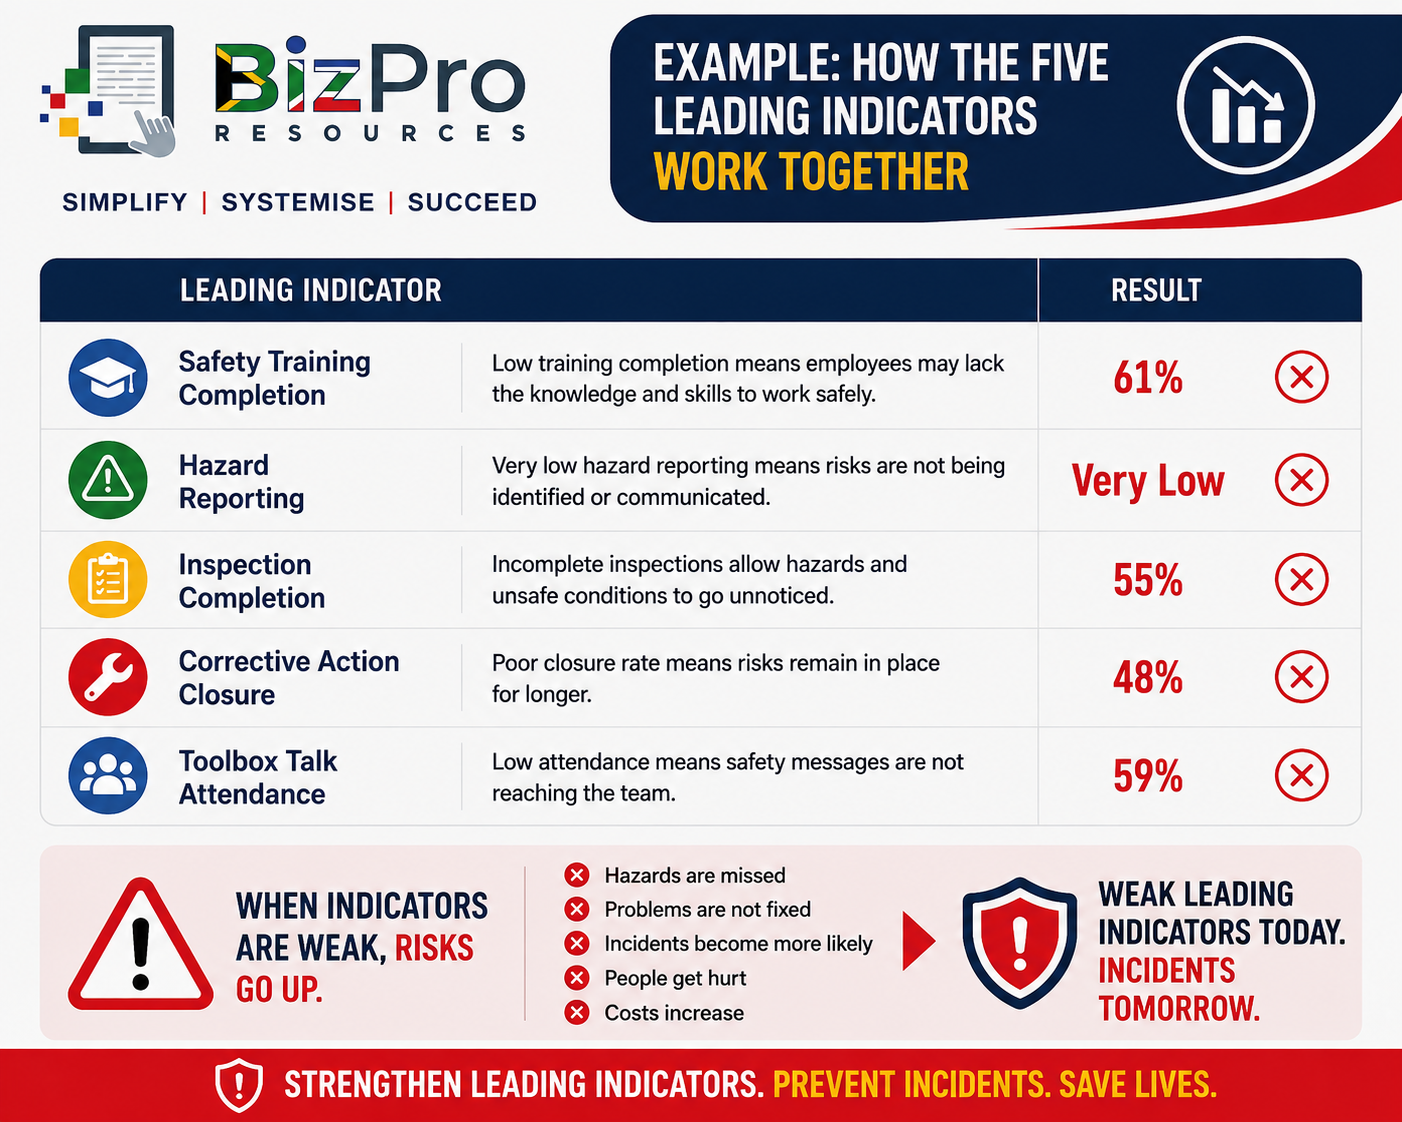
Suppose this business also reports: Zero lost-time injuries this month.
Should management celebrate? Certainly, it is positive that nobody has been seriously injured.
But the leading indicators provide several warning signs:
Training is incomplete.
Employees are hardly reporting hazards.
Almost half the planned inspections are being missed.
More than half the corrective actions are not being closed.
Toolbox talk participation is weak.
The business may have avoided serious incidents so far, but its preventive safety system appears weak. That is why leading indicators are so valuable.
They can help management identify deterioration before the consequences appear in the injury statistics.
Do Not Chase the Numbers
There is an important danger when introducing safety metrics. Employees and managers may begin focusing on achieving the number rather than improving safety.
For example: "We need fewer hazard reports."
Employees stop reporting hazards.
The metric improves, but the workplace becomes less safe.
Or: "We need 100% inspection completion."
Supervisors rush through inspections and tick every box without properly checking anything.
Again, the metric looks excellent while the underlying safety system becomes weaker.
Or: "We need 100% toolbox attendance."
Employees sign the attendance register but do not participate or pay attention.
The dashboard says 100%.
The actual value may be close to zero. Metrics should therefore be used as management tools, not targets to manipulate.
When a number changes, ask why.
Build a Simple Monthly OHS Leading Indicator Dashboard
A small business does not need complicated safety software to start measuring proactive safety performance.
A simple spreadsheet can be enough.
For example:
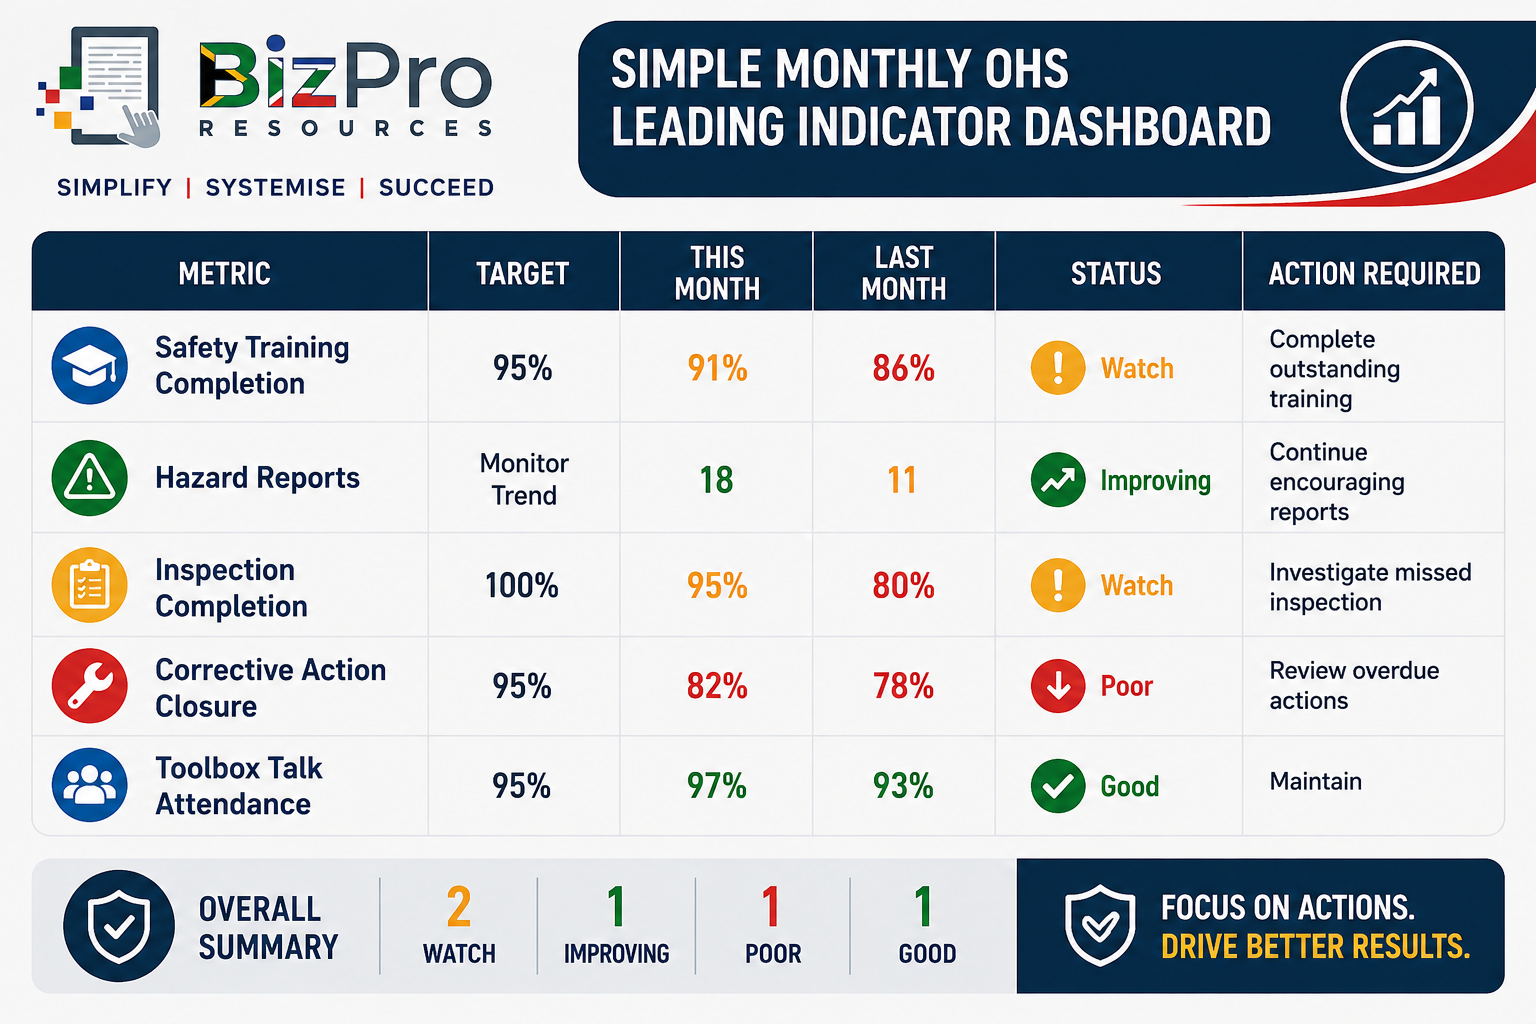
This dashboard immediately gives management a clearer picture than simply asking: "Did anyone get hurt this month?"
The management team can review the dashboard regularly and focus attention on areas that are deteriorating.
Look at Trends, Not Just One Month
One month's result can sometimes be misleading.
Imagine Safety Training Completion falls from 98% to 92%. That might appear negative.
However, the business may have hired 20 new employees during the month and their scheduled training is still being completed.
The explanation matters.
Similarly, hazard reports may increase from 10 to 30. That might appear alarming.
But perhaps management launched a new reporting campaign and employees are finally identifying hazards that previously went unreported.
Again, context matters.
A useful dashboard should therefore show trends.
For example:
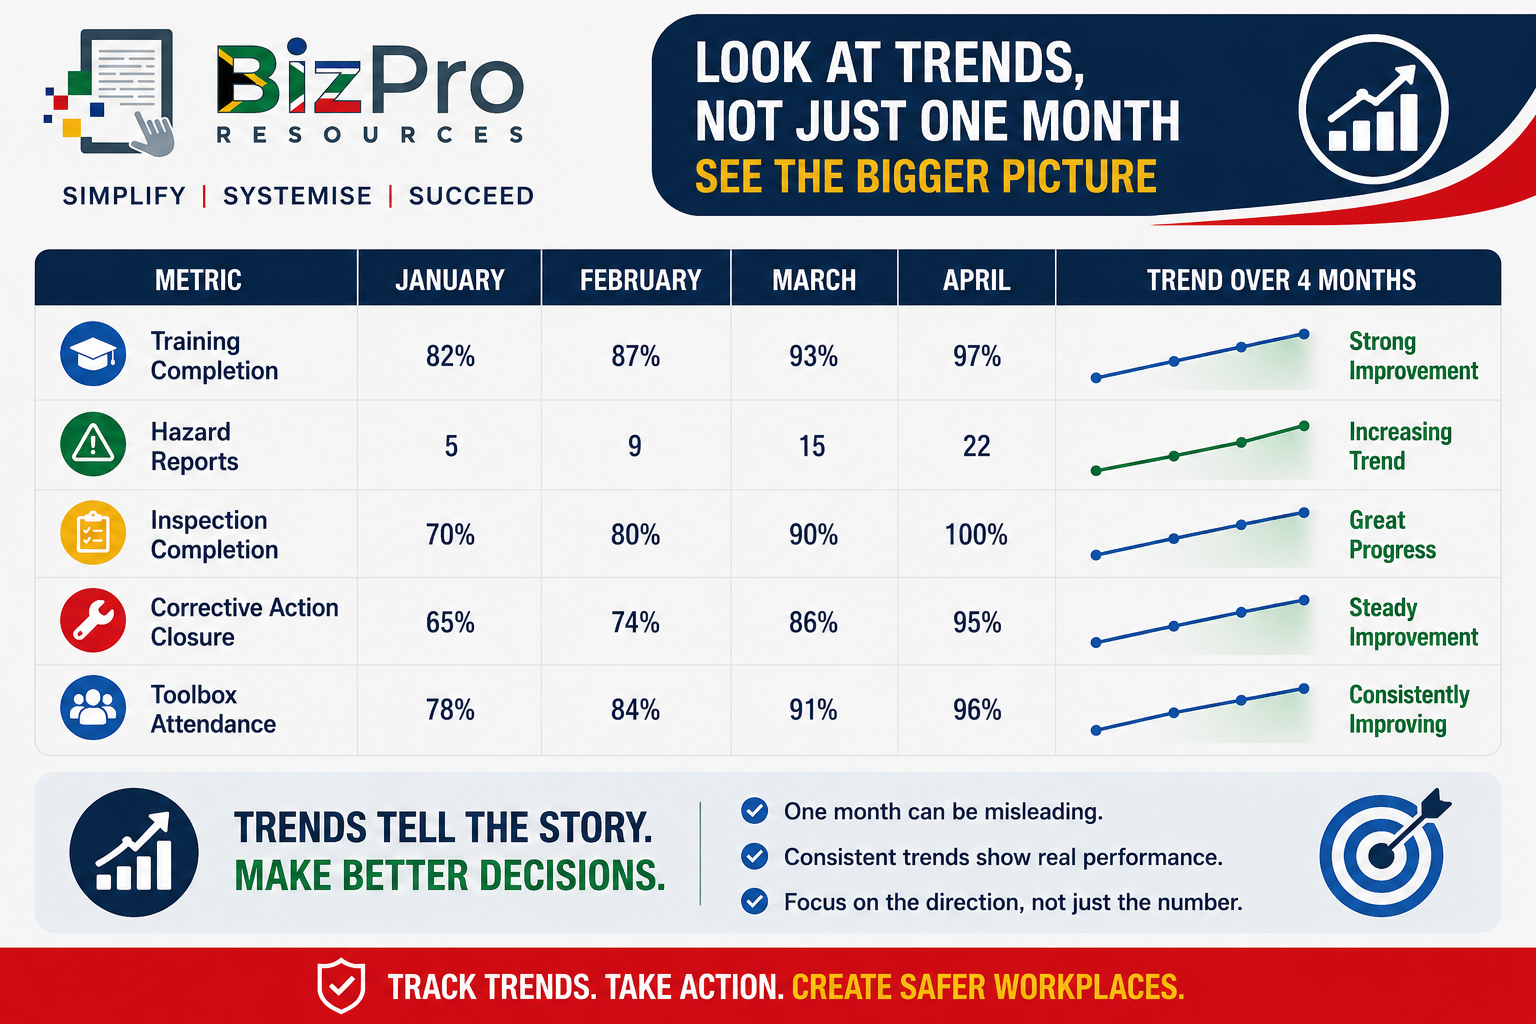
This tells a much more useful story.
The company's proactive safety activities appear to be strengthening over time.
Investigate the Story Behind the Metric
Every safety metric should lead to a management question:
If Safety Training Completion falls: Which training is outstanding, for whom, and why?
If Hazard Reporting falls: Are there genuinely fewer hazards, or have employees stopped reporting them?
If Inspection Frequency falls: Why are scheduled inspections being missed?
If Corrective Action Closure falls: What is preventing corrective actions from being completed?
If Toolbox Talk Attendance falls: Why are employees not participating?
The number is the starting point.
Management action is the objective.
What Does Good Proactive Safety Performance Look Like?
There is no single percentage that automatically proves that a workplace is safe.
Targets should reflect the company's activities, risks, workforce, legal obligations, internal procedures, and operating environment.
However, a healthy proactive safety system generally shows certain characteristics:
Required training is identified and completed.
Employees feel comfortable reporting hazards.
Inspections take place according to schedule.
Problems found during inspections and investigations are corrected promptly.
High-risk corrective actions receive priority.
Employees participate in regular safety discussions.
Supervisors take responsibility for safety activities.
Management reviews safety information regularly.
Most importantly, the company responds when the metrics show deterioration.
From Measurement to Prevention
The purpose of measuring OHS performance is not to create another spreadsheet that nobody uses. It is to prevent people from being harmed.
A practical management cycle is:
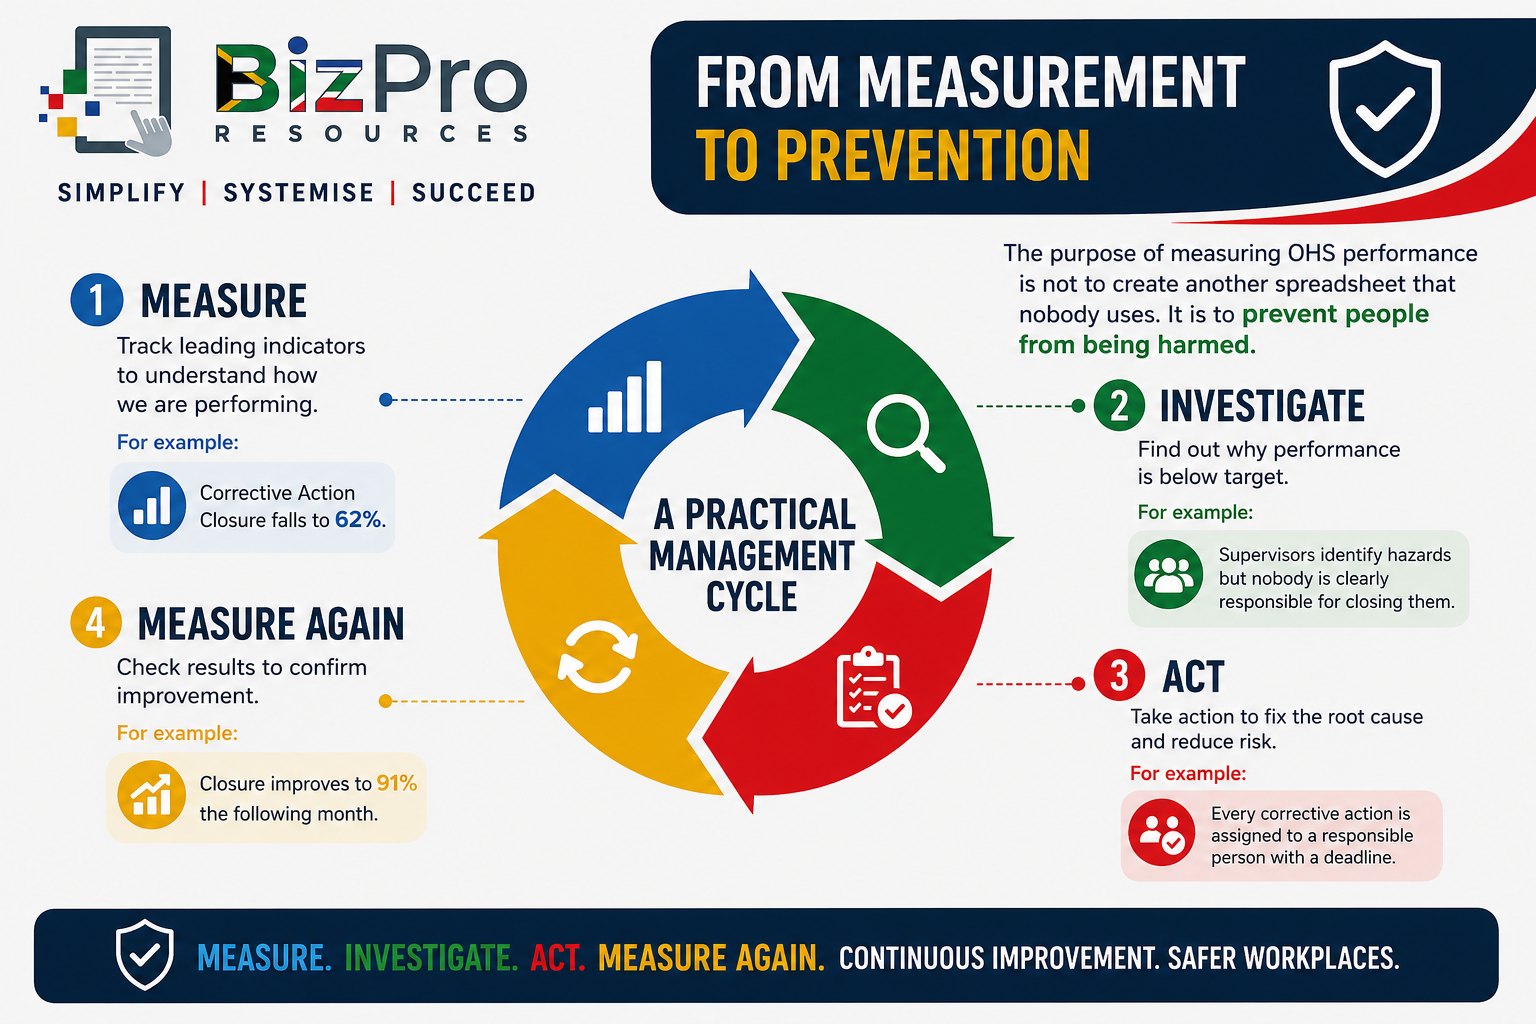
This is how a metric becomes a management tool.
Final Takeaway
Businesses should never wait for an injury to discover that their safety systems are weak. Leading OHS indicators provide an earlier view.
The five practical measures covered in this article are:
Safety Training Completion — Are employees completing the safety training they require?
Hazard Reporting Rate — Are employees actively identifying and reporting hazards?
Audit and Inspection Frequency — Are planned safety checks actually taking place?
Corrective Action Closure Rate — Are identified safety problems being corrected?
Toolbox Talk Attendance — Are employees participating in regular safety communication?
None of these metrics should be viewed in isolation:
A high training completion rate does not prove that employees work safely.
A high inspection completion rate does not prove that inspections are effective.
A low hazard reporting rate does not necessarily mean that there are few hazards.
And 100% toolbox talk attendance does not guarantee that employees understood the discussion.
The value comes from looking at the indicators together, monitoring their trends, investigating unusual results, and taking action.
For a small business, that creates an important shift in thinking.
Instead of only asking: "How many people were injured?" management starts asking: "Are we doing the things that can prevent the next injury?"
That is the real purpose of proactive OHS measurement.
Related Articles in the OHS Performance Metrics Series
Leading OHS Indicators: 5 Proactive Safety Metrics Every Small Business Should Track
Leading OHS Indicators: 5 Reactive Safety Metrics Every Small Business Should Track
AI Disclaimer
AI Tools were used to assist with research. Remember to always cross-check everything that you read.


