
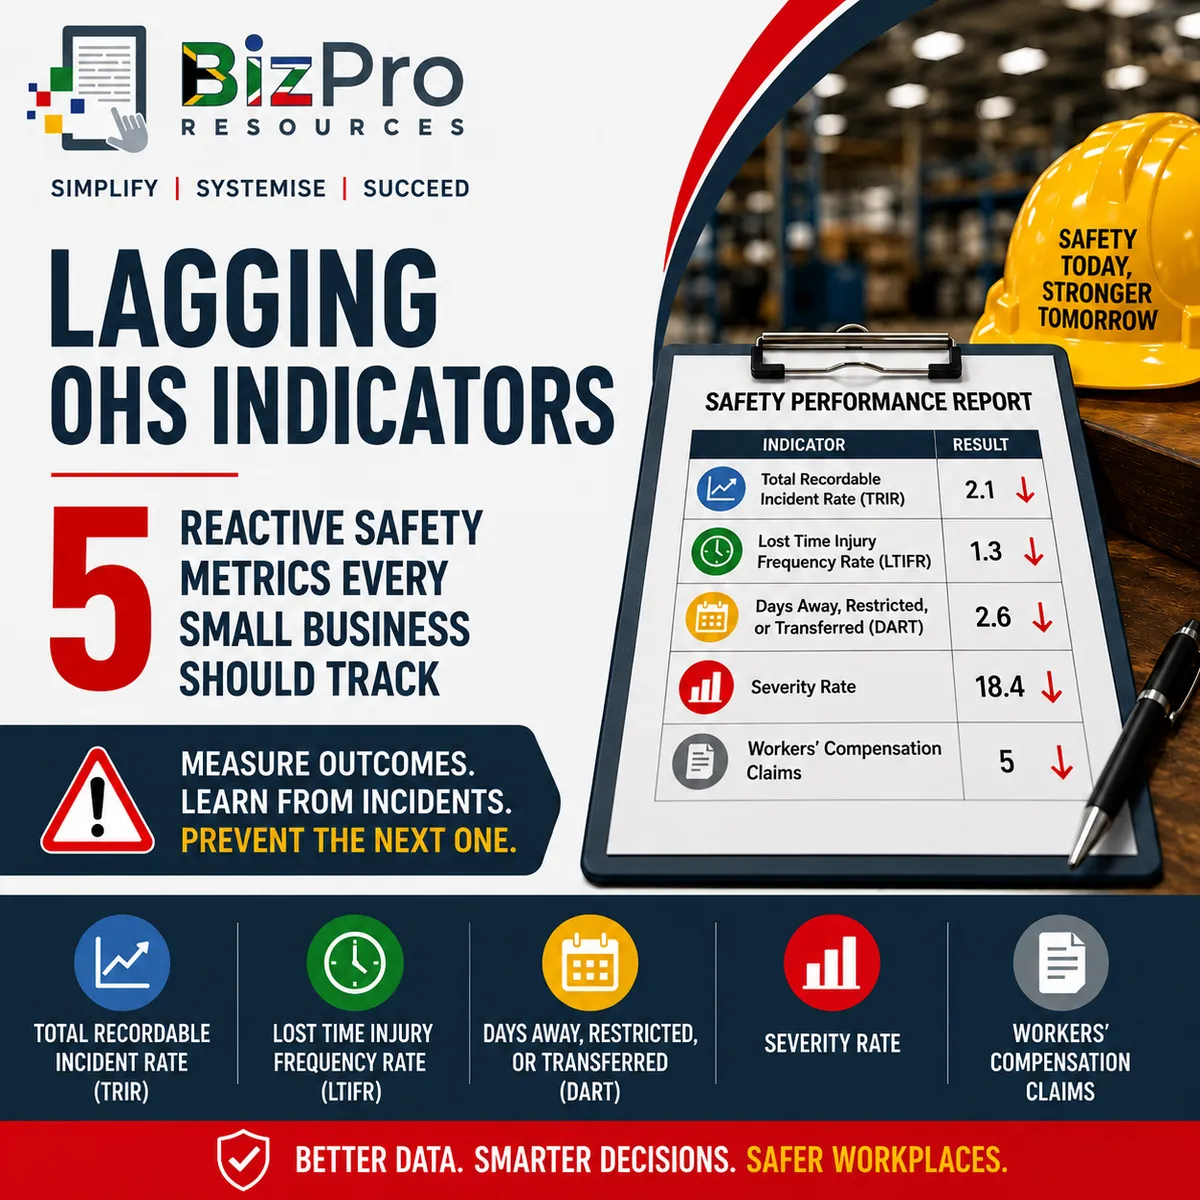
Lagging OHS Indicators: 5 Reactive Safety Metrics Every Small Business Should Track
Article #2 of #2 in the OHS Performance Metrics Series
Introduction
A business can have safety policies, training programmes, workplace inspections, toolbox talks, and risk assessments.
But management still needs to answer one very important question:
Are people actually getting hurt?
This is where lagging OHS indicators become important.
Lagging indicators measure occupational health and safety events that have already happened. They show the consequences of workplace incidents rather than the activities designed to prevent them.
Common examples include:
Total Recordable Incident Rate (TRIR)
Lost Time Injury Frequency Rate (LTIFR)
Days Away, Restricted, or Transferred (DART)
Severity Rate
Workers’ Compensation Claims
These measures can help management understand how frequently incidents occur, how serious they are, how much working time is being lost, and whether workplace injuries are creating compensation claims and financial costs.
For a South African small business, these numbers can provide valuable information about whether occupational health and safety risks are being controlled effectively.
However, lagging indicators have an important limitation.
They tell you what has already gone wrong.
They cannot prevent yesterday's accident.
Their value comes from using the information to identify patterns, investigate underlying causes, improve controls, and prevent similar incidents in future.
This article explains five useful lagging OHS indicators, how they can be calculated, what poor performance can mean, and what good performance can tell management about the business.
What Are Lagging Safety Indicators?
Lagging indicators are reactive measures of safety performance.
They measure outcomes such as:
injuries;
occupational illnesses;
lost working time;
restricted duties;
serious incidents; and
compensation claims.
They answer questions such as:
How many recordable incidents are occurring?
How frequently are employees suffering injuries that cause lost working time?
How many days are employees unable to perform their normal jobs?
How severe are our workplace injuries?
How many workers' compensation claims are being generated?
These indicators are called "lagging" because the event occurs first and the measurement follows.
For example: Incident → Injury → Lost Working Days → Metric
This is different from a leading indicator such as safety training completion.
Training completion measures something the company does before an incident, with the aim of preventing it.
Lost Time Injury Frequency Rate measures what happened after an incident caused an injury.
A strong OHS measurement system should therefore use both.
Leading indicators help management prevent.
Lagging indicators help management learn from outcomes.
1. Total Recordable Incident Rate (TRIR)
What Is Total Recordable Incident Rate?
Total Recordable Incident Rate, normally shortened to TRIR, is a measure of the frequency of recordable workplace incidents relative to the number of hours employees have worked.
It provides a standardised way of comparing safety performance.
Simply counting incidents can be misleading because businesses may have very different workforce sizes.
For example:
Company A has 10 recordable incidents and 2,000 employees.
Company B has 5 recordable incidents and 50 employees.
Company B has fewer incidents, but its incident frequency relative to the size of its workforce may be much worse.
TRIR helps solve this problem by relating incidents to hours worked.
The term "recordable incident" must be defined consistently according to the reporting framework being used by the organisation.
Depending on the framework, recordable cases may include workplace injuries or illnesses involving outcomes such as medical treatment beyond basic first aid, restricted work, days away from work, loss of consciousness, or other qualifying cases.
Businesses should therefore clearly define what they classify as recordable and apply that definition consistently.
How Is TRIR Calculated?
A commonly used formula is: TRIR = Number of Recordable Incidents × 200,000 ÷ Total Hours Worked
Why 200,000? The 200,000-hour base is commonly used internationally because it approximates the hours worked by 100 full-time employees working 40 hours per week for 50 weeks.
The purpose is to create a standardised rate.
For example, suppose a business has:
4 recordable incidents; and
250,000 total hours worked.
The calculation is: 4 × 200,000 ÷ 250,000 = 3.2
The company's TRIR is therefore: 3.2
The important point is that this is a rate, not simply the number of incidents.
Example of Poor TRIR Performance
Imagine a manufacturing company records:
8 recordable incidents; and
320,000 hours worked.
Its TRIR is: 8 × 200,000 ÷ 320,000 = 5.0
A TRIR of 5.0 means the company has experienced a relatively significant frequency of recordable incidents based on the standardised calculation.
Management should investigate.
The incidents may involve different problems, or they may reveal a pattern.
For example:
several hand injuries involving machinery;
repeated slips and falls;
lifting injuries;
chemical exposure;
injuries caused by damaged tools; or
vehicle-related incidents.
The number itself does not tell management why the incidents occurred.
It tells management: "We need to investigate what is driving this rate."
If TRIR is also increasing over time, the warning becomes stronger.
For example:
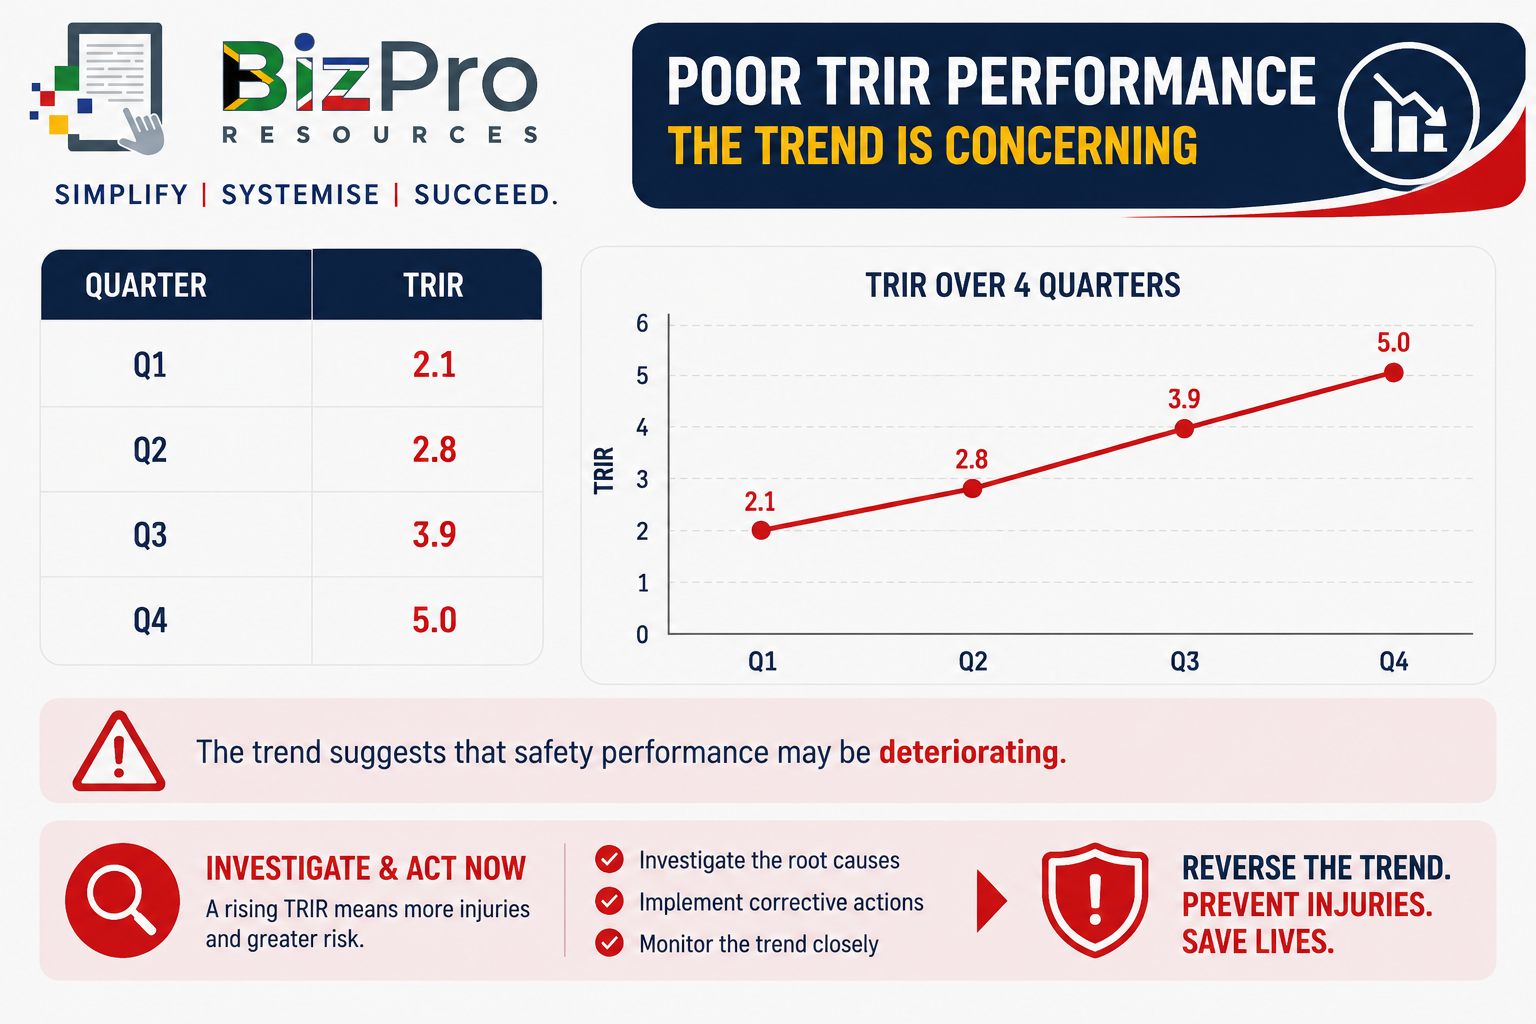
The trend suggests that safety performance may be deteriorating.
Example of Good TRIR Performance
Suppose management investigates the incidents and strengthens controls.
The following year the business records:
2 recordable incidents; and
340,000 hours worked.
The calculation becomes: 2 × 200,000 ÷ 340,000 = 1.18
Rounded: TRIR = 1.2
The reduction from 5.0 to approximately 1.2 is significant.
It suggests that the frequency of recordable incidents has fallen substantially relative to hours worked.
Management should determine which improvements contributed to the change and make sure they are maintained.
However, a low TRIR should never create complacency.
A company could have a low overall incident rate and still experience one extremely serious event.
That is why frequency should always be considered together with severity.
2. Lost Time Injury Frequency Rate (LTIFR)
What Is Lost Time Injury Frequency Rate?
Lost Time Injury Frequency Rate, or LTIFR, measures how frequently workplace injuries result in employees losing working time.
A lost time injury is generally an occupational injury that prevents an employee from returning to normal work for a defined period after the incident, according to the reporting rules the organisation uses.
LTIFR is particularly useful because it focuses on injuries serious enough to affect an employee's ability to work.
For a business, lost time injuries can have consequences beyond the injury itself.
They may result in:
absent employees;
overtime for other employees;
temporary replacement workers;
delayed work;
lower productivity;
investigation time;
administrative work;
compensation costs; and
disruption to customers.
How Is LTIFR Calculated?
A commonly used formula is: LTIFR = Number of Lost Time Injuries × Standard Hours ÷ Total Hours Worked
The standardising factor varies between reporting systems and organisations.
Common bases include 200,000 hours or 1,000,000 hours.
This is extremely important when comparing LTIFR figures.
An LTIFR calculated using 200,000 hours cannot be directly compared with one calculated using 1,000,000 hours unless they are converted to the same basis.
For this example, we will use: LTIFR = Lost Time Injuries × 1,000,000 ÷ Total Hours Worked
Suppose a company experiences:
3 lost time injuries; and
500,000 hours worked.
The calculation is: 3 × 1,000,000 ÷ 500,000 = 6
The company's LTIFR is: 6.0 per million hours worked
Example of Poor LTIFR Performance
A construction company records:
6 lost time injuries; and
600,000 hours worked.
Its LTIFR is: 6 × 1,000,000 ÷ 600,000 = 10
The LTIFR is therefore: 10.0 per million hours worked
This should attract management attention.
Six incidents were serious enough to result in lost working time.
Management should investigate:
what happened;
where the incidents occurred;
which jobs were involved;
whether the same hazards appear repeatedly;
whether procedures were followed;
whether risk assessments were adequate;
whether supervision was sufficient; and
whether corrective actions were implemented.
If several injuries resulted from similar activities, management may be looking at a systemic problem rather than unrelated accidents.
Example of Good LTIFR Performance
After improving controls, the company records the following during the next comparable period:
1 lost time injury; and
650,000 hours worked.
The calculation is: 1 × 1,000,000 ÷ 650,000 = 1.54
Rounded: LTIFR = 1.5 per million hours worked
This is a substantial improvement from 10.0.
It suggests that injuries resulting in lost working time are occurring much less frequently.
Management should still investigate the one lost time injury.
A good rate does not mean an individual incident can be ignored.
Every serious injury provides an opportunity to understand whether additional controls are required.
3. Days Away, Restricted, or Transferred (DART)
What Is DART?
DART stands for: Days Away, Restricted, or Transferred.
It measures cases serious enough to result in an employee:
being away from work;
having restricted work duties; or
being transferred to another job because of a workplace injury or illness.
DART can therefore provide a broader picture than simply measuring lost-time injuries.
Consider an employee who injures a shoulder.
The employee returns to work but cannot lift heavy objects for three weeks.
The company assigns the employee administrative duties.
The employee has not necessarily been completely absent from work.
But the injury is still affecting the employee's ability to perform normal duties.
DART is designed to capture this type of impact.
How Is DART Calculated?
A commonly used DART rate formula is: DART Rate = Number of DART Cases × 200,000 ÷ Total Hours Worked
Suppose a business has:
5 cases involving days away, restricted duties, or transfers; and
400,000 hours worked.
The calculation is: 5 × 200,000 ÷ 400,000 = 2.5
The company's DART Rate is: 2.5
Businesses may also separately track the actual number of:
days away;
restricted-duty days; and
transferred-work days.
This can provide useful additional detail.
Example of Poor DART Performance
A warehousing business records:
9 DART cases; and
450,000 hours worked.
The calculation is: 9 × 200,000 ÷ 450,000 = 4.0
Its DART Rate is: 4.0
Management investigates and discovers that many cases involve:
back injuries;
manual handling;
lifting;
repetitive movement; and
employees being placed on restricted duties.
This tells management something important.
The company may not simply have an "injury problem".
It may have a specific manual-handling and ergonomic risk problem.
Management can now focus on issues such as:
lifting techniques;
mechanical lifting equipment;
storage heights;
load weights;
workstation design;
staffing;
job rotation; and
employee training.
Example of Good DART Performance
After making improvements, the company records:
2 DART cases; and
470,000 hours worked.
The calculation becomes: 2 × 200,000 ÷ 470,000 = 0.85
Rounded: DART Rate = 0.9
The reduction from 4.0 to approximately 0.9 suggests a major improvement.
If the reduction is supported by other safety indicators, management may have good evidence that the controls are working.
But the business should also watch for a dangerous behaviour:
Employees should never be pressured to return to work or remain at work simply to improve the DART number.
Safety metrics should reflect reality.
They should never influence decisions that should instead be based on appropriate medical advice, employee wellbeing, and safe work requirements.
4. Severity Rate
What Is Severity Rate?
Frequency tells management how often incidents happen.
Severity tells management how serious their consequences are.
This distinction is extremely important.
Consider two companies:
Company A: 10 injuries occur, but most are relatively minor.
Company B: Only 2 injuries occur, but both are serious and result in long periods away from work.
Company B has a lower incident frequency.
But the consequences of its incidents may be much more severe.
Severity Rate helps management understand this difference.
It normally relates the number of lost workdays to the total number of hours worked.
How Is Severity Rate Calculated?
A common formula is: Severity Rate = Number of Lost Workdays × 200,000 ÷ Total Hours Worked
As with other safety rates, organisations may use different standardising factors.
The important requirement is to clearly state the basis and use it consistently.
Suppose a company experiences:
35 lost workdays; and
350,000 hours worked.
The calculation is: 35 × 200,000 ÷ 350,000 = 20
The Severity Rate is: 20
Example of Poor Severity Rate Performance
An engineering company records only three lost-time injuries during the year.
At first, management believes this is reasonably positive.
However, those injuries result in:
Injury 1: 35 lost workdays;
Injury 2: 48 lost workdays;
Injury 3: 27 lost workdays.
Total lost days: 35 + 48 + 27 = 110 days
The company worked 400,000 hours.
Its Severity Rate is: 110 × 200,000 ÷ 400,000 = 55
The Severity Rate is therefore: 55
This provides management with information that the incident count alone did not show.
There were only three lost-time injuries, but their consequences were serious.
The company should investigate whether the incidents involved high-risk activities such as:
machinery;
vehicles;
working at height;
electrical work;
heavy equipment;
hazardous substances; or
high-energy processes.
A low frequency combined with high severity may indicate that the company needs to focus particularly on high-consequence risks.
Example of Good Severity Rate Performance
Suppose the following year the company experiences:
18 lost workdays; and
420,000 hours worked.
The calculation becomes: 18 × 200,000 ÷ 420,000 = 8.57
Rounded: Severity Rate = 8.6
The decline from 55 to approximately 8.6 represents a substantial reduction in the impact of workplace injuries.
This could indicate that:
serious incidents have decreased;
high-risk hazards are better controlled;
injuries are less severe; or
preventive measures are becoming more effective.
Management should examine the underlying incident data to understand the reason for the improvement.
5. Workers’ Compensation Claims
What Are Workers’ Compensation Claims?
Work-related injuries and occupational diseases can result in compensation claims.
In South Africa, workplace injury and occupational disease compensation must be considered within the applicable legal and compensation framework, including the Compensation for Occupational Injuries and Diseases Act (COIDA) and the relevant compensation arrangements.
From a management perspective, workers' compensation claims can also serve as a lagging OHS indicator.
They show where workplace injuries or occupational diseases are creating consequences serious enough to enter the compensation system.
Businesses can monitor:
number of claims;
type of claim;
cause of injury;
department or site;
occupation;
days lost;
claim value where appropriate;
recurring injury categories; and
claim trends over time.
The objective is not to discourage legitimate claims.
The objective is to learn from the information.
How Are Workers’ Compensation Claims Calculated?
There is no single universal workers' compensation metric.
A small business can begin by tracking:
Number of Workers’ Compensation Claims per Month or Year
For better comparison over time, the business can calculate a claim rate.
For example:
Claims per 100 Employees = Number of Claims ÷ Average Number of Employees × 100
Suppose a company has:
8 workers' compensation claims; and
an average workforce of 200 employees.
The calculation is: 8 ÷ 200 × 100 = 4
The business has: 4 claims per 100 employees
Management can also track total claim costs or average claim cost where reliable information is available.
For example: Average Claim Cost = Total Claim Cost ÷ Number of Claims
Different measures answer different questions.
Example of Poor Workers’ Compensation Claims Performance
A manufacturing company employs 150 people.
During the year it records 15 compensation claims.
The calculation is: 15 ÷ 150 × 100 = 10
The company has: 10 claims per 100 employees
Management then analyses the claims.
It discovers:
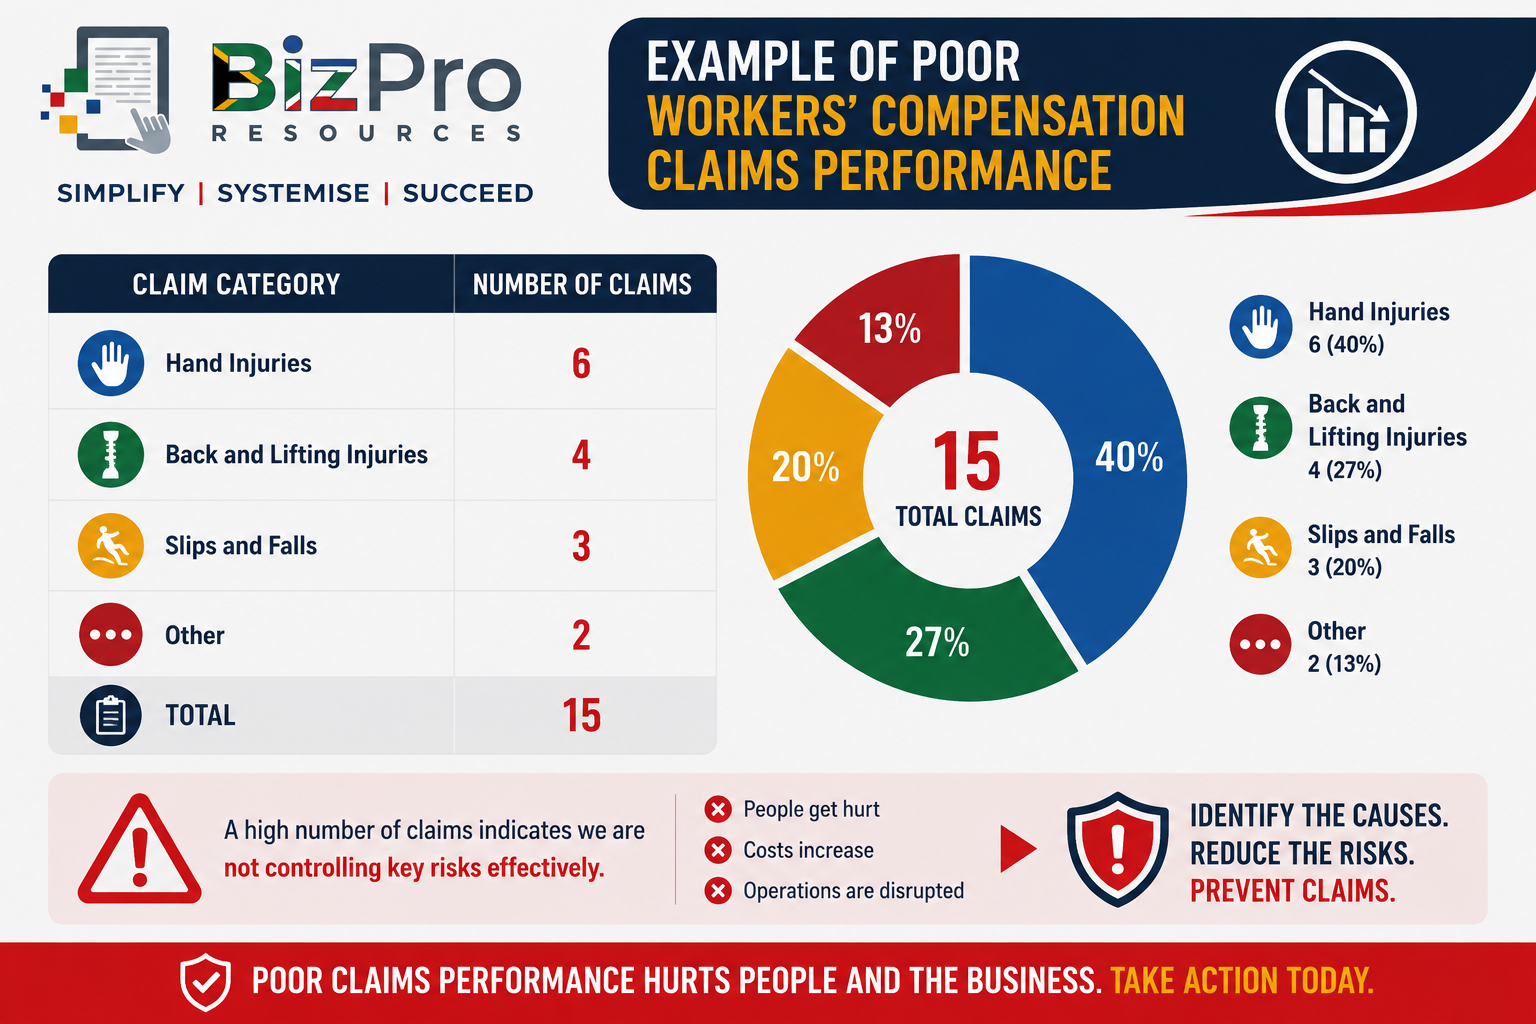
This is much more useful than simply knowing that there were 15 claims.
The data reveals that hand injuries represent the largest category.
Management can investigate:
machinery;
guarding;
hand tools;
PPE;
employee training;
maintenance;
work procedures; and
supervision.
The claims data has now become a tool for prevention.
Example of Good Workers’ Compensation Claims Performance
The company implements improvements.
The following year:
the average workforce increases to 160 employees;
compensation claims fall to 5.
The calculation is: 5 ÷ 160 × 100 = 3.125
Rounded: 3.1 claims per 100 employees
This is a significant reduction from 10 claims per 100 employees.
Even more importantly, hand injuries fall from six cases to one.
This provides stronger evidence that the company's targeted interventions may be working.
Management should continue monitoring the trend rather than assuming the problem has permanently disappeared.
How the Five Lagging Indicators Work Together
Each lagging indicator tells management something slightly different.
Consider this simplified example:
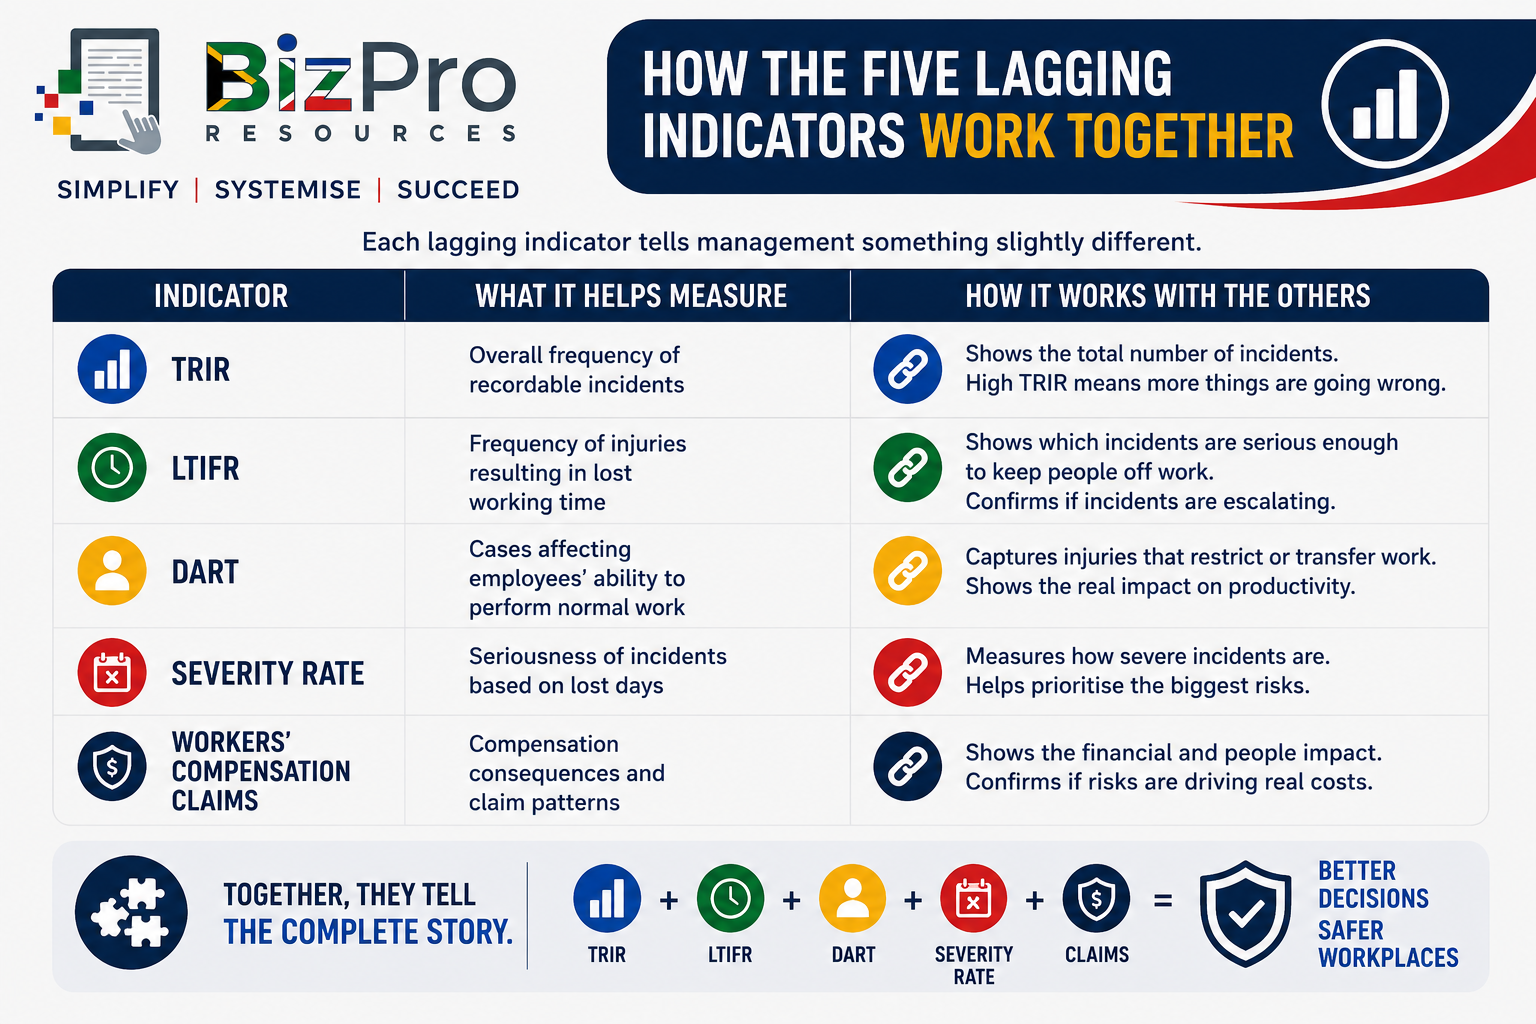
This is why one number should never become the company's entire definition of safety performance.
Imagine two businesses.
Business A
relatively high TRIR;
low LTIFR;
low Severity Rate.
The company may be experiencing several recordable incidents, but relatively few are resulting in serious lost-time consequences.
Business B
low TRIR;
low number of incidents;
high Severity Rate.
Business B may experience fewer incidents, but the incidents that do occur are extremely serious.
If management looked only at incident frequency, Business B might appear safer.
Looking at severity tells a different story.
Be Careful When Comparing Safety Rates
Safety rates can be useful for benchmarking, but comparisons must be made carefully.
Different businesses may have different:
workforce sizes;
working hours;
industries;
risk levels;
definitions;
reporting practices;
contractor arrangements;
incident classifications; and
calculation methods.
A plumbing contractor should not automatically expect the same safety profile as an accounting practice.
A security company with employees driving and working at customer sites has different risks from an office-based consulting company.
Even businesses in the same industry may calculate certain indicators differently.
For example, one organisation may calculate LTIFR using: 1,000,000 hours while another uses: 200,000 hours.
The two numbers cannot be directly compared without adjustment.
Whenever management reviews a safety rate, it should therefore ask:
What exactly is included in this metric?
What calculation basis is being used?
Are we comparing like with like?
Do Not Hide Incidents to Improve the Numbers
Lagging safety indicators create another potential danger.
Managers may become so focused on achieving low incident rates that employees feel pressure not to report injuries.
This destroys the value of the measurement system.
For example, if a manager's performance bonus depends heavily on achieving a low incident rate, the manager could unintentionally create pressure on employees not to report minor injuries.
The dashboard may improve.
The workplace has not.
A healthy safety culture should encourage:
honest reporting;
proper medical treatment;
accurate incident classification;
thorough investigation; and
learning from incidents.
The objective is not to make the statistics look safe.
The objective is to make the workplace safer.
Build a Simple Monthly Lagging Indicator Dashboard
A small business can track these measures in a basic spreadsheet.
For example:
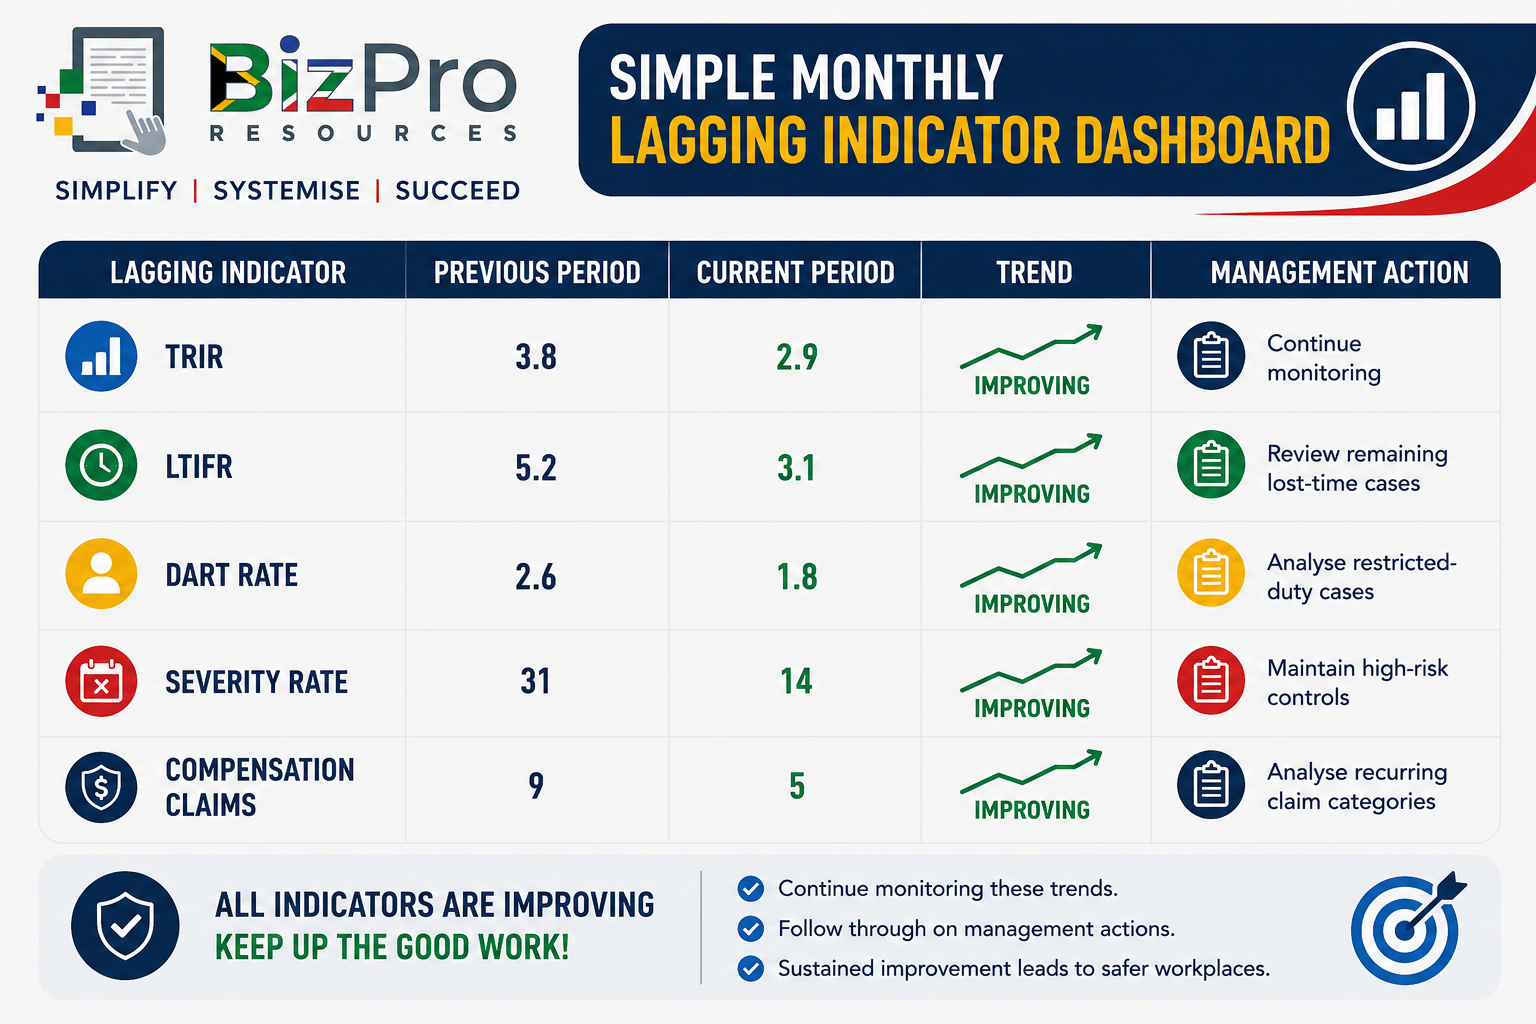
This gives management a quick overview.
But the dashboard should never replace the underlying investigation.
If TRIR suddenly increases, management needs to know why.
If Severity Rate jumps sharply, management needs to identify which incidents caused it.
If compensation claims repeatedly involve the same type of injury, management needs to investigate the hazard.
Look at Trends, Not Isolated Numbers
One month's results rarely tell the full story.
Consider this example:
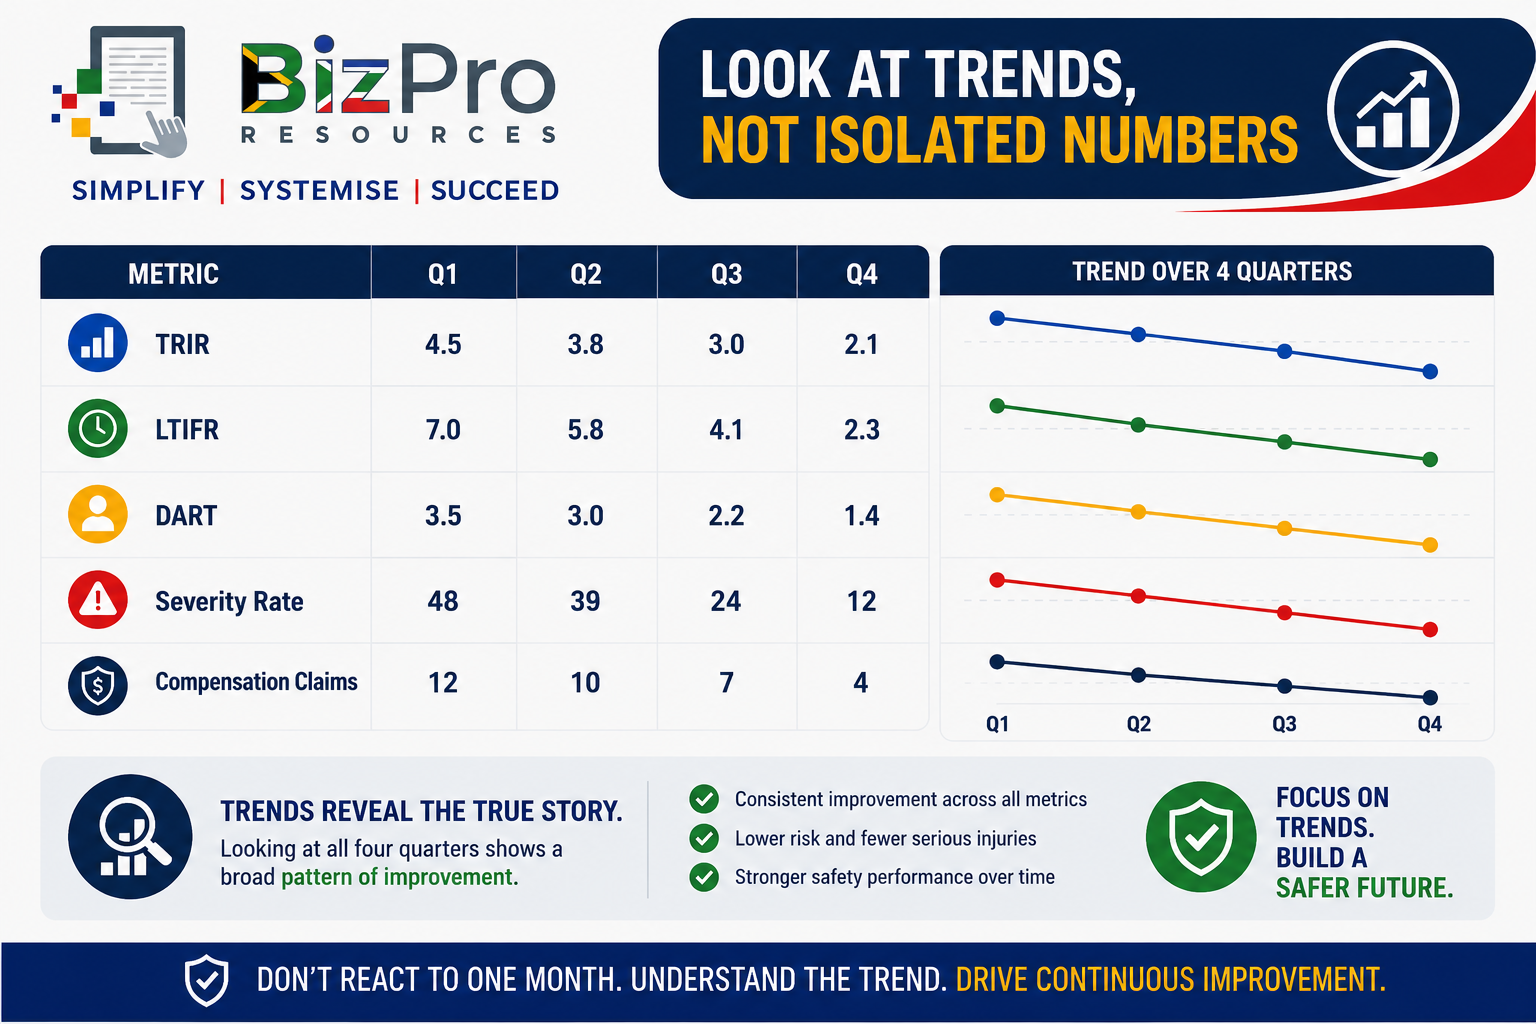
This shows a broad pattern of improvement.
Recordable incidents are declining.
Lost-time injuries are becoming less frequent.
DART cases are declining.
Lost working days are reducing.
Compensation claims are falling.
When several different indicators move in the same direction, management has stronger evidence that overall safety performance may genuinely be improving.
Combine Lagging and Leading Indicators
Lagging indicators become much more powerful when they are reviewed together with the proactive leading indicators discussed in the previous article.
For example:
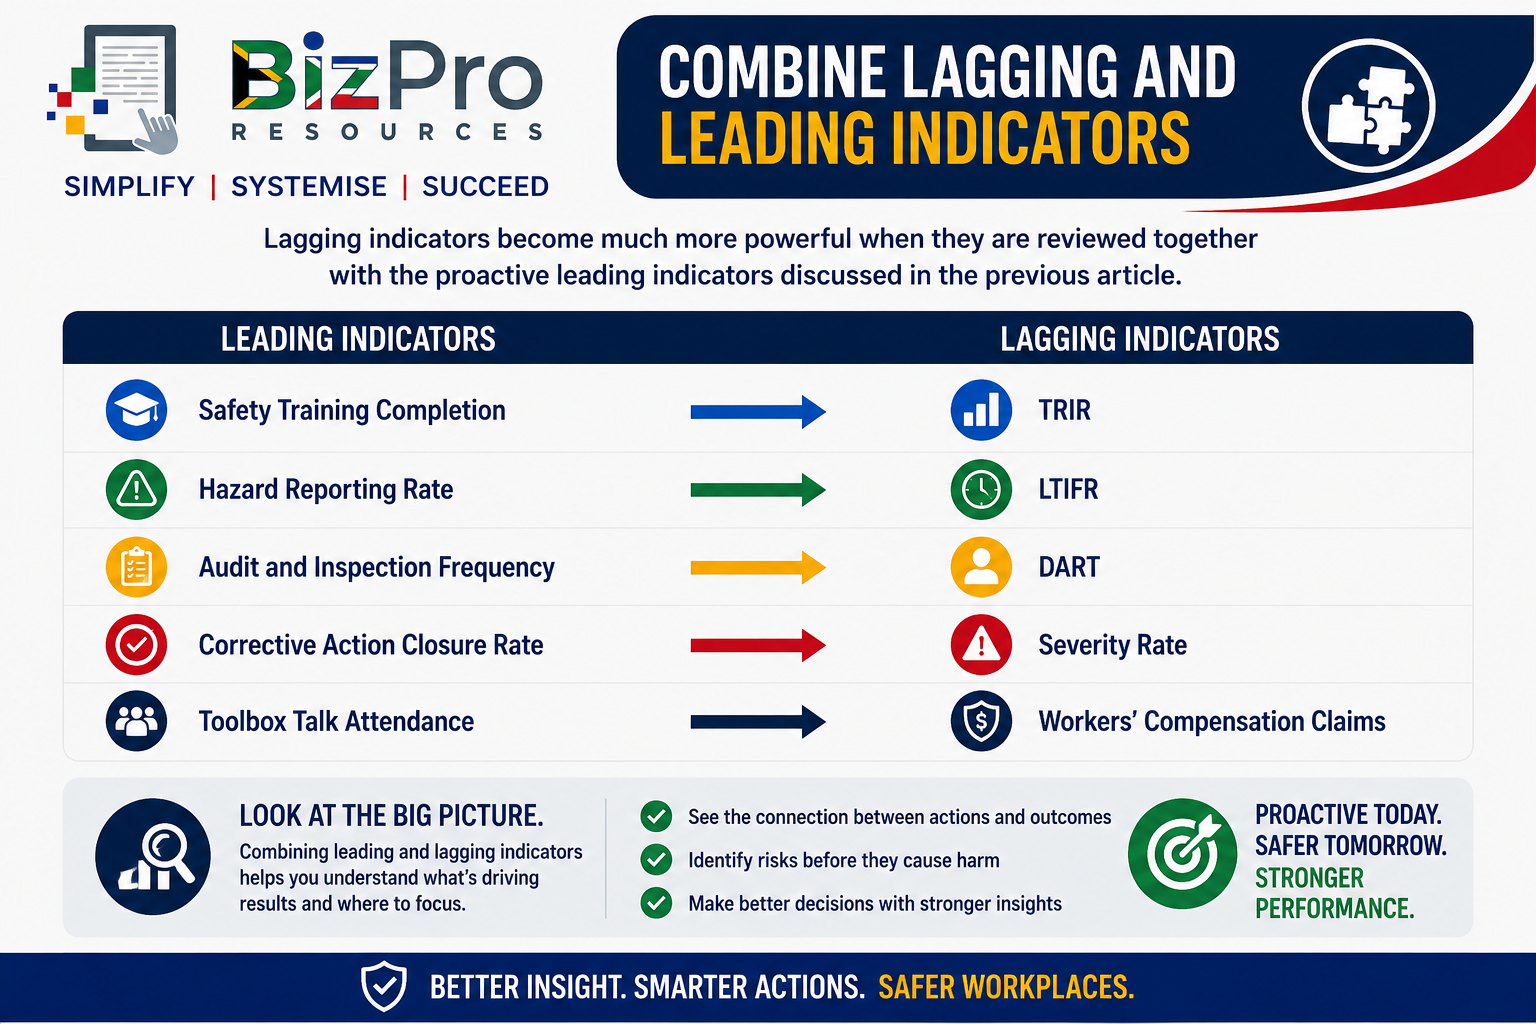
This allows management to investigate relationships.
Suppose: Safety Training Completion falls.
Several months later: TRIR begins increasing.
Or: Corrective Action Closure improves.
Over time: LTIFR and Severity Rate decline.
This does not automatically prove cause and effect, but it gives management valuable questions to investigate.
The strongest safety dashboards therefore look at both sides:
What are we doing to prevent incidents?
and
What safety outcomes are we actually experiencing?
Investigate the Story Behind the Metric
Every lagging indicator should lead to questions.
If TRIR increases: What types of recordable incidents are increasing, and where are they happening?
If LTIFR increases: Why are more injuries resulting in employees losing working time?
If DART increases: Which injuries or illnesses are causing absence, restricted duties, or transfers?
If Severity Rate increases: Which incidents are causing large numbers of lost days?
If Workers' Compensation Claims increase: What types of injuries are generating the claims, and are there recurring causes?
The metric tells management where to look.
Investigation helps management understand what to do.
From Incident Data to Prevention
The fact that lagging indicators measure past events does not make them purely historical.
Used properly, they become inputs into future prevention.
A practical management cycle is:
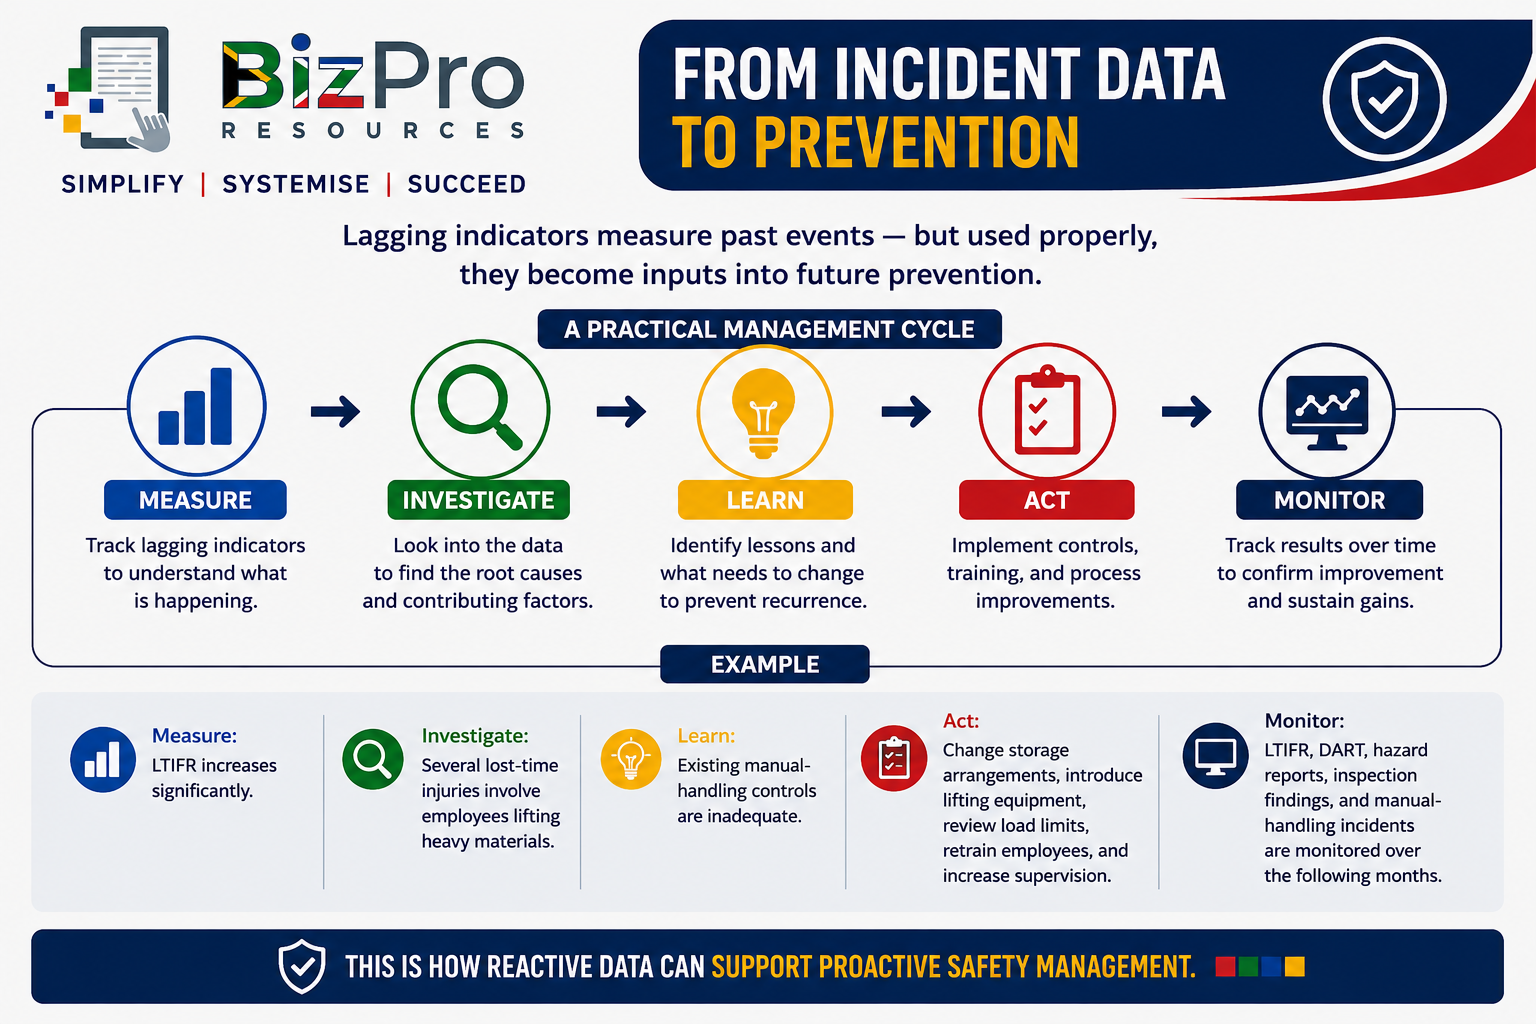
This is how reactive data can support proactive safety management.
What Does Good Lagging Safety Performance Look Like?
There is no single number that automatically means a business is safe:
Good performance should instead show a combination of positive characteristics.
Incident rates are low or improving.
Lost-time injuries are reducing.
Employees are spending fewer days away from normal work because of workplace injuries.
Serious injuries are becoming less frequent.
Severity is decreasing.
Workers' compensation claims are reducing or recurring claim categories are being successfully addressed.
Incident reporting remains honest and complete.
Serious incidents receive proper investigation regardless of the overall statistics.
Most importantly, the company learns from what has happened.
Final Takeaway
Lagging OHS indicators answer a difficult but necessary question: What have workplace incidents actually cost us in human and operational terms?
The five practical indicators covered in this article are:
Total Recordable Incident Rate (TRIR) — How frequently are recordable incidents occurring relative to hours worked?
Lost Time Injury Frequency Rate (LTIFR) — How frequently are workplace injuries resulting in lost working time?
Days Away, Restricted, or Transferred (DART) — How often are injuries or illnesses preventing employees from performing their normal work?
Severity Rate — How serious are workplace incidents in terms of lost working days?
Workers' Compensation Claims — What patterns can be identified from workplace injury and occupational disease claims?
No single metric tells the whole story.
A business can have a low incident frequency but suffer extremely severe injuries.
Another can have several recordable incidents but very few resulting in lost time.
Workers' compensation data may reveal recurring injury types that are hidden inside the overall incident rate.
That is why these metrics should be considered together.
Most importantly, lagging indicators should not be used merely to produce a safety score.
They should help management identify patterns, investigate causes, learn from incidents, strengthen controls, and prevent the same problems from happening again.
A good OHS measurement system therefore does not stop with: "What happened?"
It continues with:
"Why did it happen, and what are we going to do to prevent it from happening again?"
Related Articles in the OHS Performance Metrics Series
Leading OHS Indicators: 5 Proactive Safety Metrics Every Small Business Should Track
Leading OHS Indicators: 5 Reactive Safety Metrics Every Small Business Should Track
AI Disclaimer
AI Tools were used to assist with research. Remember to always cross-check everything that you read.


